1. Manage User Behavior Tracking
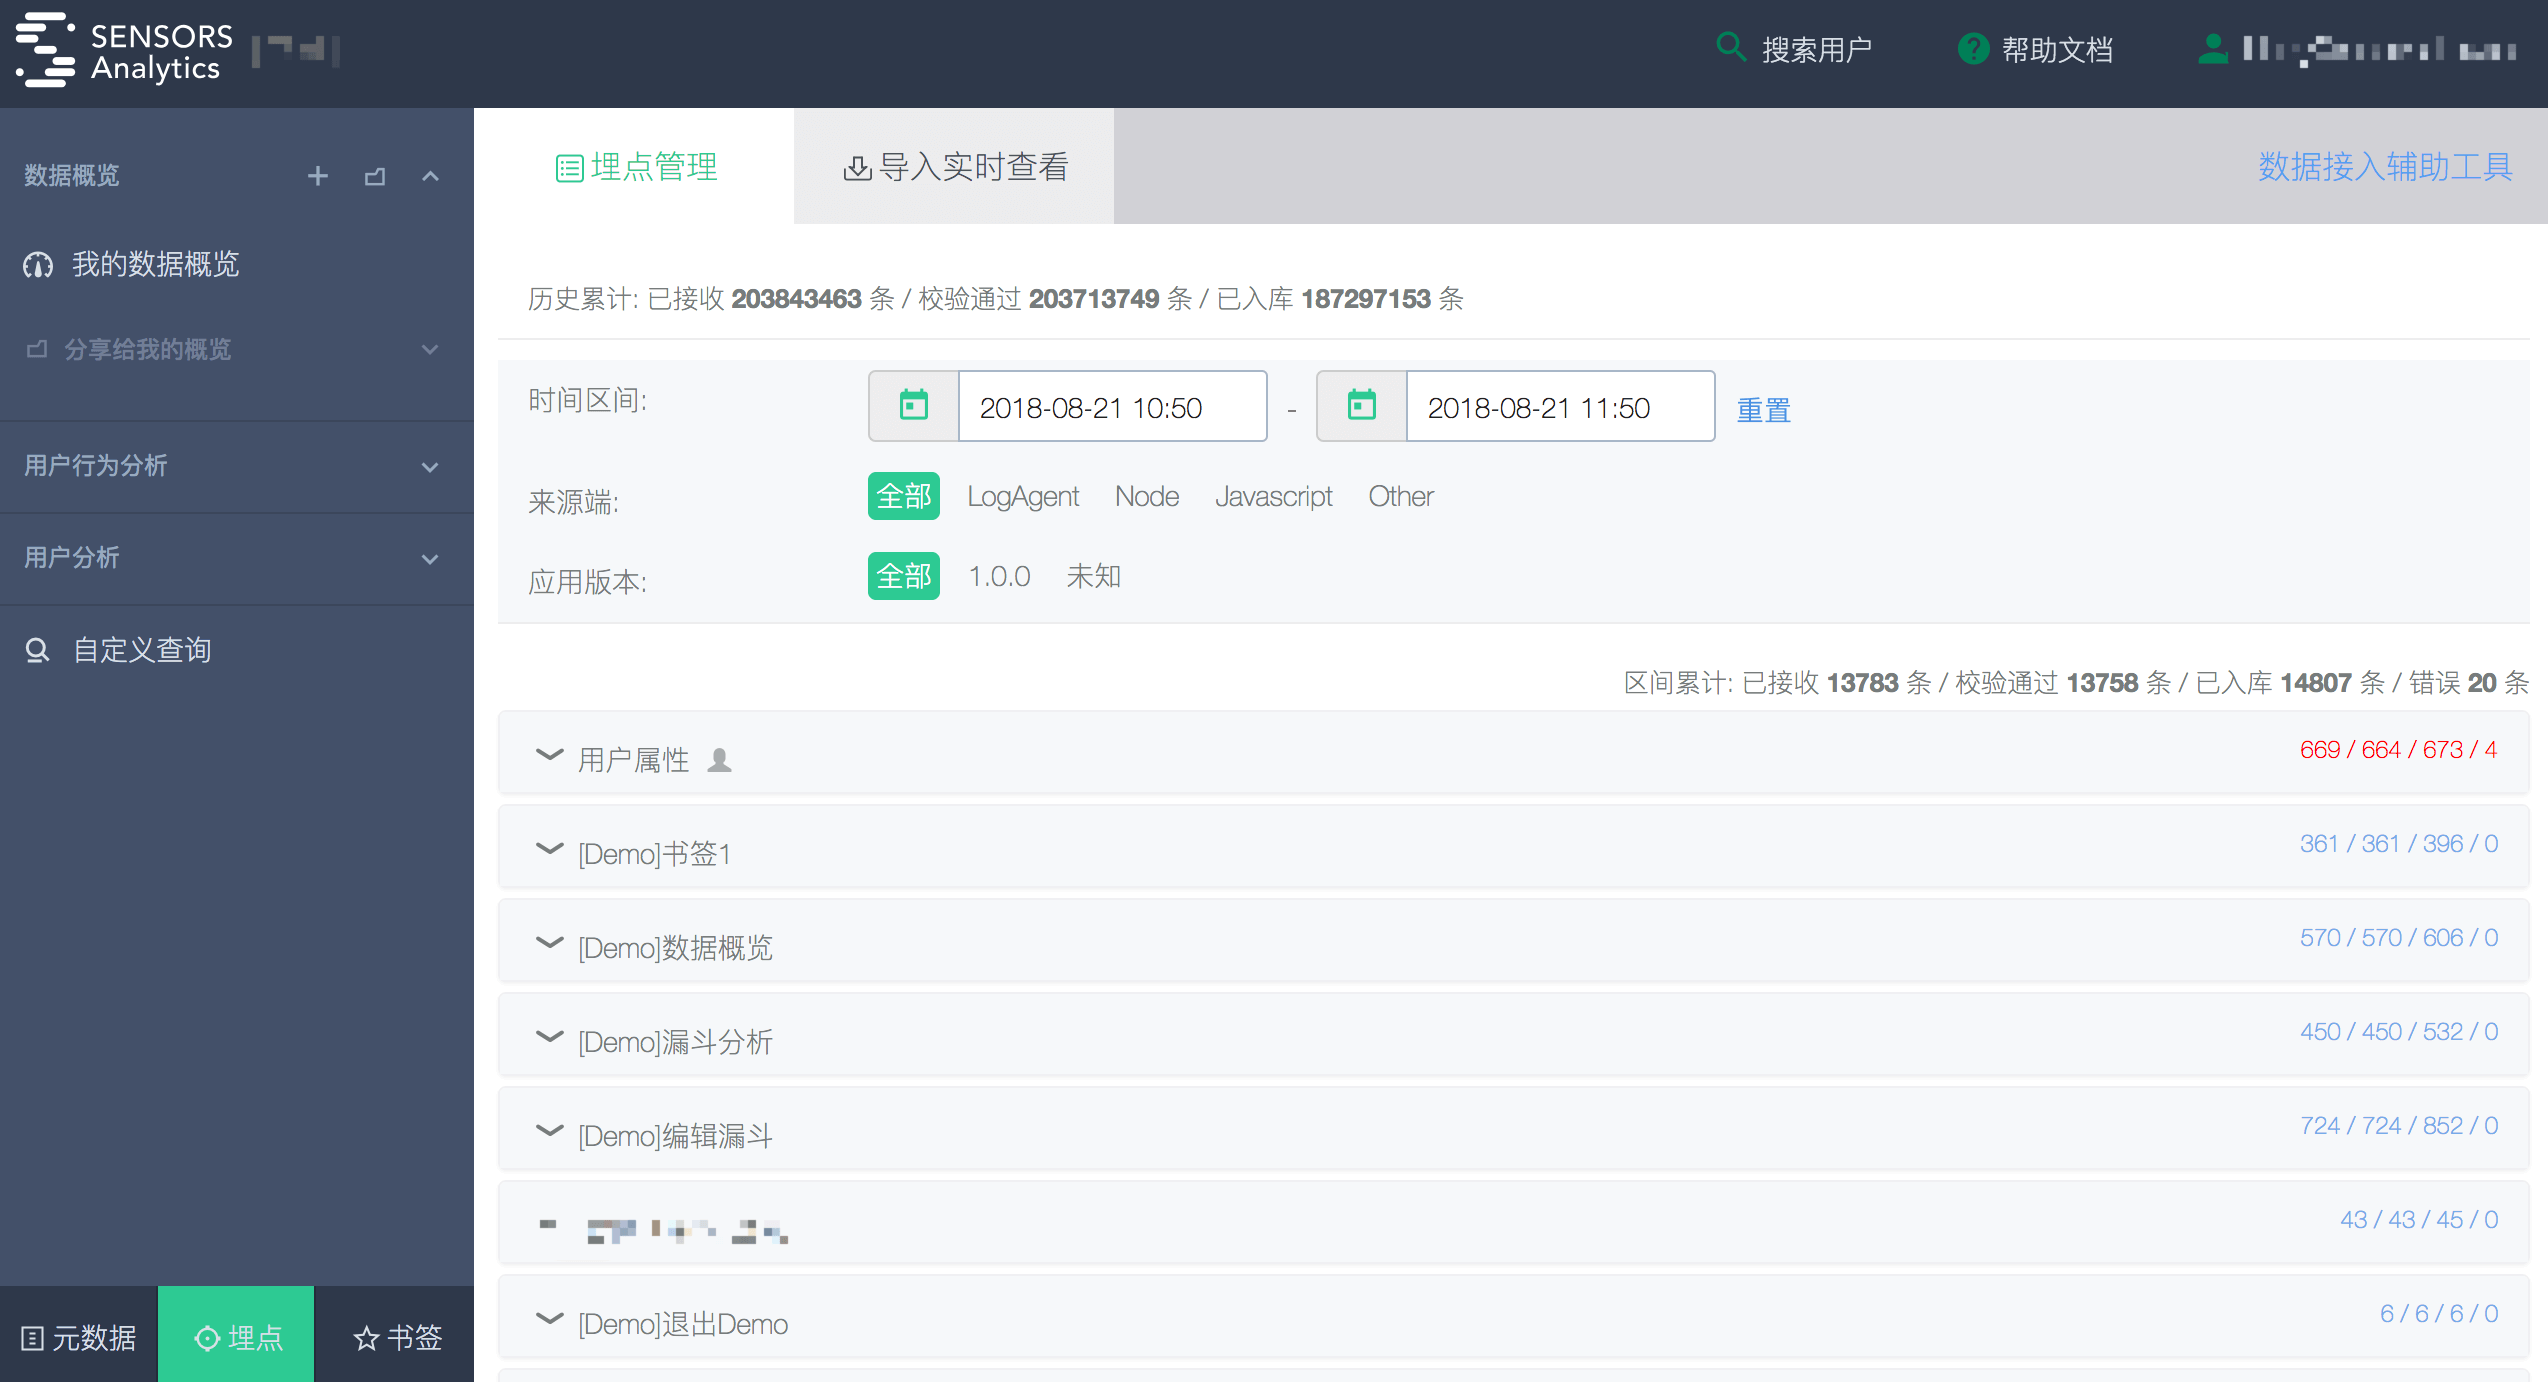
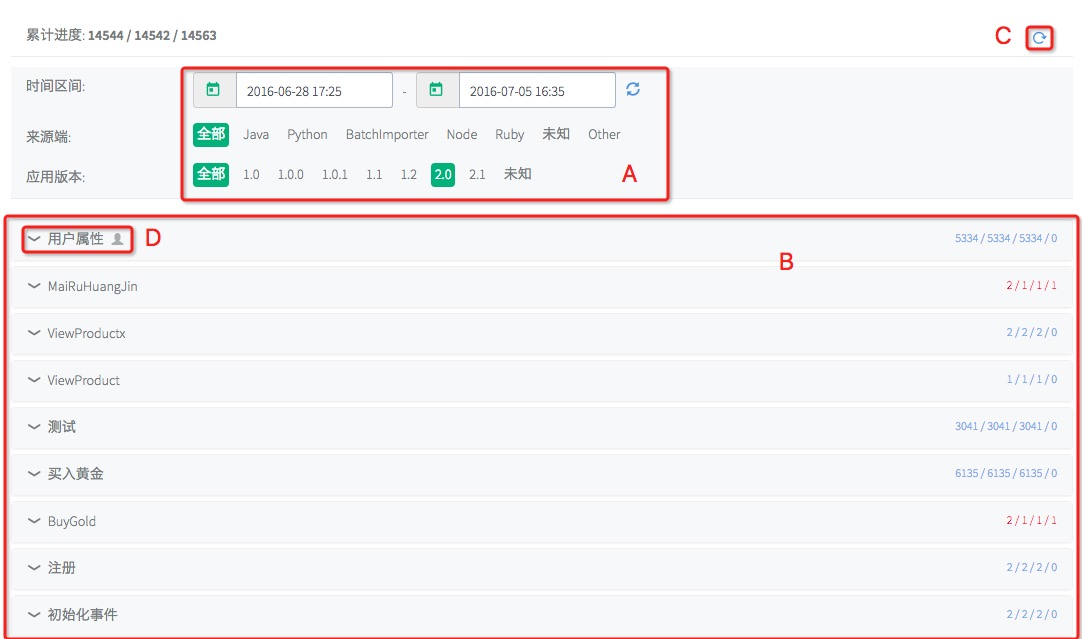
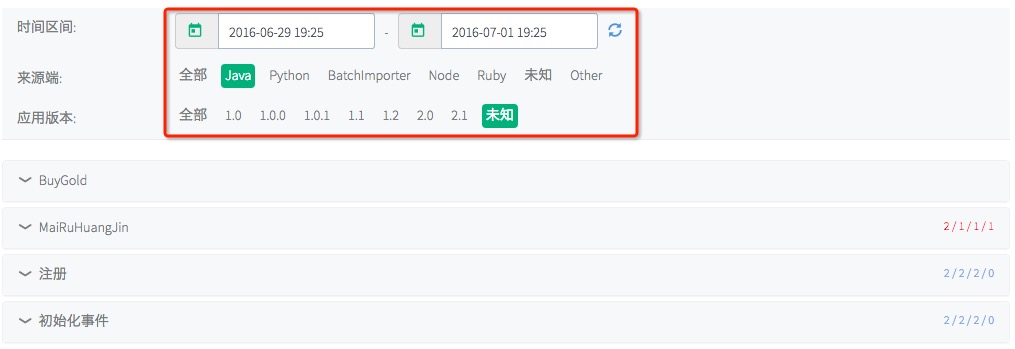
The filtering in section A has three dimensions for event tracking: time interval, source, and application version.
The default time interval is the last 7 days, and the default data view is the last 1 day. All versions and sources are selected by default.
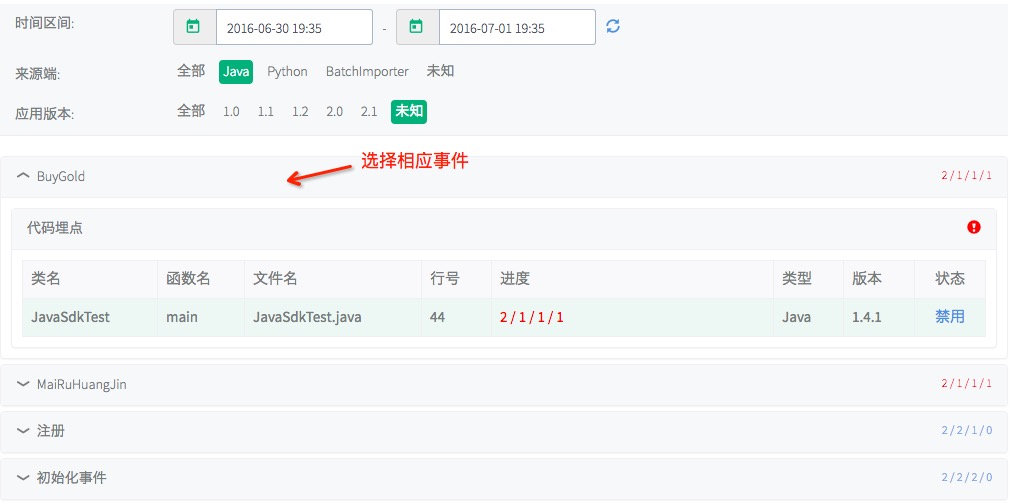
At B, you can view the event list, data import progress, and manage the status of tracking under the current conditions. Under each event, you can view the properties of each tracking method.
If it is a code tracking, you can view the class name, function name, file name, line number, type, and import progress of the tracking.

- At each tracking, you can choose to disable/enable the tracking. Note: The disable/enable operation takes effect after 1 minute. The tracking will no longer/continue to receive data 1 minute after disable/enable.
- At C, you can reset the current time interval to the last 1 day and update the selectable interval to the last 7 days. Clicking "refresh" in A only updates the end time to the current time.
- At D, the profile-related operations are displayed by default (if exist) as the first result in the query.
2. View progress and error examples
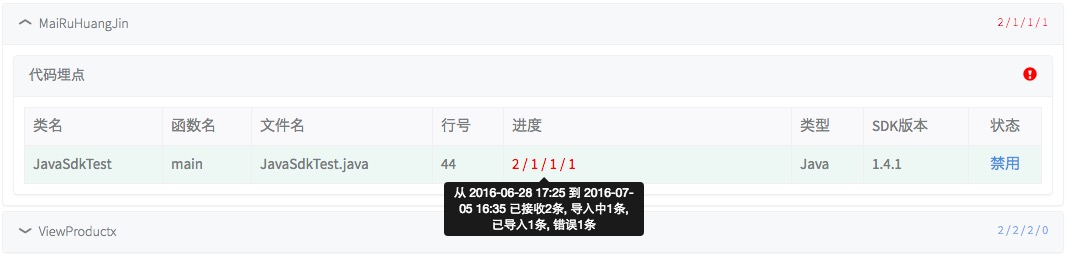
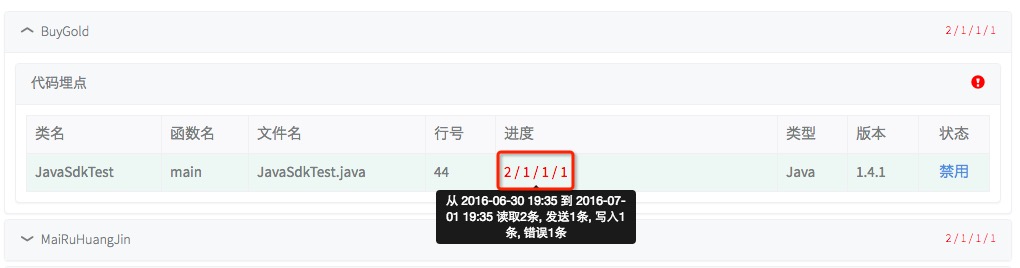
Under each granularity of event and tracking, you can view the read, import, send, write, and error counts within the current time interval.
Clicking will enter the detail view page.
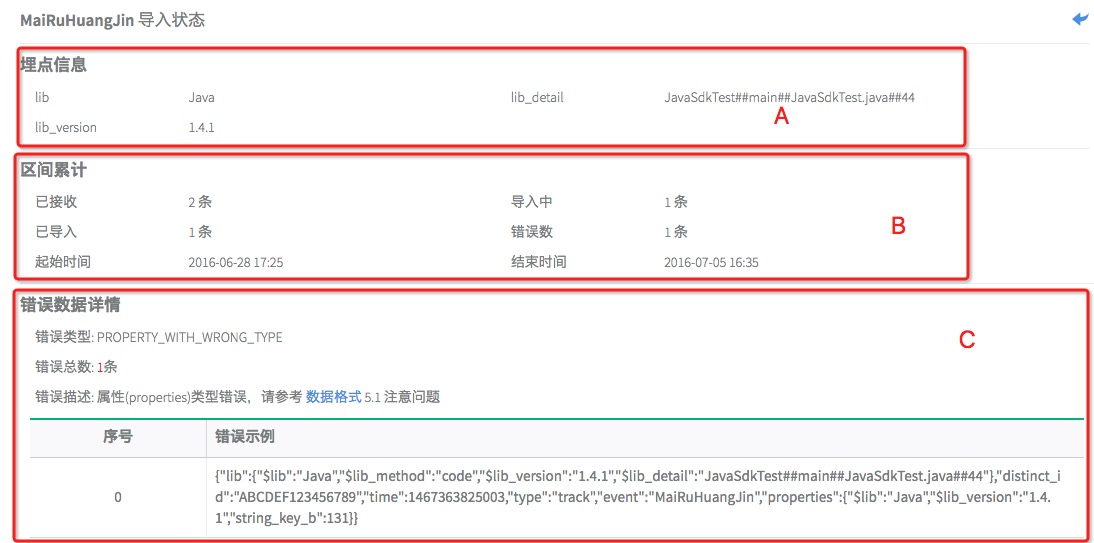
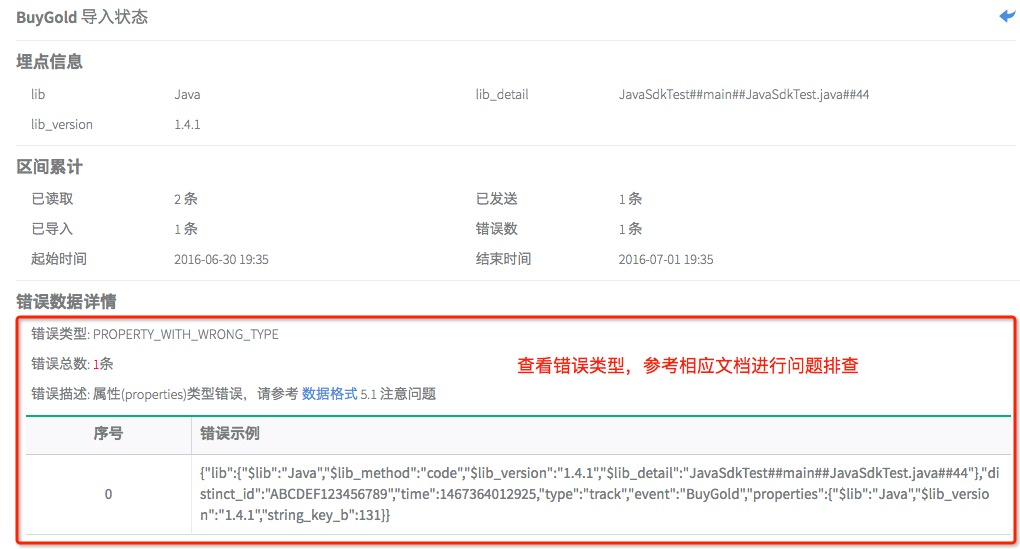
When viewing details at each granularity, interval cumulative information can be seen at 'B', and for event-level granularity, partial event properties can be seen at 'A'. At 'C', error data details can be viewed, where error counts, error descriptions, and a sample of error data can be examined based on error types.
Note:In the error details, by default, a maximum of 3 error data per minute is collected, and the top 5 are displayed.
3. Common Application Scenarios
Assuming that recently within the past 2 days (2016-06-29 19:25 - 2016-07-01 19:25), there has been an exception in importing Java SDK data for the BuyGold event. First, go to the event tracking management page and set the time range to 2016-06-29 19:25 - 2016-07-01 19:25, select Java as the source, and select 'unknown' for the application version. The event list obtained is shown in the following figure:
 Popular Searches