Distribution Analysis
|
Collect
1. Video Version Explanation
Distribution analysis explanation video
2. Distribution Analysis Overview
In version 1.6, "Return analysis" has been upgraded to "Distributed analysis", which can tell you not only how much users depend on your product, but also the distribution of users for an event metric. For example, check the user distribution of the order amount below 100 yuan, 100 yuan to 200 yuan, and more than 200 yuan.
Specify a user behavior event, and then select metrics for the event. Distribution analysis can help reveal the following questions:
- Do users use the product more times per day before and after the notification policy changes?
- Will users make repeated purchases after the first purchase?
- Assuming that users who use a key feature more than 3 times a day are counted as core users, what is the trend of the composition of core users?
View examples of the distributed analysis function
3. Distribution analysis by time statistics
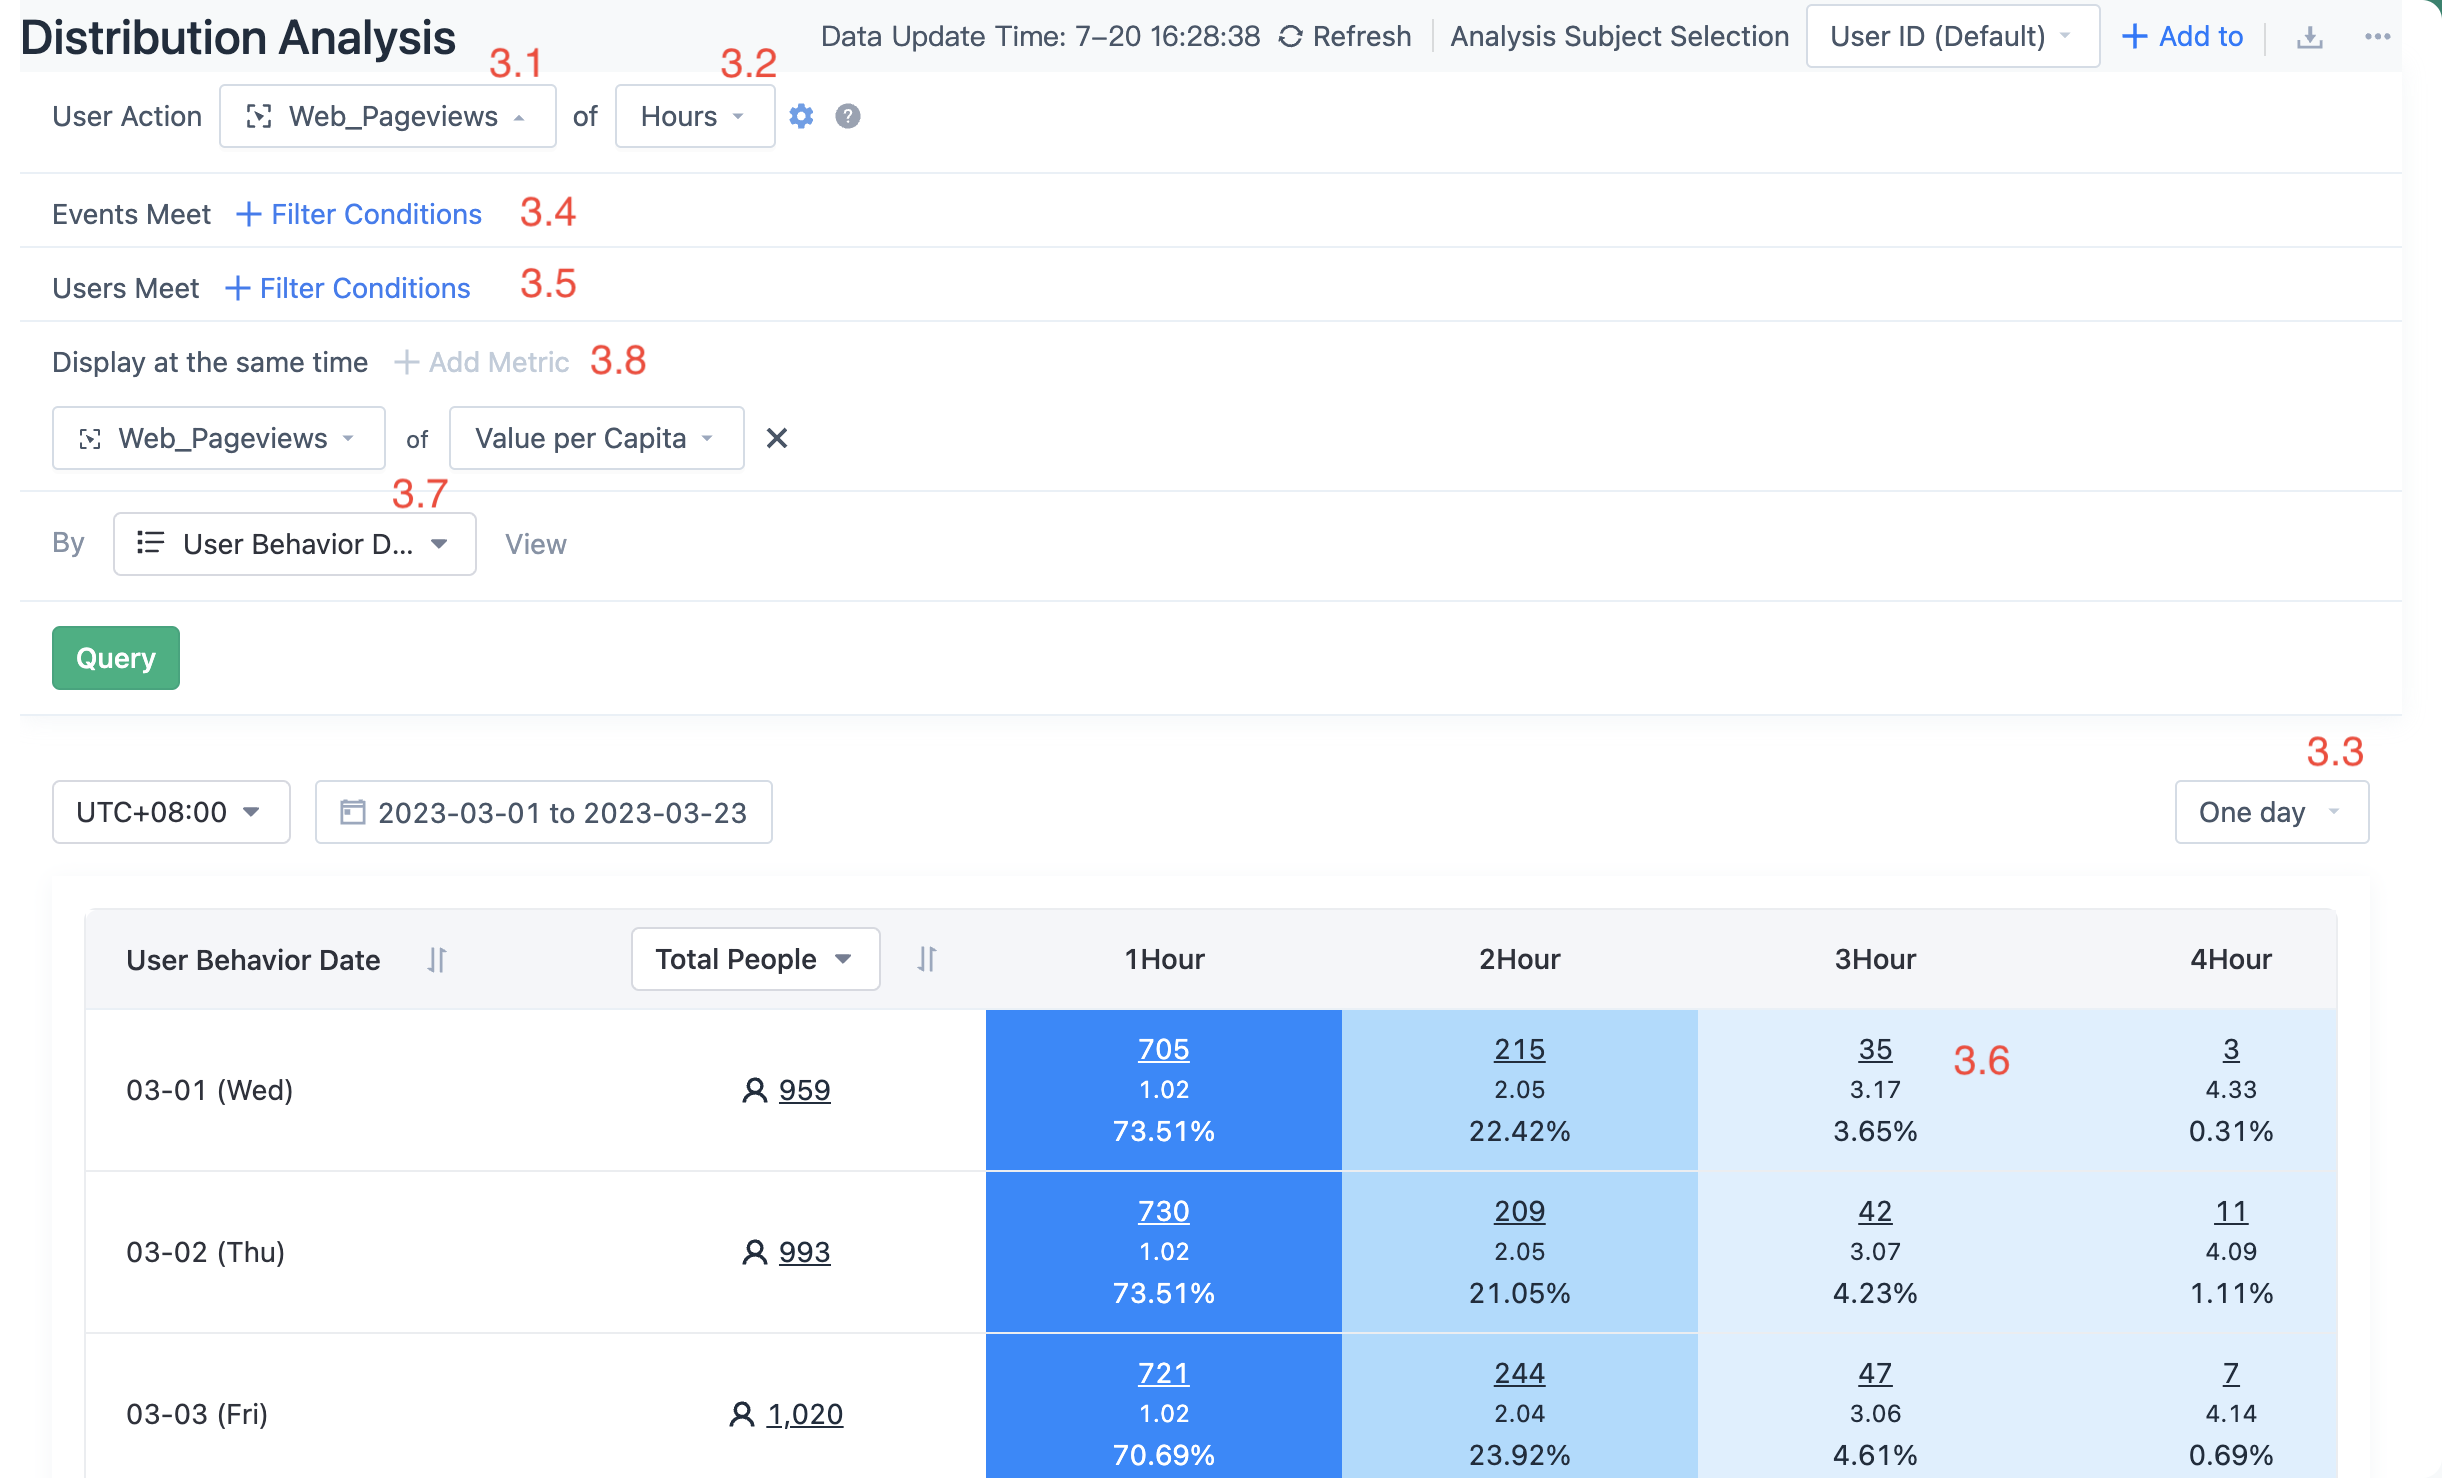
3.1. Select user behavior
The act of selecting an event to examine. For example, select "web pageview".
3.2. choose metrics
You can select metrics for distribution analysis. You can set Hours or Days or a user-defined group range. The following uses “Hours” as an example.
3.3. Selective time unit
Select the statistical time unit for the occurrence of the behavior (in Figure 3.3, select the time period or the number of times for analysis). You can choose from:
- Within a day: User behavior distribution in the 24 hours from 0:00 to 23:59.
- Within a week: User behavior distribution in 7 days from Monday to Sunday.
- Within a month: The distribution of user behavior from the first day to the last day of different months.
3.4. Sets the filter criteria for the selected event
For example, only look at the behavior distribution of the iOS version.
3.5. Set user filtering criteria
Filter suitable analysis objects based on user attributes. For example, only looking at the distribution of female users' behavior.
3.6. Behavior distribution table
The first column contains the query period specified by the user, which is divided by event occurrence unit (day, week, or month).
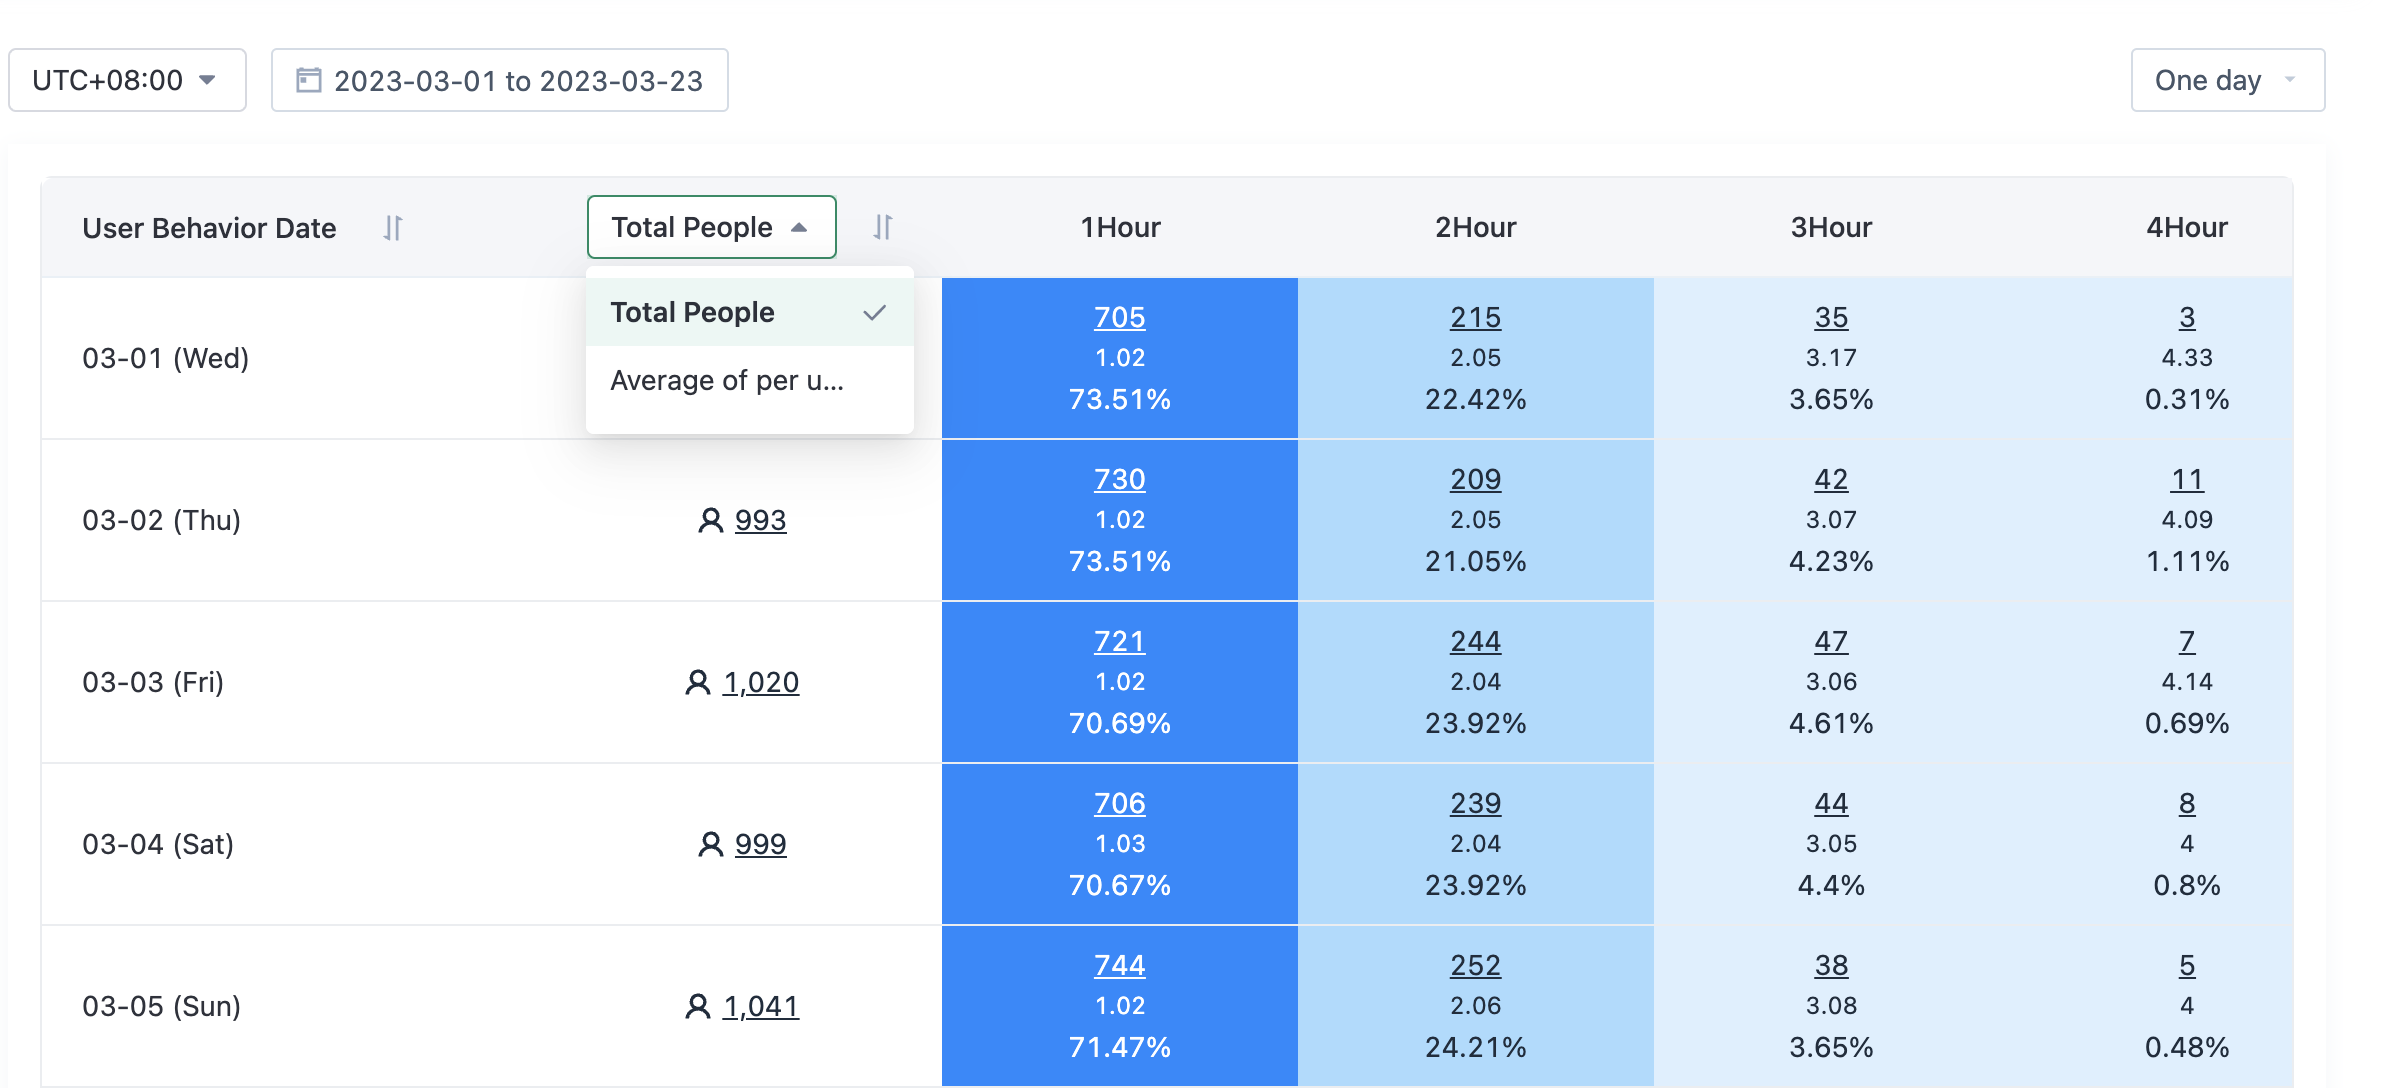
The second column is the total number of users who have engaged in behavior in the corresponding time range, and the per capita value that can be calculated within the range, for example: per capita times, per capita hours, per capita days, etc.
In the following columns, the number and proportion of users corresponding to the frequency of the behavior are shown respectively.
Hover over the cell to see what each cell number represents.
By clicking on this number, you can see the details of these users and further see the detailed sequence of behaviors of individual users.
3.7. User-defined group interval
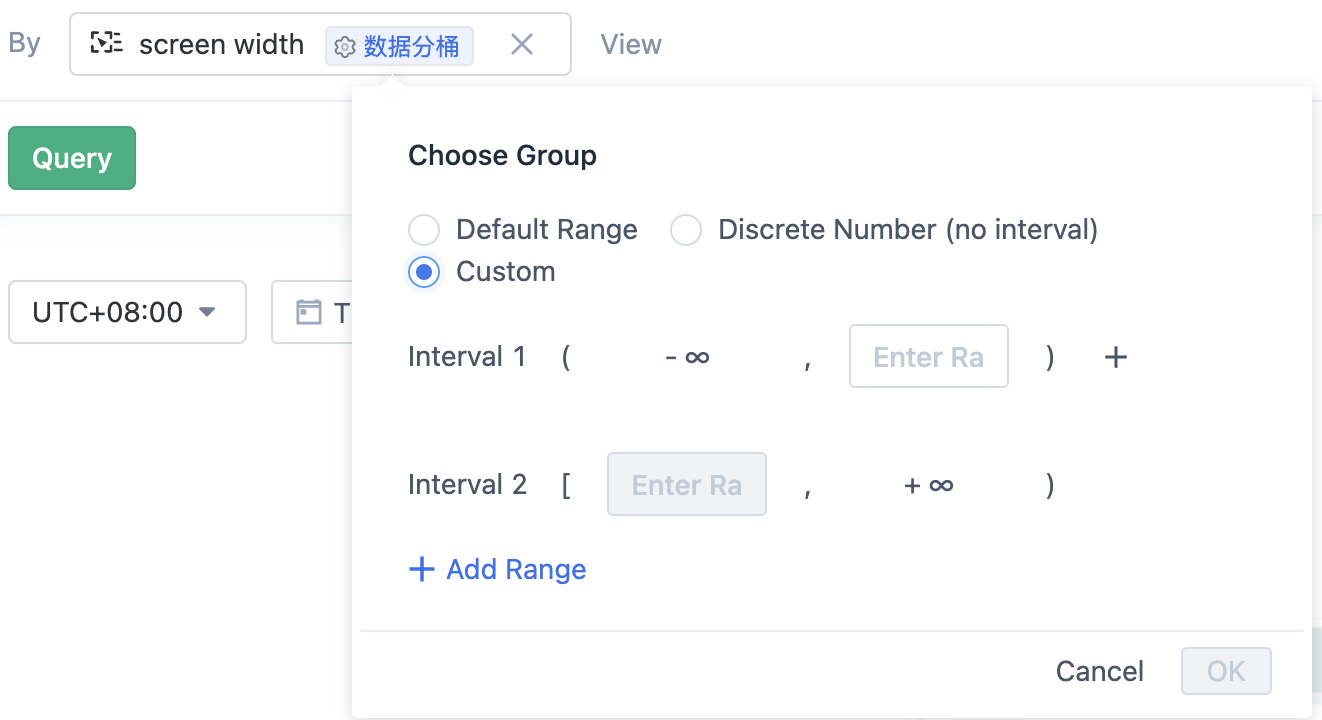
If the attribute selected here is of a numeric type, you can customize the group interval. If this parameter is not set, the query engine dynamically calculates the packet interval. This setting takes effect only for the current query and also in bookmarks after you save the query as a bookmark.
When the mouse hovers over a cell in the table, a download connection appears. Click to download the user details.
3.8. Set the indicator to be displayed simultaneously
In distribution analysis, you can add indicators that are displayed at the same time, and at the same time statistical correspondenceUser group indicator performance. For example, while viewing the distribution of consumption times, view the amount of consumption per capita.
4. Distribution analysis statistics according to the number of times
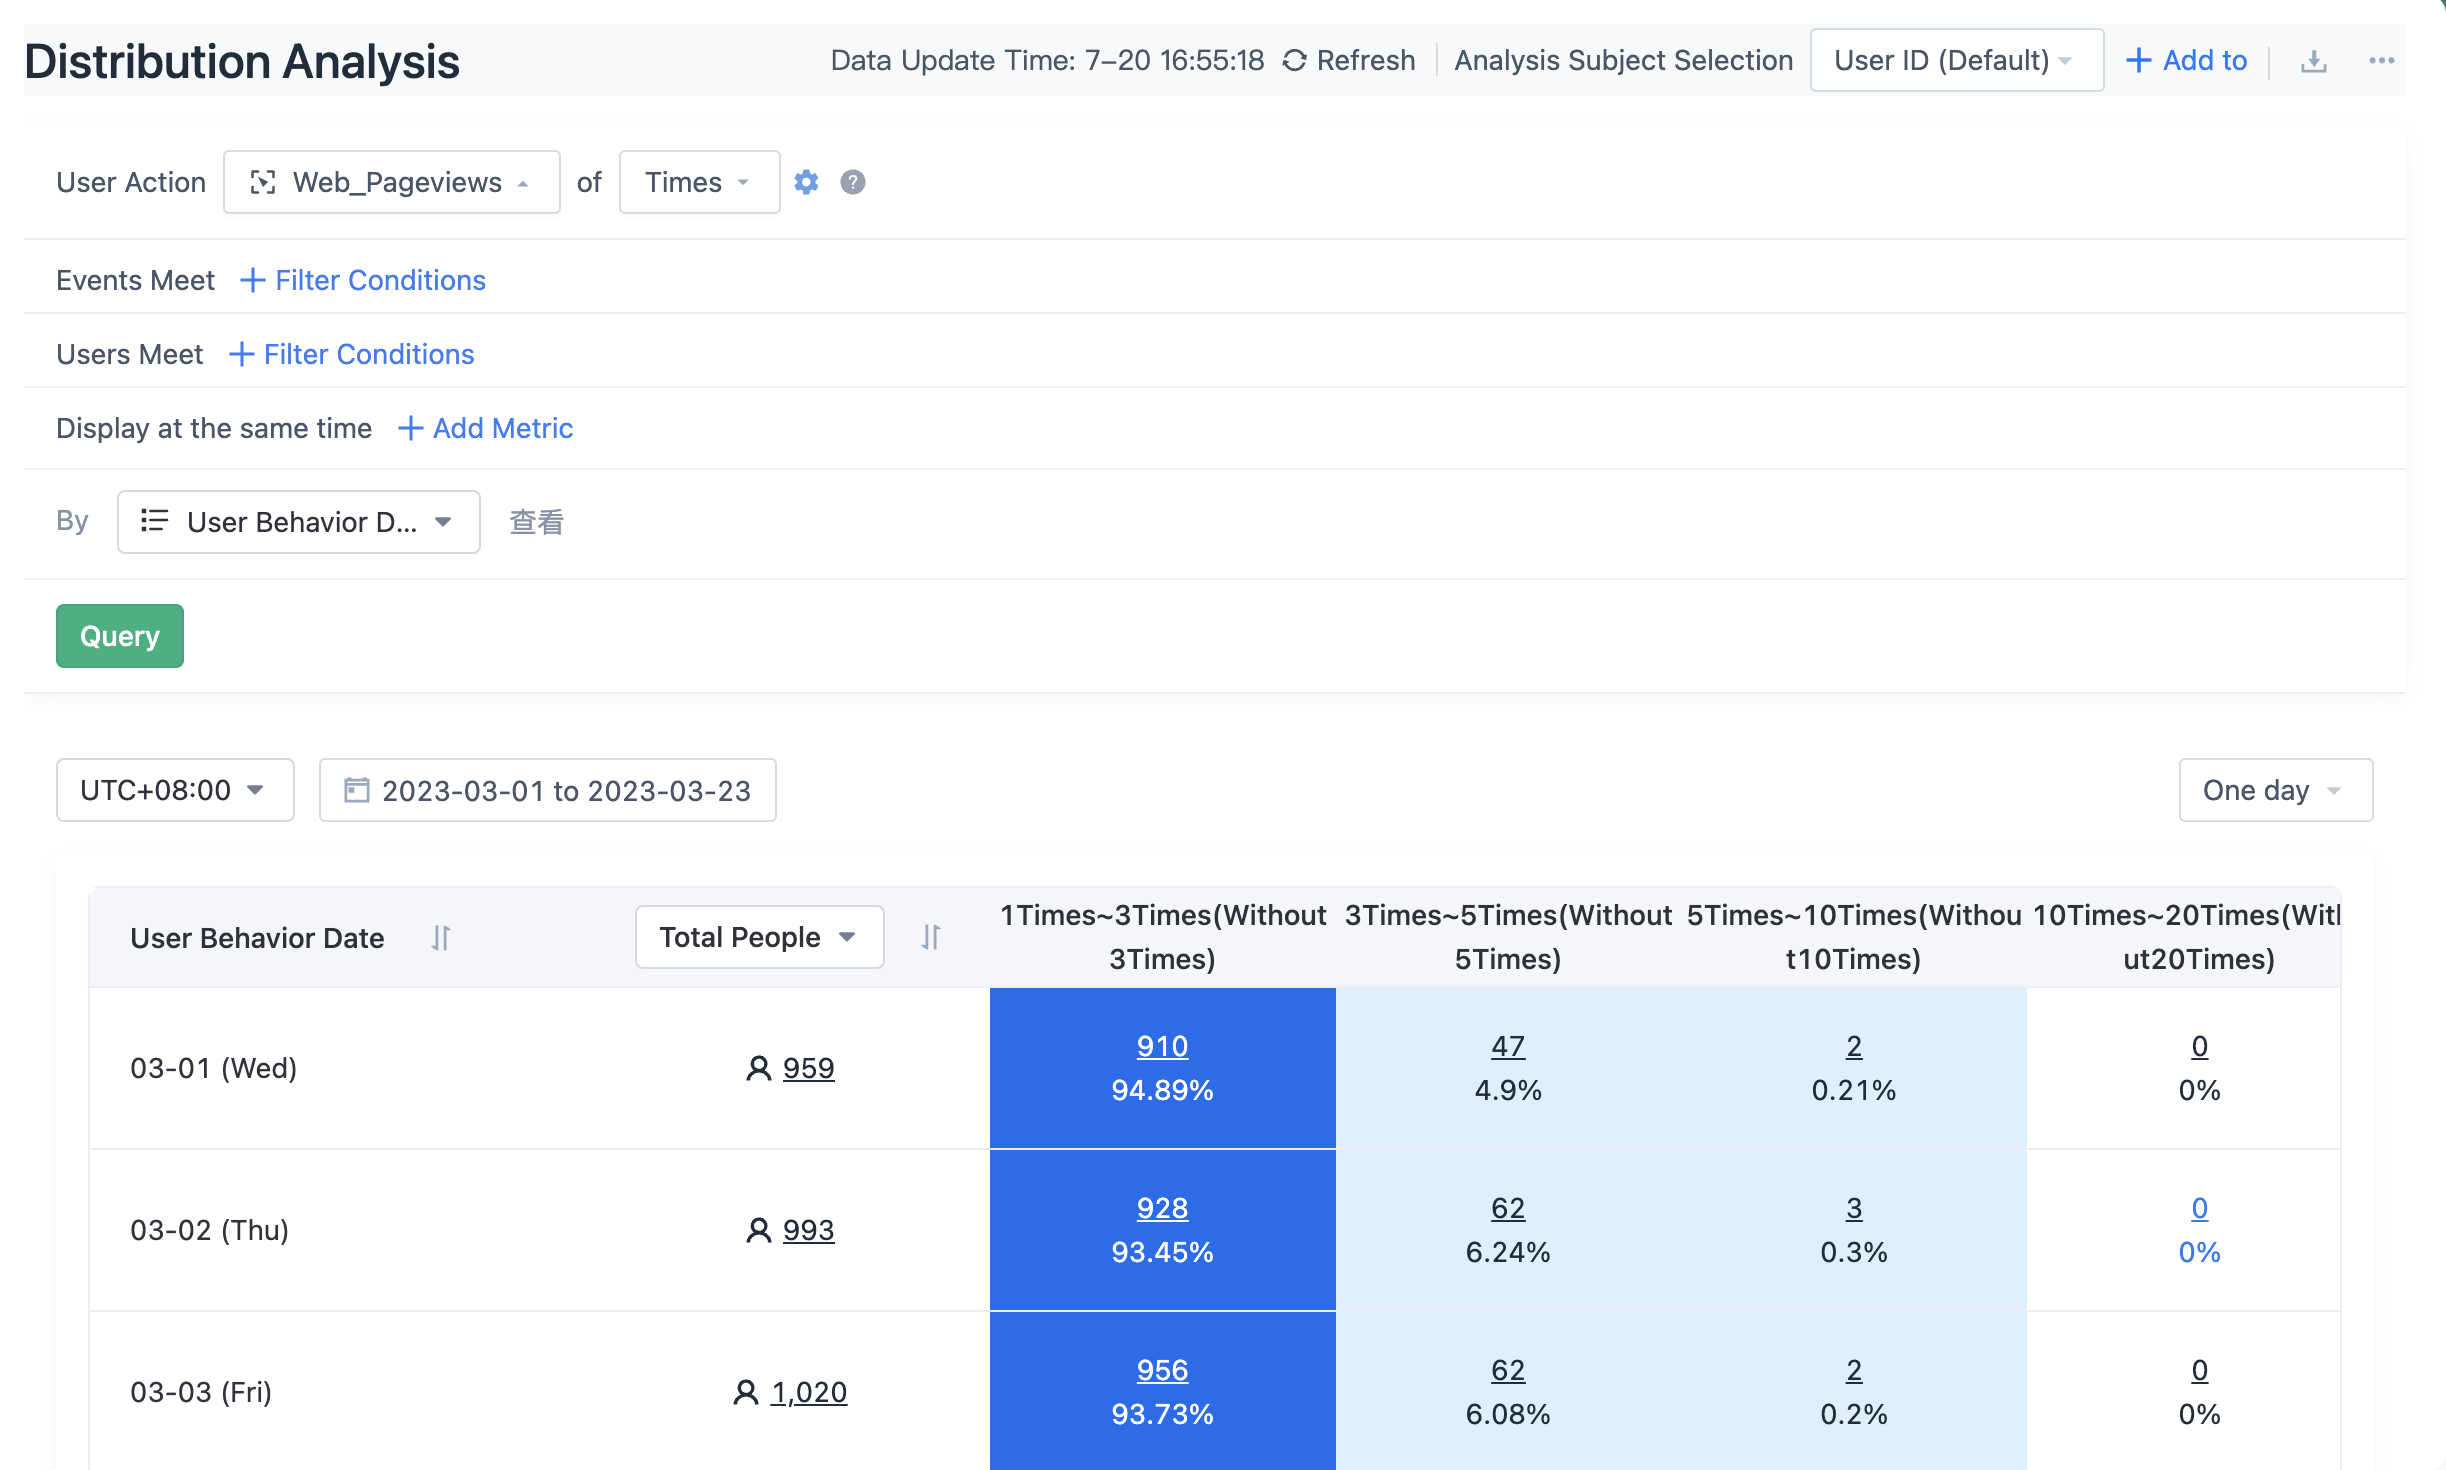
4.1. Select "Times"
The weight is not removed based on the actual number of times. You can also set a user-defined group interval.
4.2. Behavior distribution table
The above screenshot shows that there are 959 users who have carried out "web pageviews" on the day of 03-01(Wednesday), of which 910 people have carried out 1 to 3 times (excluding 3 times).
5. Distribution analysis statistics according to event indicators
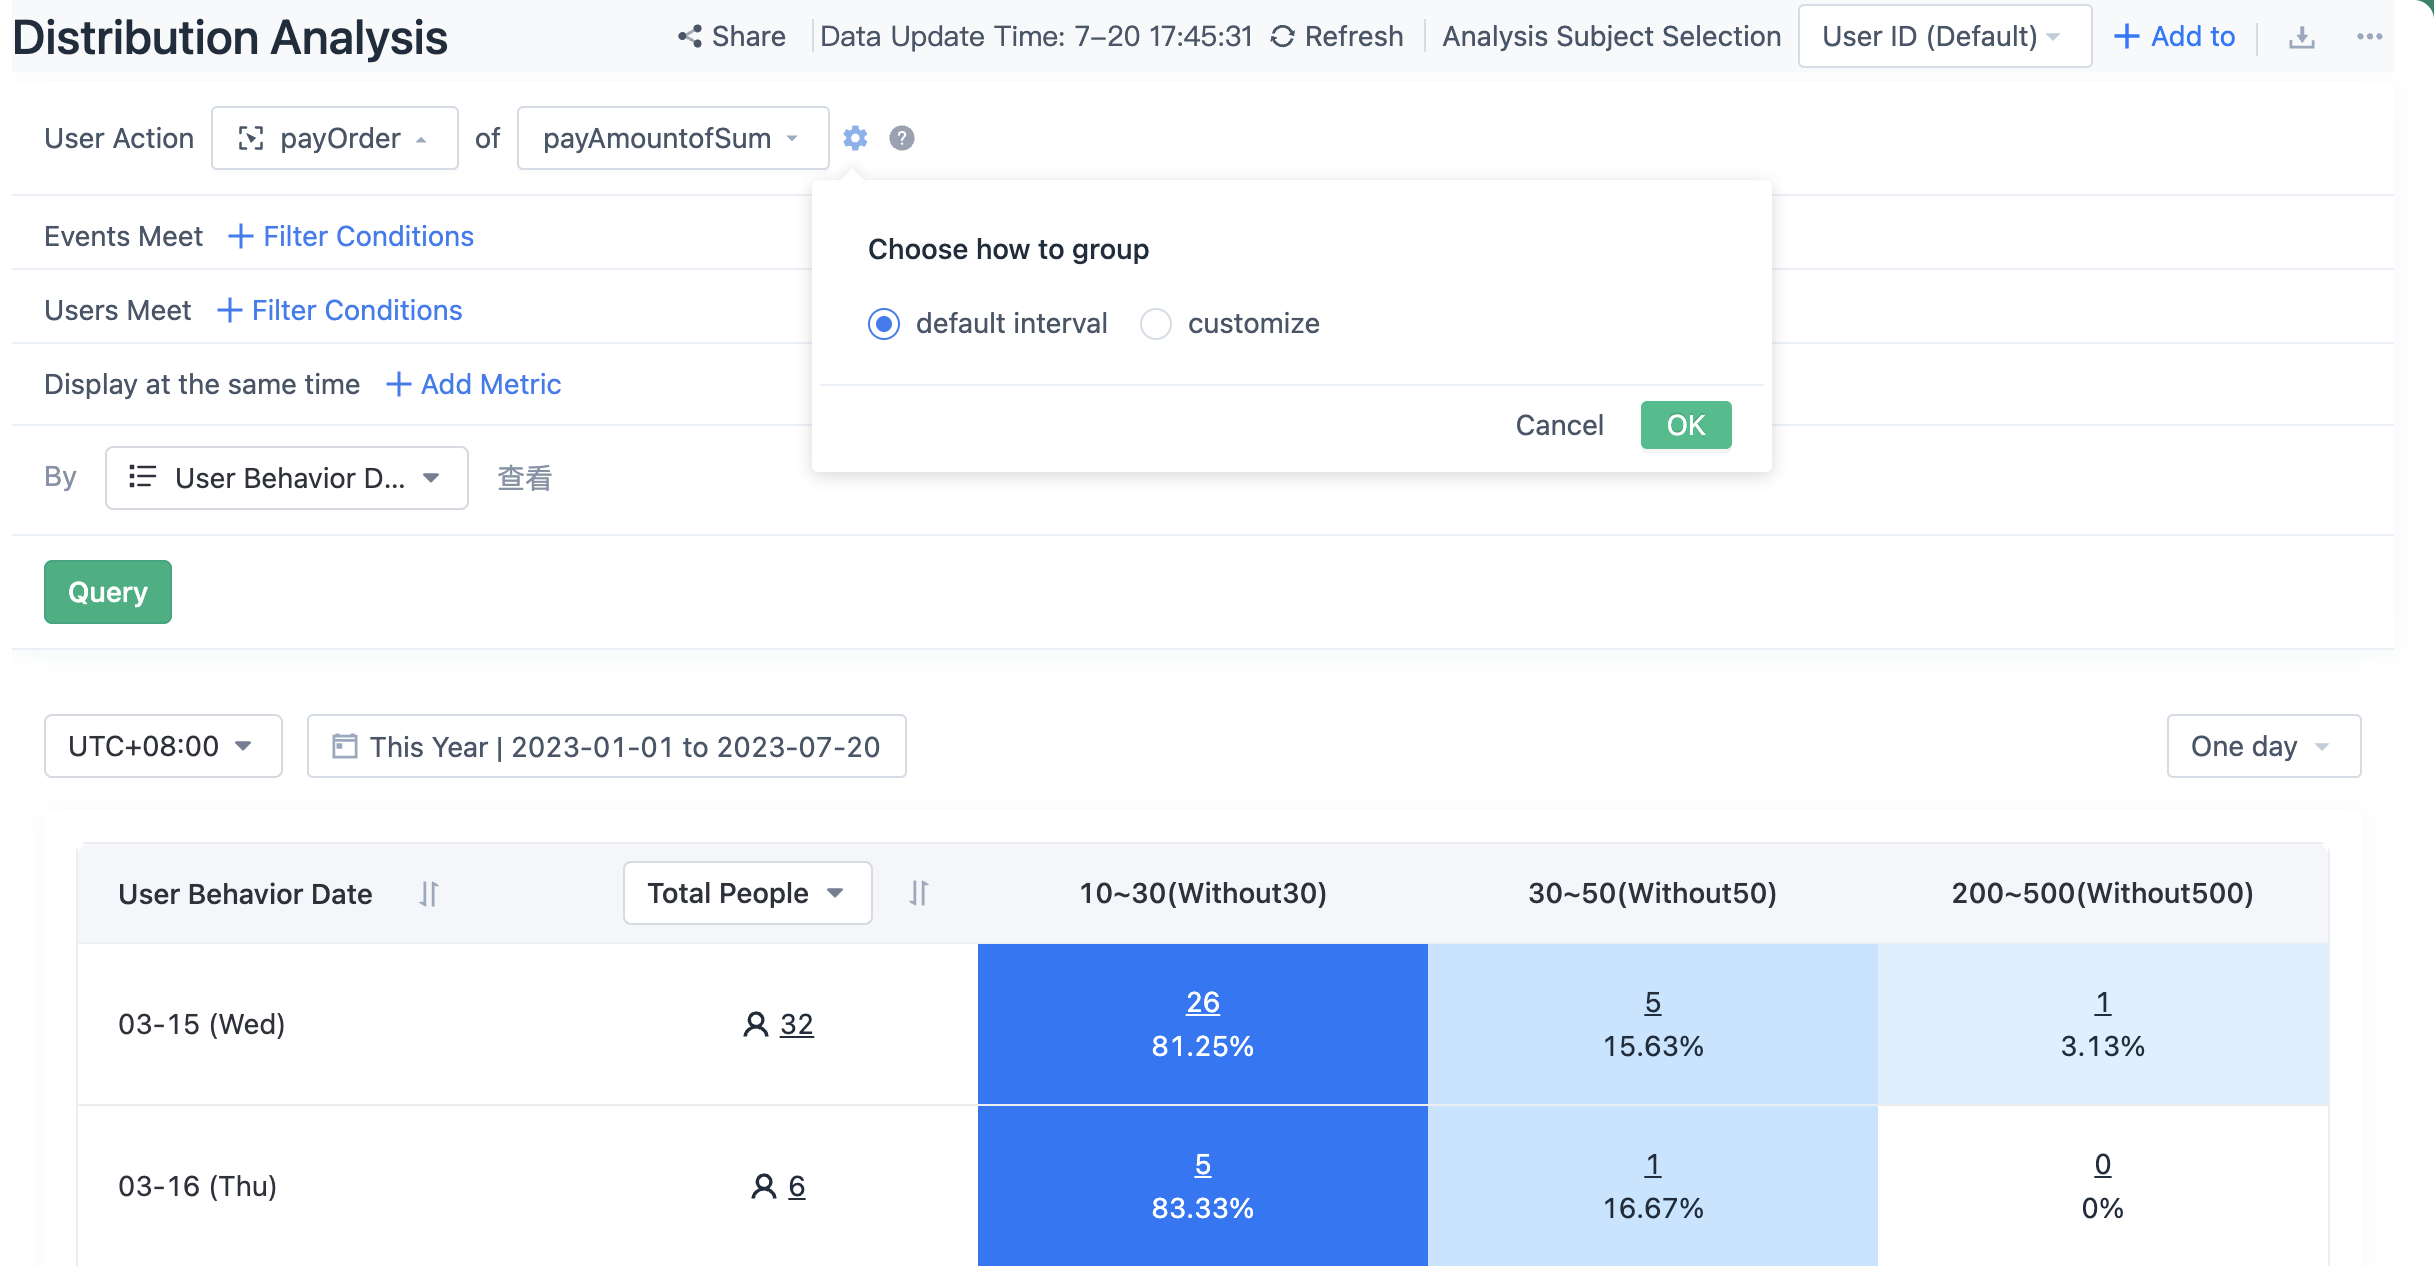
Indicator selected "Sum of pay amount", on 03-15, 32 people paid orders, and 26 users paid between 10 and 30 (excluding 30).
6. How is the distribution analysis calculated?
There are three statistical methods for distribution analysis: by time period, by times and by event attribute. You can customize the interval when you select metrics for times and events.
6.1. Statistics by time period
Calculates the number of natural time periods (hours/days) in which a user performs an operation in a day, week, or month.
Take the "number of hours" analysis of "click ads" in "one day" as an example. If a user "clicks on ads" 3 times between 15:00 and 16:00, and "clicks on ads" 1 time between 17:00 and 18:00, it is counted as "clicks on ads at least 2 time period a day". The user "clicks on ads" once or more times in an hour is counted once.
Days of an event in a week or a month indicates the number of days of an event triggered by the user in a week or a month.
6.2. Count by times
Number of operations performed by a user in a day, week, or month. Once an operation occurs, a record is made.
6.3. Statistics based on the statistical indicators of event attributes
Statistics Indicates the statistical indicator value of an attribute of an event that occurs in a day, week, or month. The statistical indicators of the attribute are consistent with the event analysis, including the sum, the mean, the maximum, the minimum, and the de-duplication number.
7. FAQ
7.1. Why is distribution analysis better than daily active User(DAU) alone?
The daily active user(DAU) can only tell you the change of the number of users, but the distribution analysis can reveal the change of the dependence of individual users on the product. For example, although the number of active users of a product did not increase significantly between March and April, the frequency of key user behaviors (such as placing orders, or Posting content) increased significantly, indicating that the value of the product to users increased. On the other hand, if daily activity is growing fast, but the frequency of behavior is at a lower level than before, it is likely that the new active users do not truly feel the value of the product.
Note: The content of this document is a technical document that provides details on how to use the Sensors product and does not include sales terms; the specific content of enterprise procurement products and technical services shall be subject to the commercial procurement contract.
 Popular Searches