Funnels Analysis
|
Collect
1. Explanation video
Funnels Analysis Basic Feature Explanation Video
Funnels Analysis Advanced Feature Explanation Video
Before introducing Funnels Analysis, some basic concepts need to be introduced:
- Step: It refers to a key step in a conversion process that is composed of one or more filtration conditions with an element event/virtual event.
- Time range: The time range selected on the interface refers to the time range when the first step of the funnel occurred.
- Window period: The time limit for the user's completion of the funnel is that only if the user progresses from the first step to the final step within this time range, it can be considered as a successful conversion.
2. Overview of Funnels Analysis
The funnel model is mainly used to analyze the conversion and churn of each step in a multi-step process.
For example, the complete process of a user purchasing a product may include the following steps:
- Browse the product
- Add the product to the cart
- Settle the items in the cart
- Select shipping address and payment method
- Click the payment button
- Complete the payment
This process can be set as a funnel to analyze the overall conversion, as well as the conversion rate and conversion median time of each step. Meanwhile, with the powerful filtering and grouping functions of Sensors Analytics, you can do deep analysis
View an example of Funnels Analysis application
3. Introduction to Funnel Interface Features
3.1. Create a funnel
Click the "Create Funnel" button at the top right of the interface, and the "Create Funnel" panel will slide out.
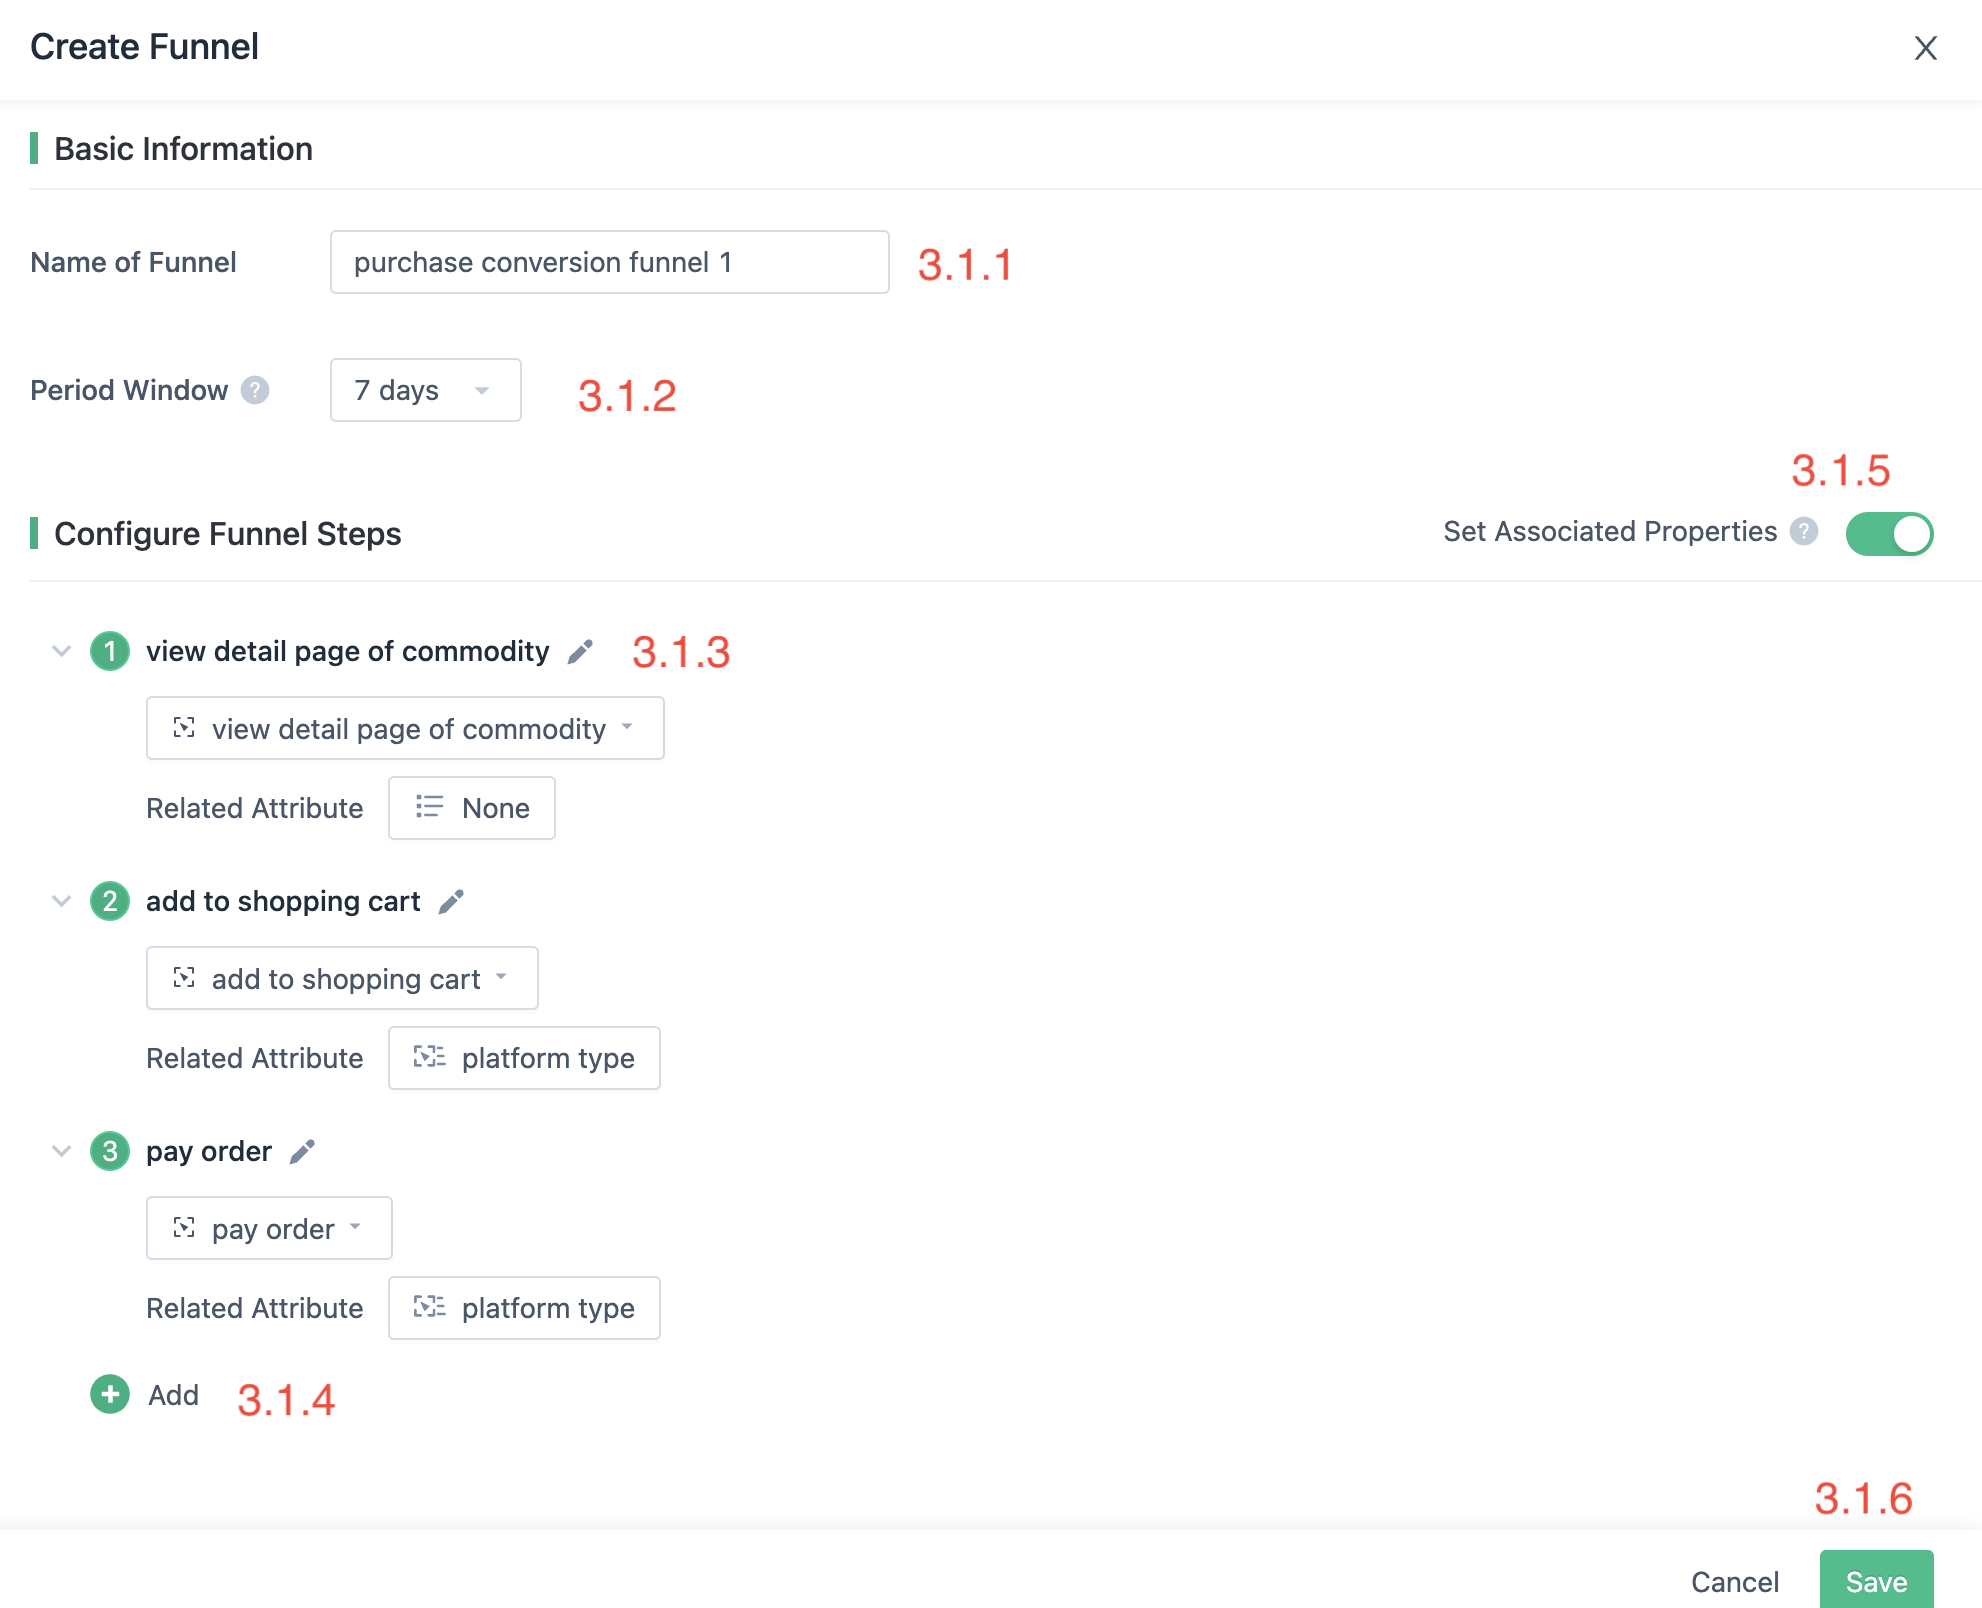
3.1.1. Funnel name
A required field. Give your funnel a representative and friendly name. Funnel names cannot be duplicated within the same project. The funnels you create are visible to other users in the same project.
3.1.2. Funnel window period
Window Period: Time limit for completing a funnel. After a user performs the first step, the user has to complete the last step within this time range to be considered a successful conversion.
You need to choose a reasonable validity period here based on the nature of the funnel. The default validity period for a funnel is 30 days. Starting from version 1.4, in addition to the limited options provided in the drop-down list, the window period can be customized by users. The minimum period is 1 minute, and the maximum is 3650 days.
3.1.3. Funnel Steps
Step: A critical step in a conversion process consisting of one element event/virtual event and one or more filtering conditions.
A funnel must contain at least 2 steps, each corresponding to an event (with one or more filtering conditions).
For example, a step can be triggered by "registration" and "invitation code used" or "purchase" and "category equals to women's clothing".
Drag the number in front of each step to change the order of steps.
Starting from version 1.4, funnel steps can be given aliases for easier readability.
3.1.4. Add Step
Add more steps to the funnel.
3.1.5. Funnel Property Association
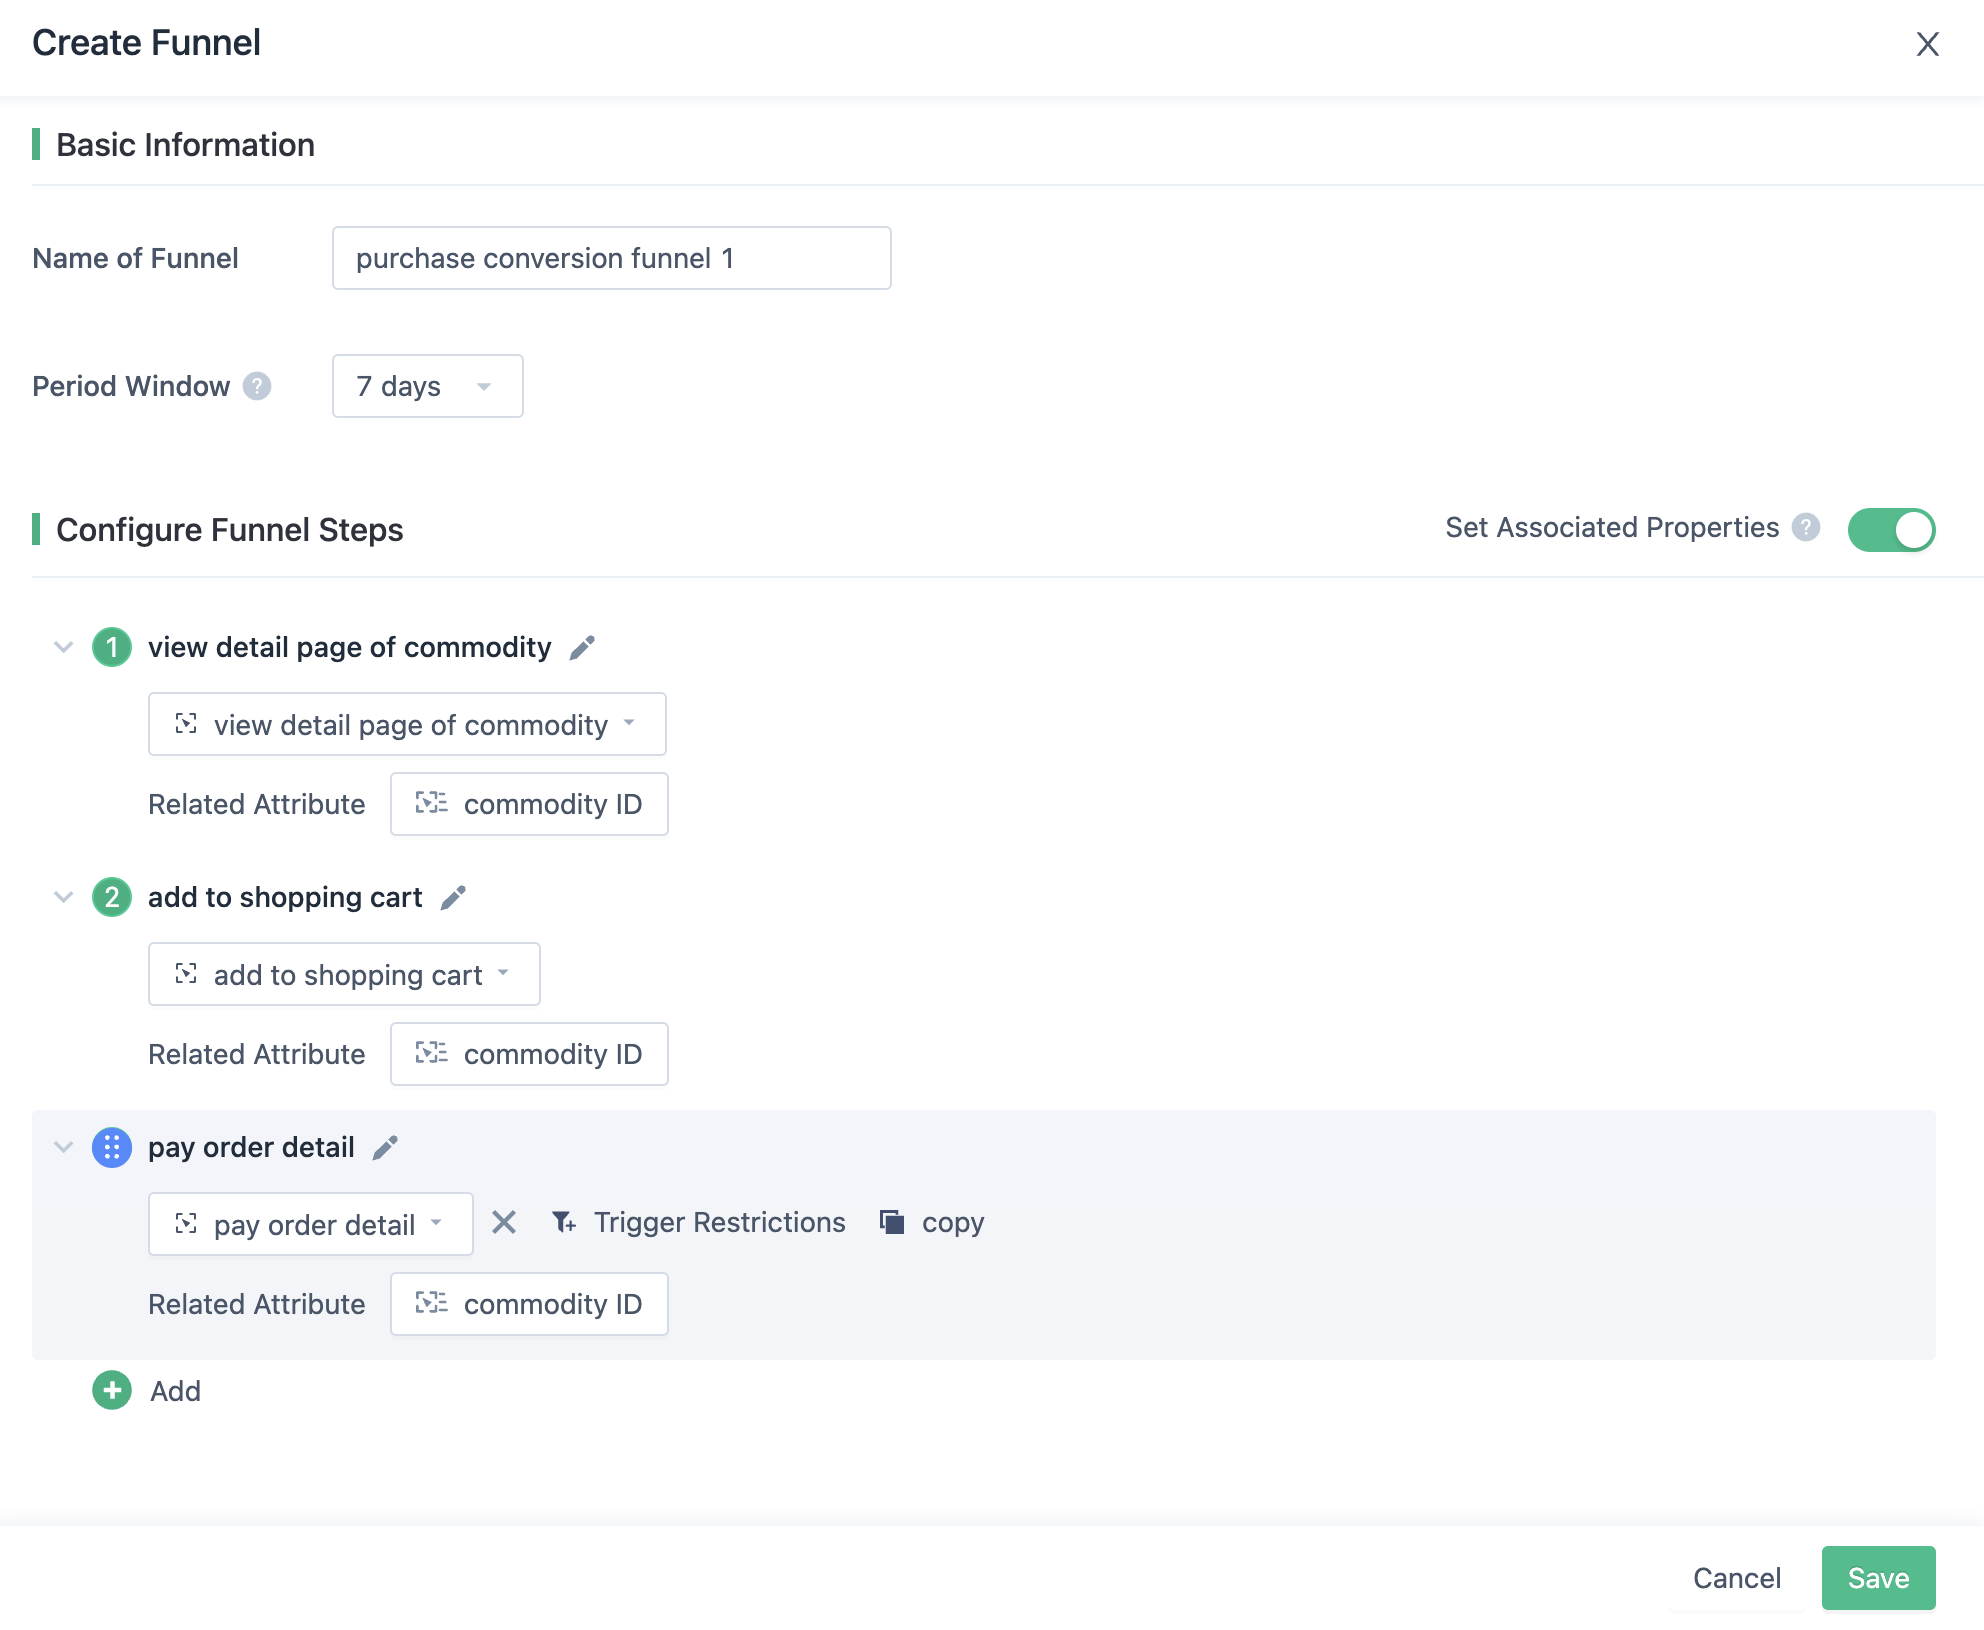
It supports associating the attributes of any steps in the funnel. For example, if you need to precisely understand whether a user has browsed a specific commodity and completed a purchase, and the created funnel is to view the commodity detail page → submit order → pay order, and the commodity ID has been set as an attribute in each event, then this attribute can be used as a correlation ID to ensure that the same commodity that the user views is the same as the one that the user purchases. If the commodity ID is not set as a correlated attribute, the user's browsing and payment of the commodity is not the same, and will also be counted as a successful conversion.
The attributes associated with different steps in a funnel can be the same or different, but the attribute types must be consistent. For example, in the "view detail page of commodity" event, a commodity ID is used to identify a product, and in the "pay order" event, a commodity ID is used to identify a commodity. In this case, the commodity ID and the product ID can be used separately as correlated attributes.
3.1.6. Save Funnel
Click this button to save the new funnel.
3.2. Analyze the Funnel
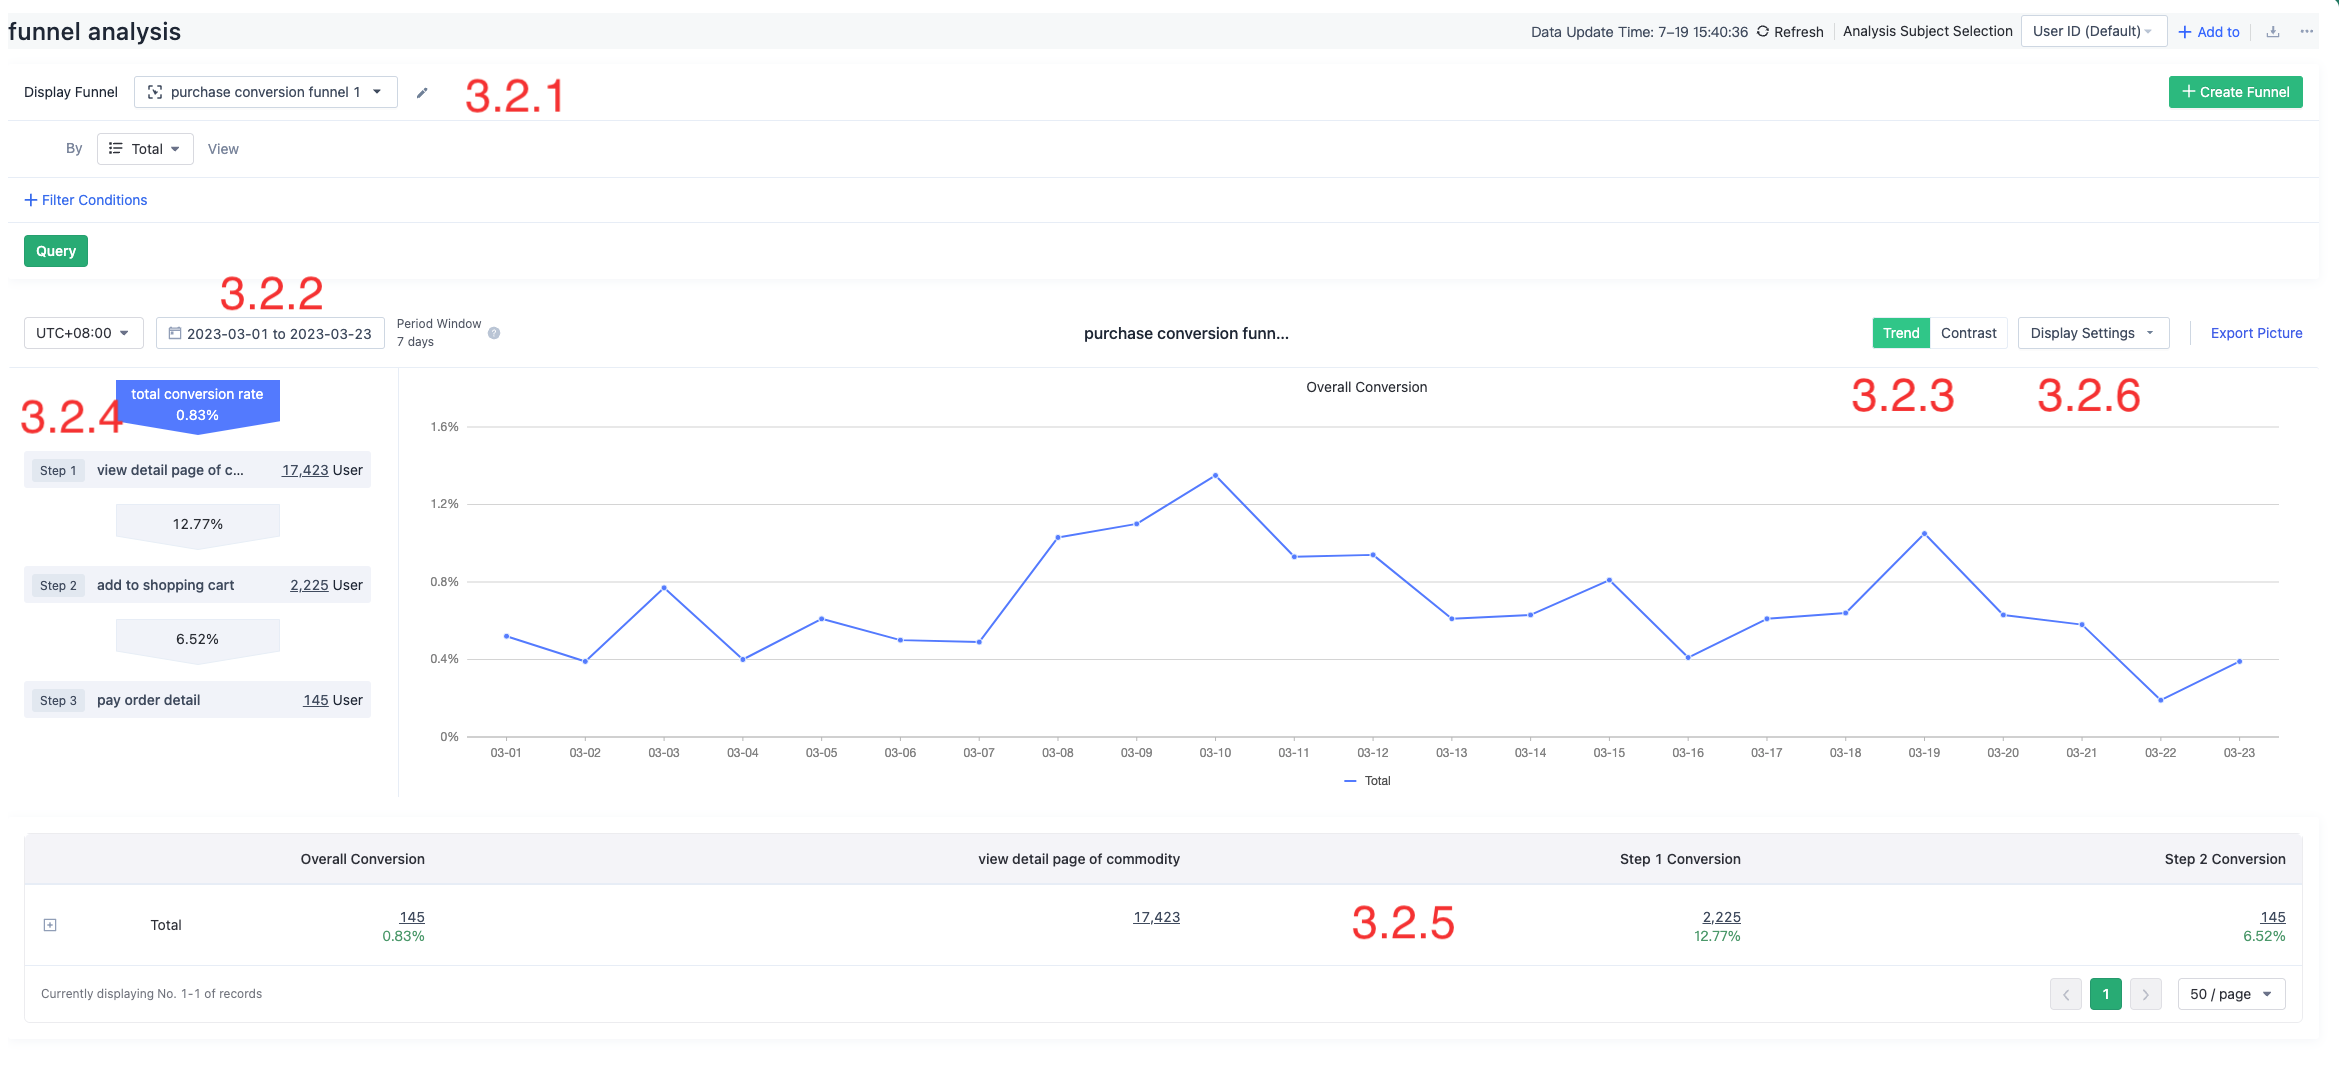
3.2.1. Switch between funnels, select calculations by people/times, view by grouping, and filter.
Here, you can switch the displayed funnel data, choose to calculate by people/times, or group and filter existing funnel queries.
Calculation by people/times: This is an advanced feature that is not enabled by default, calculated by “people”. If you need this feature, please contact customer service to enable it.
Calculation by people/times: What numbers in the funnel represent?
- Calculated by people: The number represents the number of independent users converted/lost instead of the number of times the event was triggered. Within that time range, even if a user completes a funnel multiple times, it is counted only once.
- Calculated by times: The number represents each conversion, and it is counted once every time a user triggers a starting event within the selected time range.
User segmentation and filtering conditions include two types of fields: event properties and user properties at each step.
Segmentation rules
- YY attribute of XX step:
- Calculate by people: Segments based on the YY attribute value of the XX step in each user's first and longest conversion state. A user will only appear in one group. If the user does not convert to this step, they will be grouped into the unknown group.
- Calculate by times: Segments based on the YY attribute of the XX step in each conversion. If the user does not convert to this step, they will be grouped into the unknown group.
- User attributees: Segmentation based on user attributes.
Filtering rules
- YY attribute of XX step:
- Calculate by people: Filter based on the YY attribute value of the XX step in each user's first and longest conversion state.
Calculate by times: Filter based on the YY attribute of the XX step in each conversion.
- User attributes: Filter based on user attribute values.
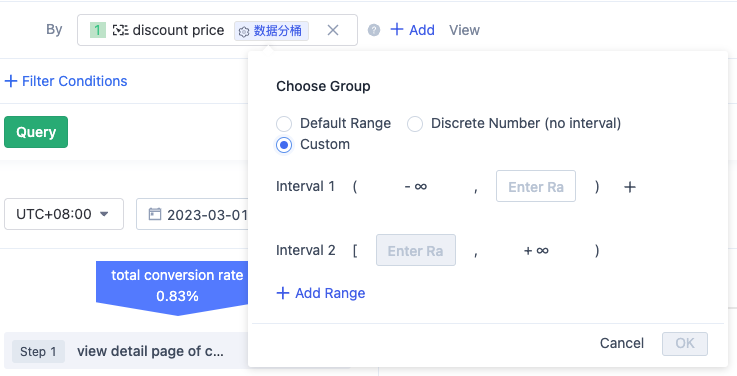
If the selected attribute is a numerical type, custom grouping intervals can be defined. If not set, the query engine will dynamically calculate grouping intervals. This setting only takes effect in the current query and also in bookmarks created from the query.
3.2.2. Select the time range for the query and display the funnel chart.
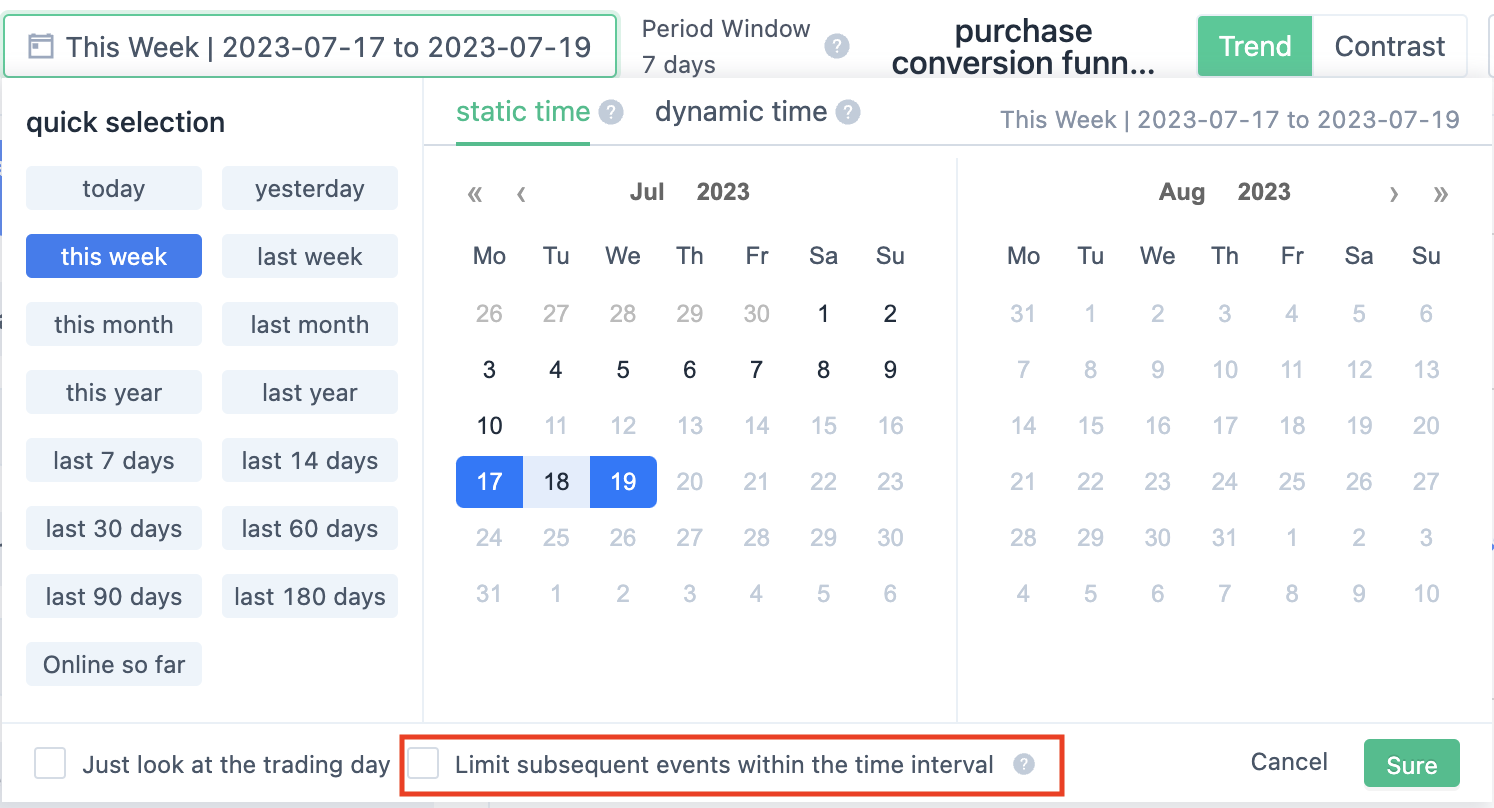
The set time range defaults to the time range of the first event in the funnel. By selecting "Limit the window period to the selected time range", the occurrence time of each step in the funnel is limited to the selected time range while also meeting the window period criteria.
Take limited-time offers in e-commerce as an example. The limited-time offer is set from September 1st to 7th. Users can enjoy a special price discount for completing transactions during the time period, and the product will be restored to its original price after the time period. To accurately understand the user's transactions during the limited-time offer period requires the option to be set. For example, if the window period in the funnel is set to 4 days, and a user browses on September 6th, completes a transaction on September 8, the funnel without this option will also count this transaction as a conversion of the funnel. With this option set, this transaction will not be counted.
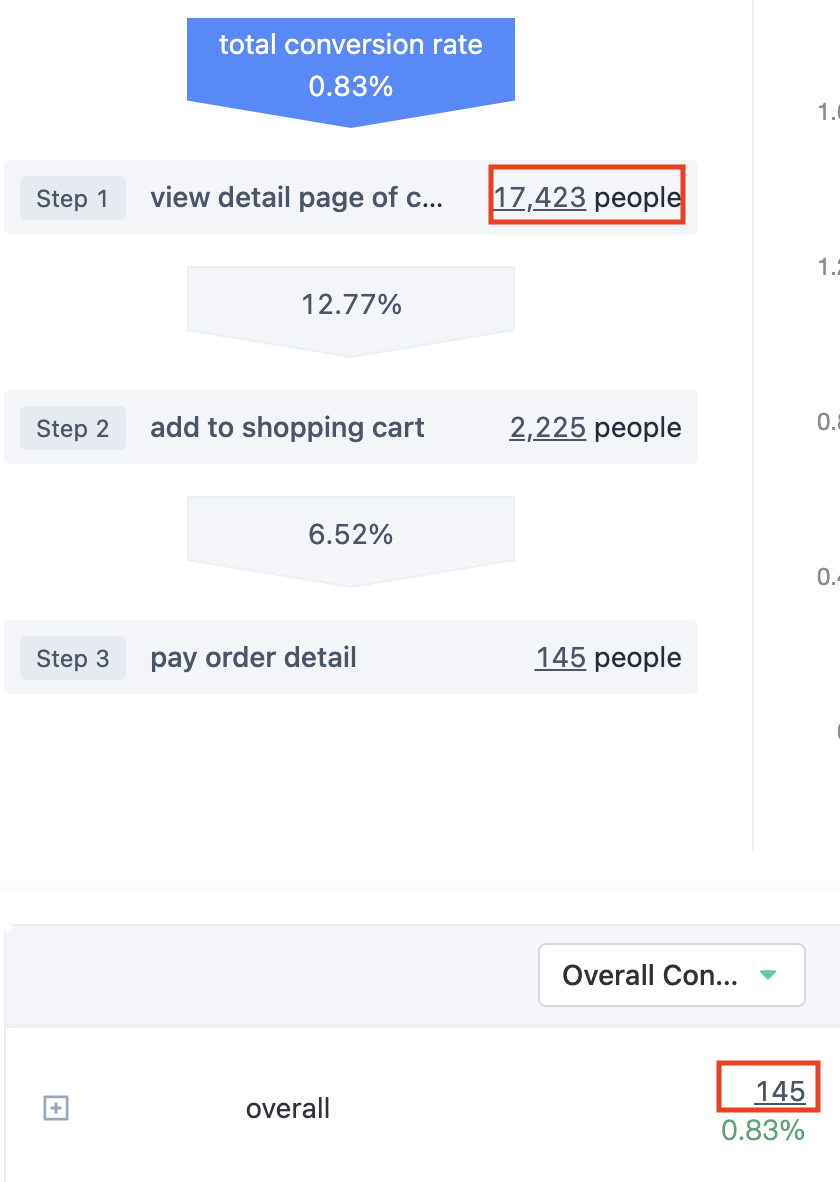
3.2.3. View the overall funnel or conversion details of each step.
When selecting "Trend", click on a specific step to see a detailed view of the lost users, converted users, median conversion time, and conversion rate between two steps. When clicking on the "Total conversion rate" node, you can see the overall and single-step conversion rate trend. When clicking on a single step, you can see the number of triggering users, lost users, conversion rate, and median conversion time of the two events in a table.
When selecting "Compare", you can set two indicators to compare in "Display settings", and intuitively compare the conversion of the two groups in the funnel chart below. The table displays all groups, showing the conversion rate of each step event in the funnel and the total conversion rate.
3.2.4. Display funnel chart
When selecting "Overall", each step of the funnel chart can be clicked and you can view the detailed event user count, conversion rate, lost users, and median conversion time for that step in the table below. Click the arrow in the cell before the group value to expand the current group value and view the event user count, conversion rate, lost users, and median conversion time for that step by date.
When selecting "Compare", the funnel chart is not clickable. If there are groups, you can set two groups to compare. The table shows the user count and conversion rate of each event in the funnel based on the current comparison group. Click the arrow in the cell before the group value to expand the current group value to view the user count and conversion rate of each event in the funnel by date.
3.2.5. Browse user details
The funnel chart and user-related indicators displayed in each cell can be clicked. Clicking will browse the user list and further browse the user behavior sequence of a specific user.
3.2.6. Display settings
When selecting "Trend", click on "Display Settings" to set the display indicators for the current line chart. Click on the "Total Conversion Rate" node on the left to set the total conversion rate and the conversion rate for each step of the funnel. Click on a single step node on the left to set the conversion rate for the current step, the number of lost users in two events, and the median conversion time.
When selecting "Comparison", click on "Display Settings" to set the display grouping for comparing the funnel conversion of two groups.
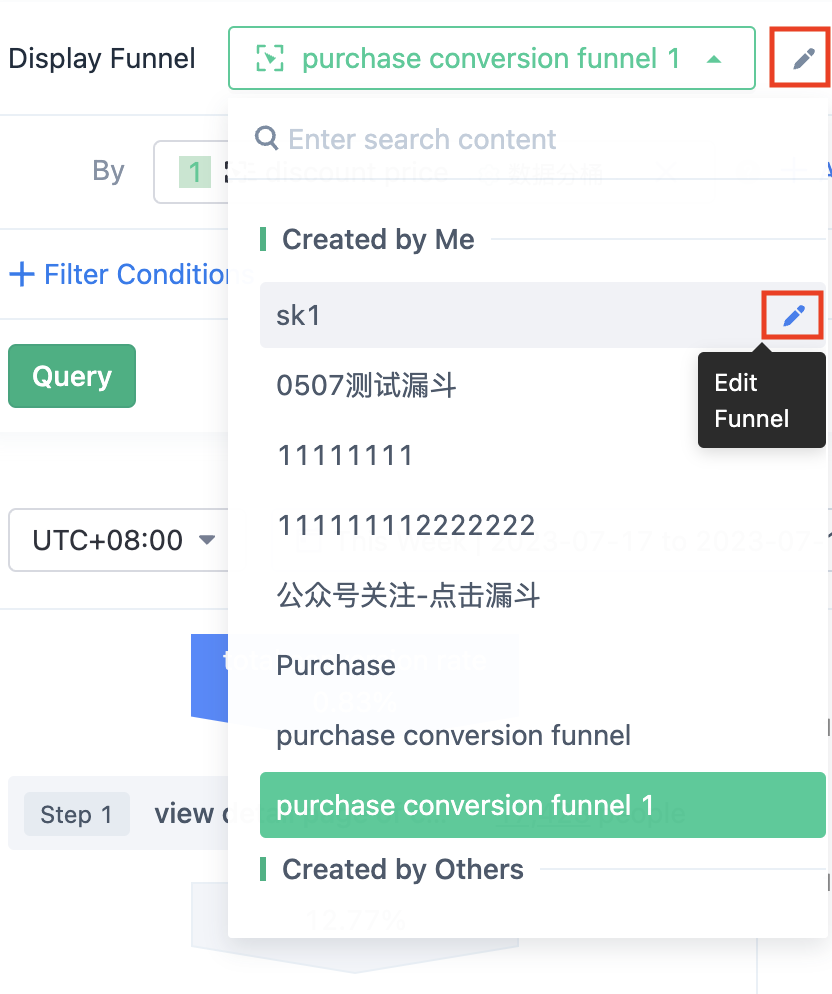
3.3. Modify and delete funnel
Click on the pencil icon in the funnel list to edit the funnel in the "Edit Funnel" panel that slides out.
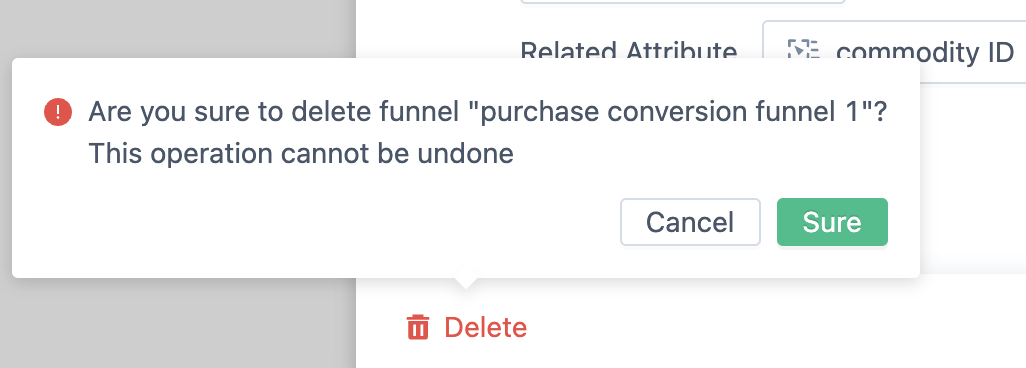
Click on the "Delete" button in the lower left corner to delete the current funnel.
3.4. Save as new funnel
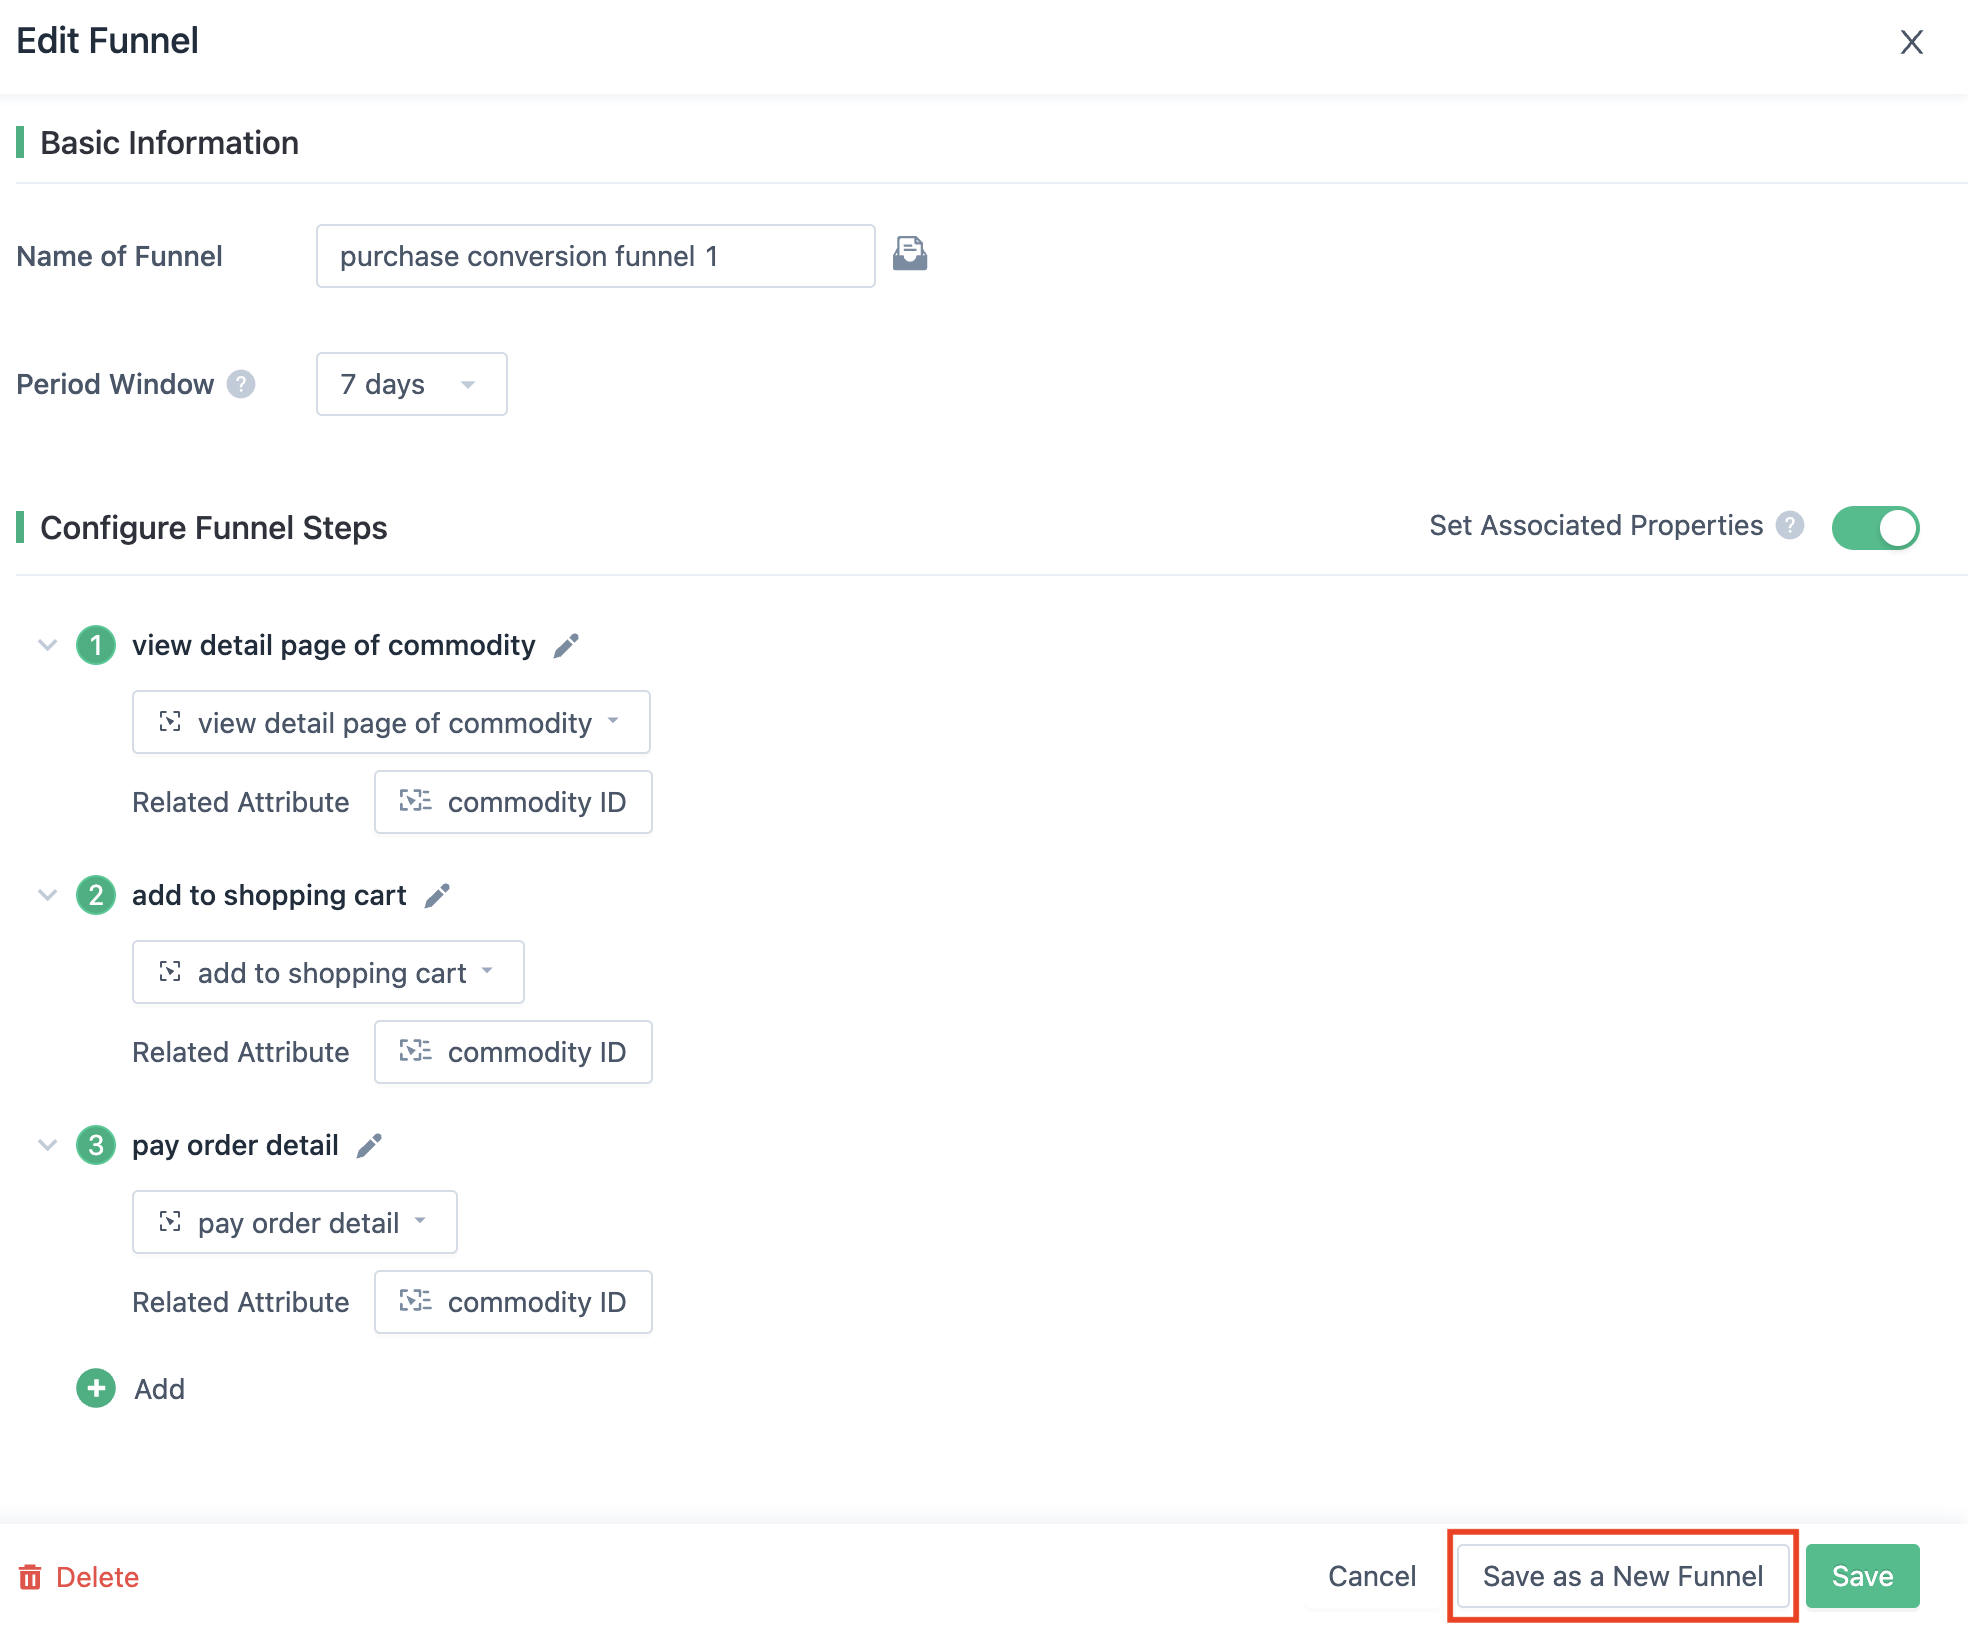
Go to the "Edit Funnel" page, modify the funnel name, and then click the "Save as a New Funnel" button in the lower right corner to save it as a new funnel.
4. How is the funnel calculated?
In this document, we will describe in detail the calculation rules of funnels analysis, especially the calculation rules with filters and grouping, to help users better interpret the results of funnels analysis. At the same time, we will also provide examples of funnels analysis for some common analysis scenarios to help users better use this feature.
4.1. Basic calculation rules based on user count
The number displayed in the funnel represents the number of independent users who have converted/lost, not the number of triggered events. Within the selected time range, even if a user completes the funnel multiple times, it is only counted once.
Suppose a funnel contains five steps: A, B, C, D, and E. The selected time range is from January 1st, 2015, to January 3rd, 2015, with a window period of one day. If a user triggers step A between January 1, 2015, and January 3, 2015, and sequentially triggers B, C, D, and E within one day after step A occurs, it is counted as one successful funnel conversion for that user.
In this process, if there are some other steps or behaviors inserted, such as in compliance with the time limit, the user's behavior sequence is A > X > B > X > C > D > X > E, where X represents any event, then the user is still considered as having completed a successful funnel conversion.
If the user triggers A > B > C > E in the time limit range, he/she has not completed the funnel conversion, and will be counted as a lost user in step C.
Considering a more complex situation, if a user has multiple events that meet the definition of a conversion step within the selected time period, the earlier event that is closer to the final conversion goal will be prioritized as the conversion event, and the conversion calculation will stop when the final conversion goal is reached for the first time. For example, if a funnel's step definition is "visited homepage、select payment method、successful payment, the actual conversion steps (highlighted in red) are shown in the example below:
- Example 1: visited homepage ->select payment method (Alipay), -> select payment method (WeChat), -> successful payment.
- Example 2: visited homepage -> select payment method (Alipay),-> visited homepage-> select payment method (WeChat), -> successful payment.
- Example 3:visited homepage -> select payment method (Alipay), -> visited homepage -> select payment method (WeChat),->successful payment ->select payment method (WeChat),-> successful payment.
4.2. Basic calculation rules based on counting occurrences
What the numbers displayed in the funnel represent?the number represent the number of times of conversions. Once a user triggers the starting event of the funnel during the selected time period, a conversion count will begin.
Assume that a funnel contains A, B, and C three steps; under the circumstances that the time range and window period are satisfied, a user's behavior sequence is A > B > A > B >C, and finally, the user's statistical results are A 2 times, B 2 times, C 1 time.
Aggregating the A B C occurrences of different users yields the final data results for the occurrence-based funnel.
Consider a slightly more complicated situation:
In a single ordered funnel event (from the start event to the end event), each step's behavioral event can occur at most once, and any extra events will be discarded and not counted as valid trigger event counts.
For example, if a user's behavior sequence is A B A B B C, the final result will show 2 occurrences for A, 2 occurrences for B, and 1 occurrence for C (the red parts of the behavior sequence are the actual selected conversion events).
4.3. Meaning of filter conditions
Like other analytical functions, Funnels Analysis also provides filtering functions. It needs to be emphasized that the filtering of Funnels Analysis is done on the completed conversion/confirmed churn users, and then a second selection is made.
The filtering of Funnels Analysis includes three different filtering types:
- User property filtering: This filtering type is relatively easy to understand. Based on the completed conversion/confirmed churn users, further filtering is done according to the user's properties. For example, if we add a filtering condition of "Gender" is "Male", only users with the user property "Gender" as "Male" will meet this filtering condition and appear in the resulting Funnels Analysis after filtering.
- Specified step attribute filtering:
- Calculated by number of people: Suppose we select a filtering condition where the attribute "Payment Method" of step 2 is "Alipay". This filtering means that among the completed conversion/confirmed churn users, those users that have the value "Alipay" for the "Payment Method" of step 2 when they convert are selected; if there are multiple possible conversions, please refer to the description in the Basic Calculation Rules.
- Calculated by number of times: For each conversion, filter based on the attribute value of the corresponding actual event of the step.
4.4. Meaning of grouping
Like other analytical functions, Funnels Analysis also provides grouping functions. It needs to be emphasized that the grouping of Funnels Analysis is based on the completed conversion/confirmed churn users group on the collection.
Funnels Analysis has three different types of grouping:
- User attribute grouping: This grouping is based on the user's attributes in the completed conversion/confirmation loss set. For example, if "gender" is added as a grouping condition, the funnels analysis results will be grouped separately for "male" and "female".
- Step attribute grouping:
- Based on the number of people: If the grouping attribute is the "payment method" of step 2 and there are multiple possible conversions, funnels analysis will group the completed conversions/confirmation loss users based on the "payment method" value at step 2. If a user did not convert at step 2, they will be grouped into the "unknown" group.
- Based on the number of times: For each conversion, funnels analysis will group users based on the attribute value of the corresponding step's actual event. If the user did not convert at that step, they will be grouped into the "unknown" group.
5. FAQ
5.1. Difference between internal and external filtering conditions:
Example: The filtering conditions set inside the funnel are to get the funnels according to the set conditions, and the filtering conditions set outside the funnel are to filter out the funnels satisfying the filtering conditions according to the funnels obtained. The general business use scenario is to set the filter conditions inside the funnel, and it is recommended to set the conditions inside the funnel directly to get the funnel that meets the conditions. For example, if the funnel steps are A->B->C->D and a user's behavior sequence is F->A2->A1->A1->B->C->A1->B, and events A contain an operating system attribute, where A1 has an Android operating system and A2 has an iOS operating system. If an iOS operating system is added as a filtering condition within the funnel, the system will filter the sequence A2->B->C based on the principle of finding the iOS property of the A event by searching along the user's behavior sequence until it is found. If filtering conditions for iOS operating system are added outside the funnel, as funnel outside filtering is a secondary filter after the user's successful funnel conversion, and when there are no filtering conditions added, the user's normal funnel conversion will be A1->B->C, and A1 is the second A1. Thus, if filtering conditions are added outside of the funnel, the user may not be filtered out.
5.2. Funnel force refresh will cause the number of users changes
Answer: (1) If the data changes only on the first refresh and the number of users no longer changes after multiple refreshes, it is due to the caching mechanism used in the Sensorsdata's query, and the refreshed data will be used as the standard.
(2) If the number of users changes on multiple refreshes, it is usually due to unstable sorting caused by the same time between neighboring events in the funnel. You can ask the person in charge of the corresponding event’s tracking to adjust the event reporting timing to ensure that the times of the two events are different. If it is caused by other reasons, please contact the Sensorsdata's on-duty team.
5.3. When calculated by people, the number of users in an event inside the funnel may not be consistent with the number of triggered users in event analysis.
Answer: (1) The number of people corresponding to the first step in the funnel is inconsistent with the number of triggering users in the event analysis query: It may be that when querying the funnel, filtering conditions are added outside the funnel, resulting in a different number of people under corresponding filtering conditions in the event analysis. The filtering conditions can be added inside the funnel, and then the data can be compared. If after the filtering conditions are added inside the funnel, the results of the query are consistent with the event analysis, it indicates that the query results are normal. For more details, please refer to the difference in filtering conditions inside and outside the funnel in question 1.
(2) The number of non-first-step events in the funnel is inconsistent with the triggering user number in the event analysis: This is normal data, because the number of people for a certain event in the funnel is the number of people filtered out after satisfying the funnel rules. For example, if the funnel rule is A->B->C, and the number of users for event B in the event analysis is 100, the number of users triggering event A before event B in the funnels analysis is 20.
5.4. When calculated by times, the number of times in an event inside the funnel may not be consistent with the number in event analysis.
Answer: (1) The number of corresponding times of the first step in the funnel and the number of triggering times in the event analysis query are inconsistent: same as 5.3 (1).
(2) The number of non-first-step events in the funnel is inconsistent with the triggering user number in the event analysis: This is normal data.
- The number of certain events in the funnel is the number of events filtered out after satisfying the funnel rules. For example, if the funnel rule is A->B->C, and the number of times the event B occurs is 100 in the event analysis, the number of times a user triggers event B after triggering event A in the funnels analysis is 20.
- In an ordered funnel behavior of a user (from the starting event to the ending event), each step of the behavior event can occur at most once. Redundant events will be discarded and will not be counted as effective trigger event times. For example, if the user behavior sequence is A B A B B C , the final statistical result is A 2 times, B 2 times, and C 1 time (the red part in the behavior sequence is the selected conversion event).
5.5. The conversion rate of the funnel per day is not as high as the overall conversion rate.
Answer: For example, if there are three people within three days from 1st November to 3rd November, and the funnel rule is A->B->C, on 1st November, three people trigger event A, but only the first person completes the B->C conversion within the window period; On 2rd November, three people trigger event A, but only the second person completes the B->C conversion within the window period; On 3rd November, three people trigger event A, but only the third person completes the B->C conversion within the window period. In terms of daily distribution, the conversion rate of 1st November is 33%, the conversion rate of 2nd November is 33%, and the conversion rate of 3rd November is 33%. In general, the conversion rate of 1st November-10th November in the 10-day period is 100%.
5.6. The overall conversion rate is not as high as the conversion rate of the funnel per day.
Answer: For example, from 1st November to 2nd November, the funnel rule is A->B->C, and on the first day, a, b, and c trigger event A, but only b and c complete the B->C conversion within the specified window period, with a conversion rate of 66.6%.
On the second day, b, c, d, and e trigger event A, but only b and c complete the B->C conversion within the specified window period, with a conversion rate of 50%.
In general, there are five people visiting (abcde), and two of them place orders (bc), with a conversion rate of 40%.
Note: The content of this document is a technical document that provides details on how to use the Sensors product and does not include sales terms; the specific content of enterprise procurement products and technical services shall be subject to the commercial procurement contract.
 Popular Searches