LTV Analysis
|
Collect
1. LTV Analysis Overview
Life Time Value (LTV) is the commercial value that a user contributes throughout their life time. LTV analysis is an analytic model for analyzing the commercial value of users, which can analyze the average value per person contributed by a specific group of users who visited on a certain date within a certain period of time.

Specific questions that LTV analysis helps answer include:
Which channel brings users with higher average value? Is the value contributed by users higher than the cost of user acquisition?
Did operational activities bring significant benefits? Has the average value per user increased? Are operational activities good or bad?
Can game products bring enough per capita consumption to cover development costs? After how long will player value stabilize?
- Which user group is the high-value user group for our product? What are the characteristics of these customers?
Typical Case: For new users who registered on September 10th, what is the per capita recharge amount (LTV 30) in 30 days?
The calculation process:
- Lock in the user group of new users by the initial time (September 10th) and event (registration);
- Calculate the cumulative recharge amount of the user group from the initial time (September 10th) to the LTV duration (30 days);
- Divide the cumulative recharge amount by the initial number of people (registered users on September 10th) to obtain LTV 30.
2. Brief introduction to the functions of the LTV analysis interface
2.1. Select the initial event or initial time
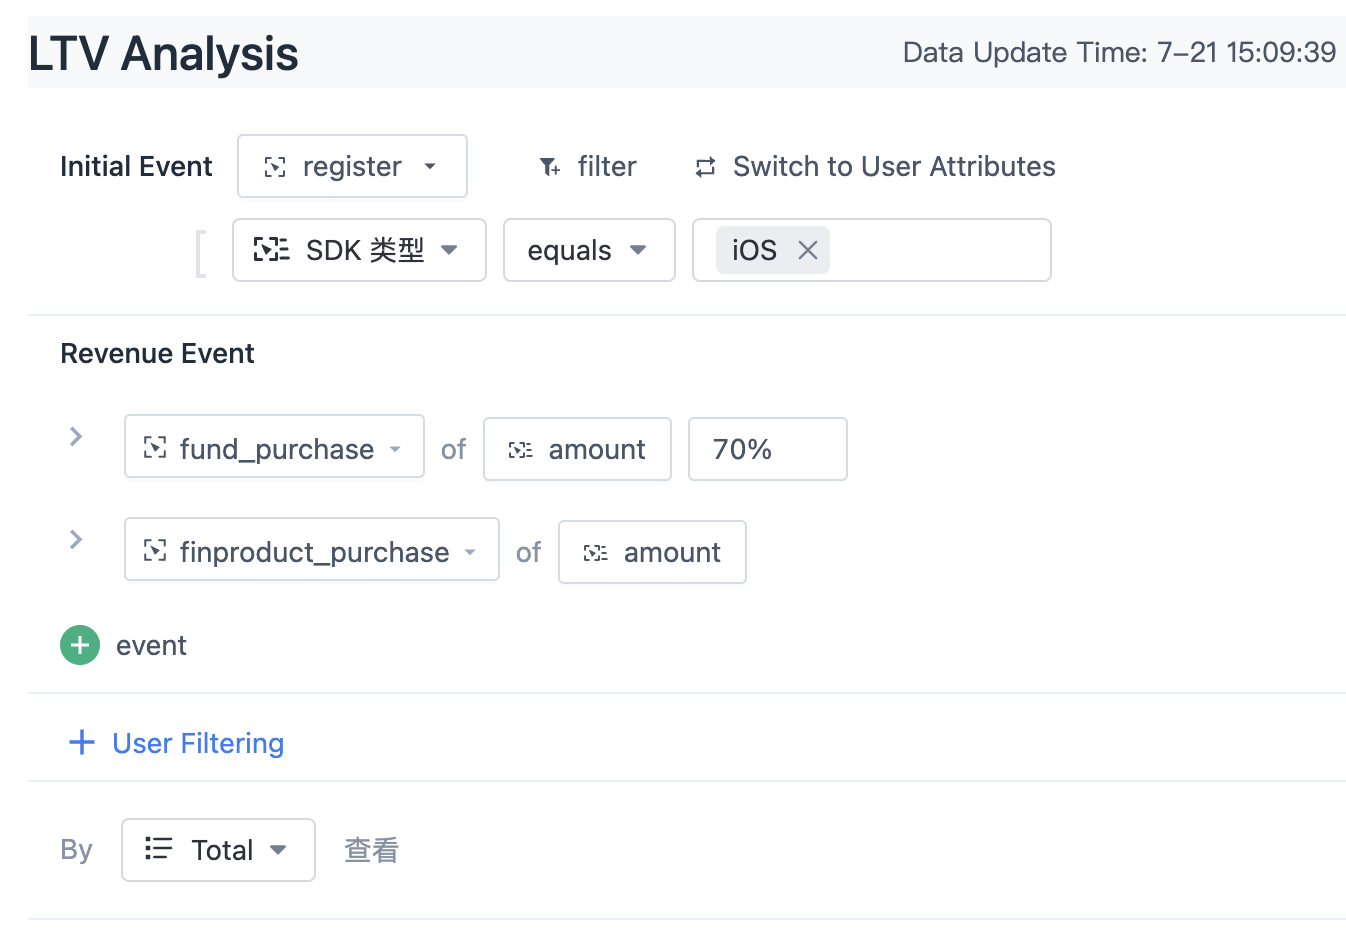
In LTV analysis, support the anchoring of the initial user group by event occurrence time or user attributes. Click the "Switch" button to switch between events and user attributes.
When selecting the initial user group anchored by the event, you can add filtering conditions to view finer dimensions. For example, if we want to analyze the situation of users in Beijing after registration, we can define the initial event as "registration" and add a filter condition "city equals Beijing".
2.2. Select revenue events
By adding revenue events in the revenue event section, you can analyze the LTV corresponding to the revenue events. In LTV analysis, multiple revenue events can be added, and their proportions in total revenue can be analyzed. For example, a game has two types of revenue events-"member recharge" and "purchase of virtual props". You can add these two revenue events under the revenue event section and select their corresponding revenue amount attributes. The result table will show the proportion of both in the total revenue.
2.2.1. Filter revenue events
Sometimes it is necessary to analyze the revenue contribution of some revenue events, such as the revenue contribution of a newly developed virtual skin in the purchase of virtual props. In LTV analysis, you can filter out the corresponding revenue events by adding filtering conditions. For example, adding the filter condition "virtual props equal to xx skin" can view the per capita value contributed by the sale of this skin.
2.2.2. Set the profit ratio of revenue events
In some cases, channel partners may take a cut from electronic payments, such as when making game top-ups in iOS, which may be subject to a 30% profit deduction by Apple. In this case, the amount of money charged to the customer is not the average value per user that they have contributed to the enterprise. To accurately calculate LTV when channel partners take a cut, LTV analysis supports setting the profit ratio of revenue events. In this case, iOS game top-up profit ratio is set to 70%, which can more accurately calculate the LTV of iOS users' game top-ups.
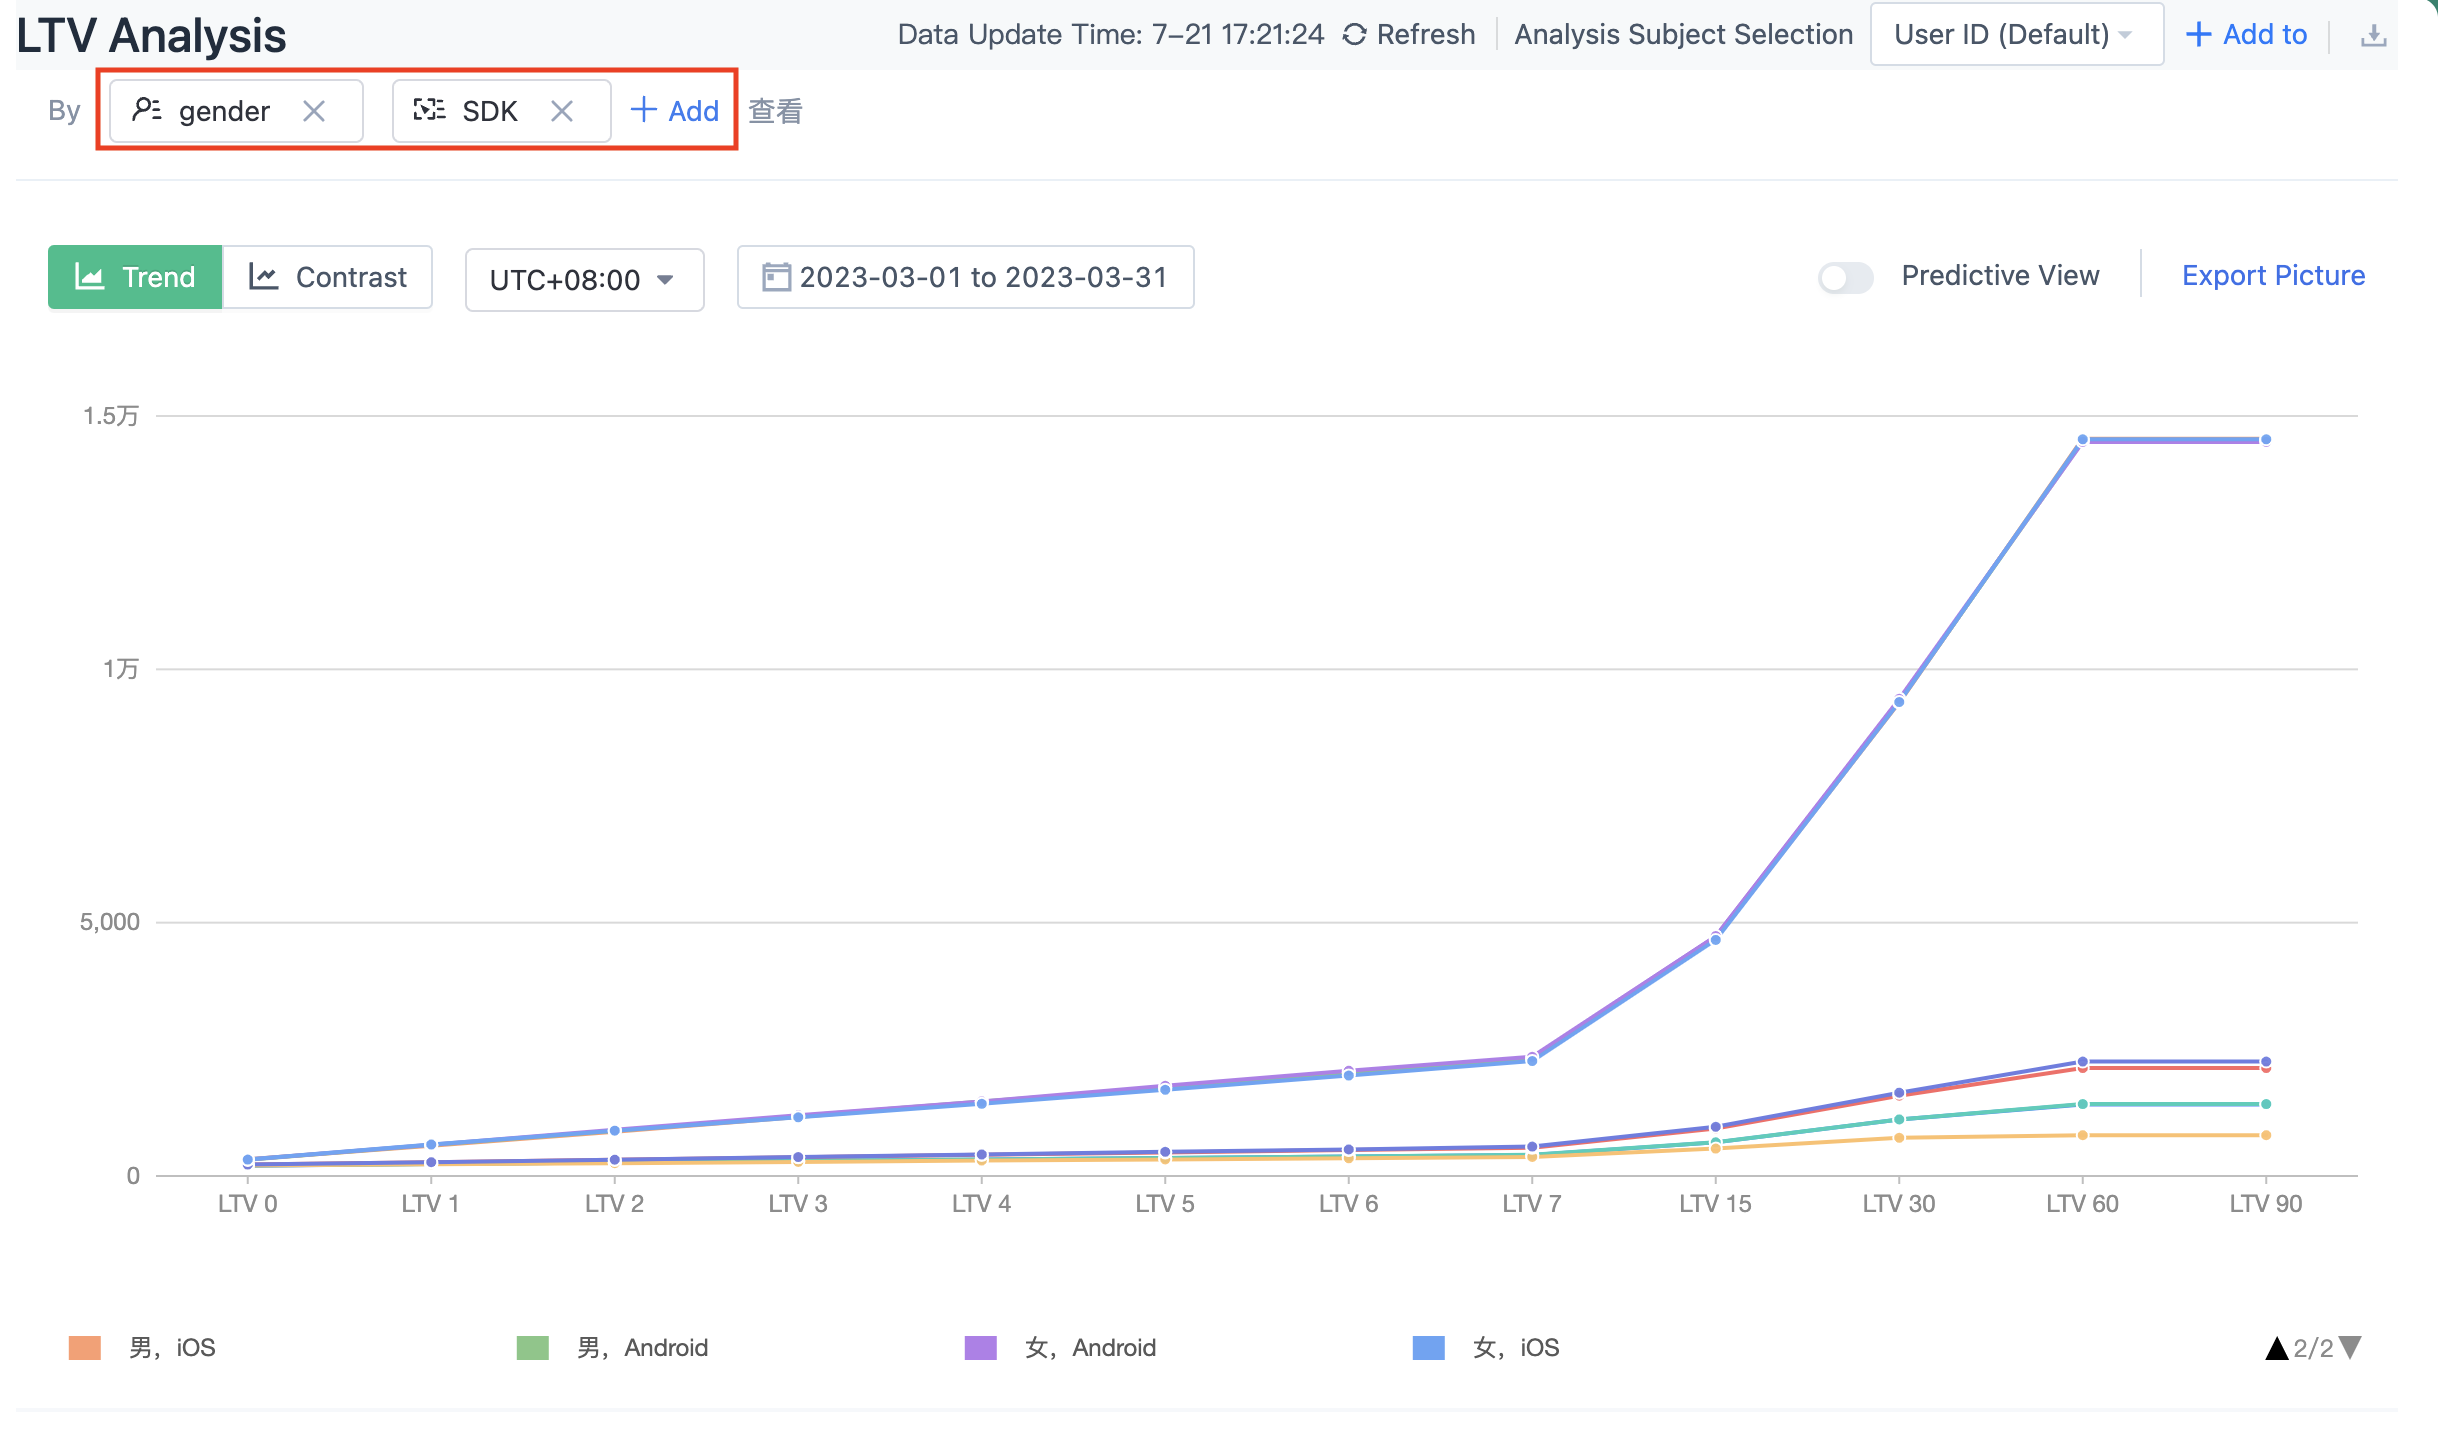
2.3. Group analysis by attribute
LTV supports grouping analysis by initial event attributes, user attributes, user segments, or tags, and supports adding multiple groups at the same time. For example, if you choose user attributes to group by registration channels, you can see the LTV situation of different registration channels.
If a numeric or time type attribute is selected here, you can customize grouping intervals. If not set, the query engine will dynamically calculate grouping intervals. This setting only takes effect for the current query and will also be effective in bookmarks saved by the query.
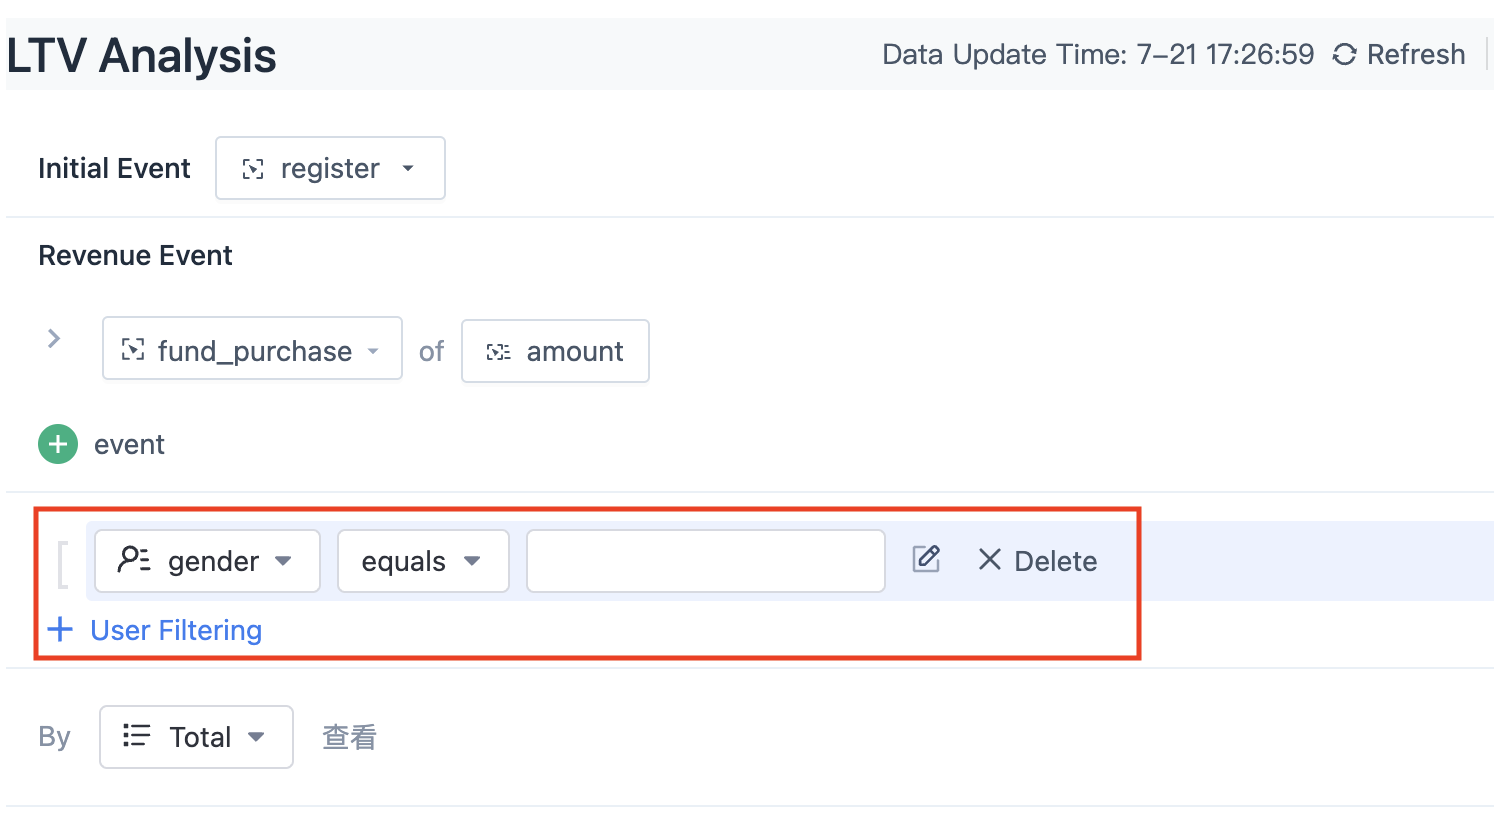
2.4. Set user filter conditions
You can add global user filter conditions to analyze the LTV of specific user groups. For example, add "Gender equals Female" to analyze the LTV of female users.
2.5. Trend view
In LTV analysis, two views are supported to view the results of LTV analysis, trend view and comparison view. In the trend view, you can view the growth trend of LTV with retention time; in the comparison view, you cancompare the changes of LTV with the initial date.
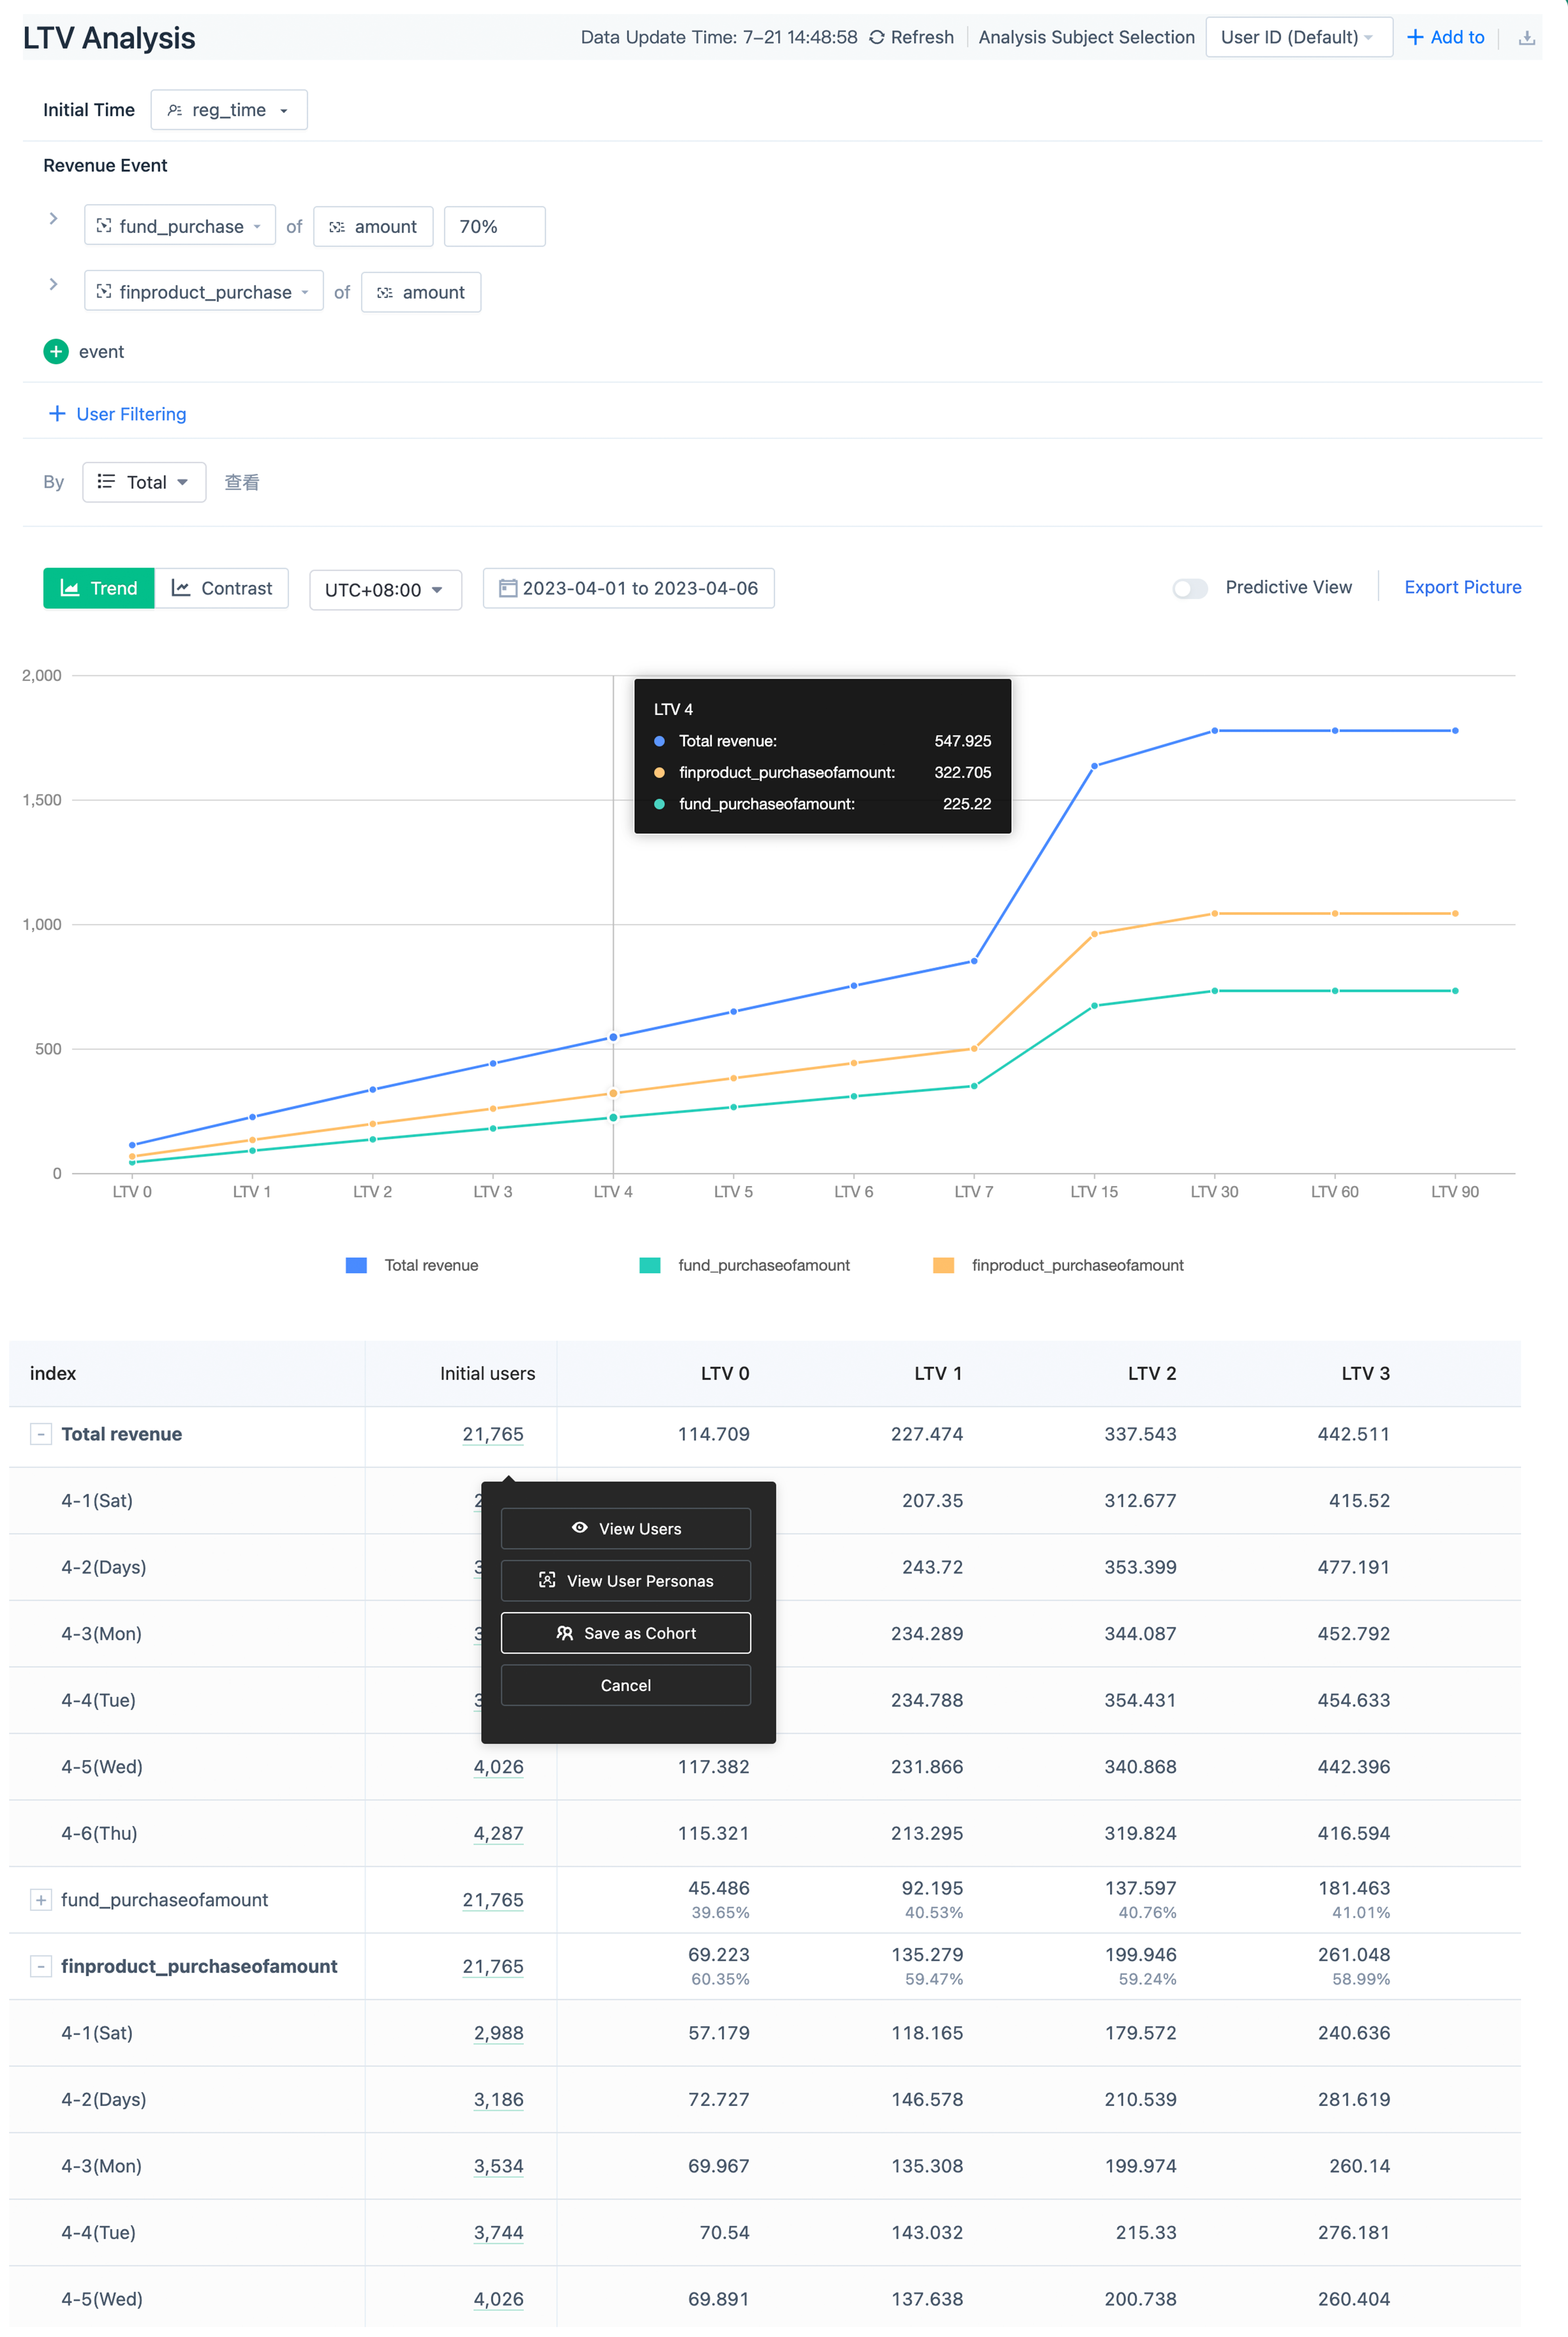
2.5.1. Trend chart
In the trend chart, you can view the growth trend of LTV with retention time.
The display of the trend chart can be divided into two situations: In the overall view, you can view the LTV growth trend of each revenue indicator and total revenue with the retention time; When you view groups by attribute, you can view the growth trend of total revenue for each group in the chart.
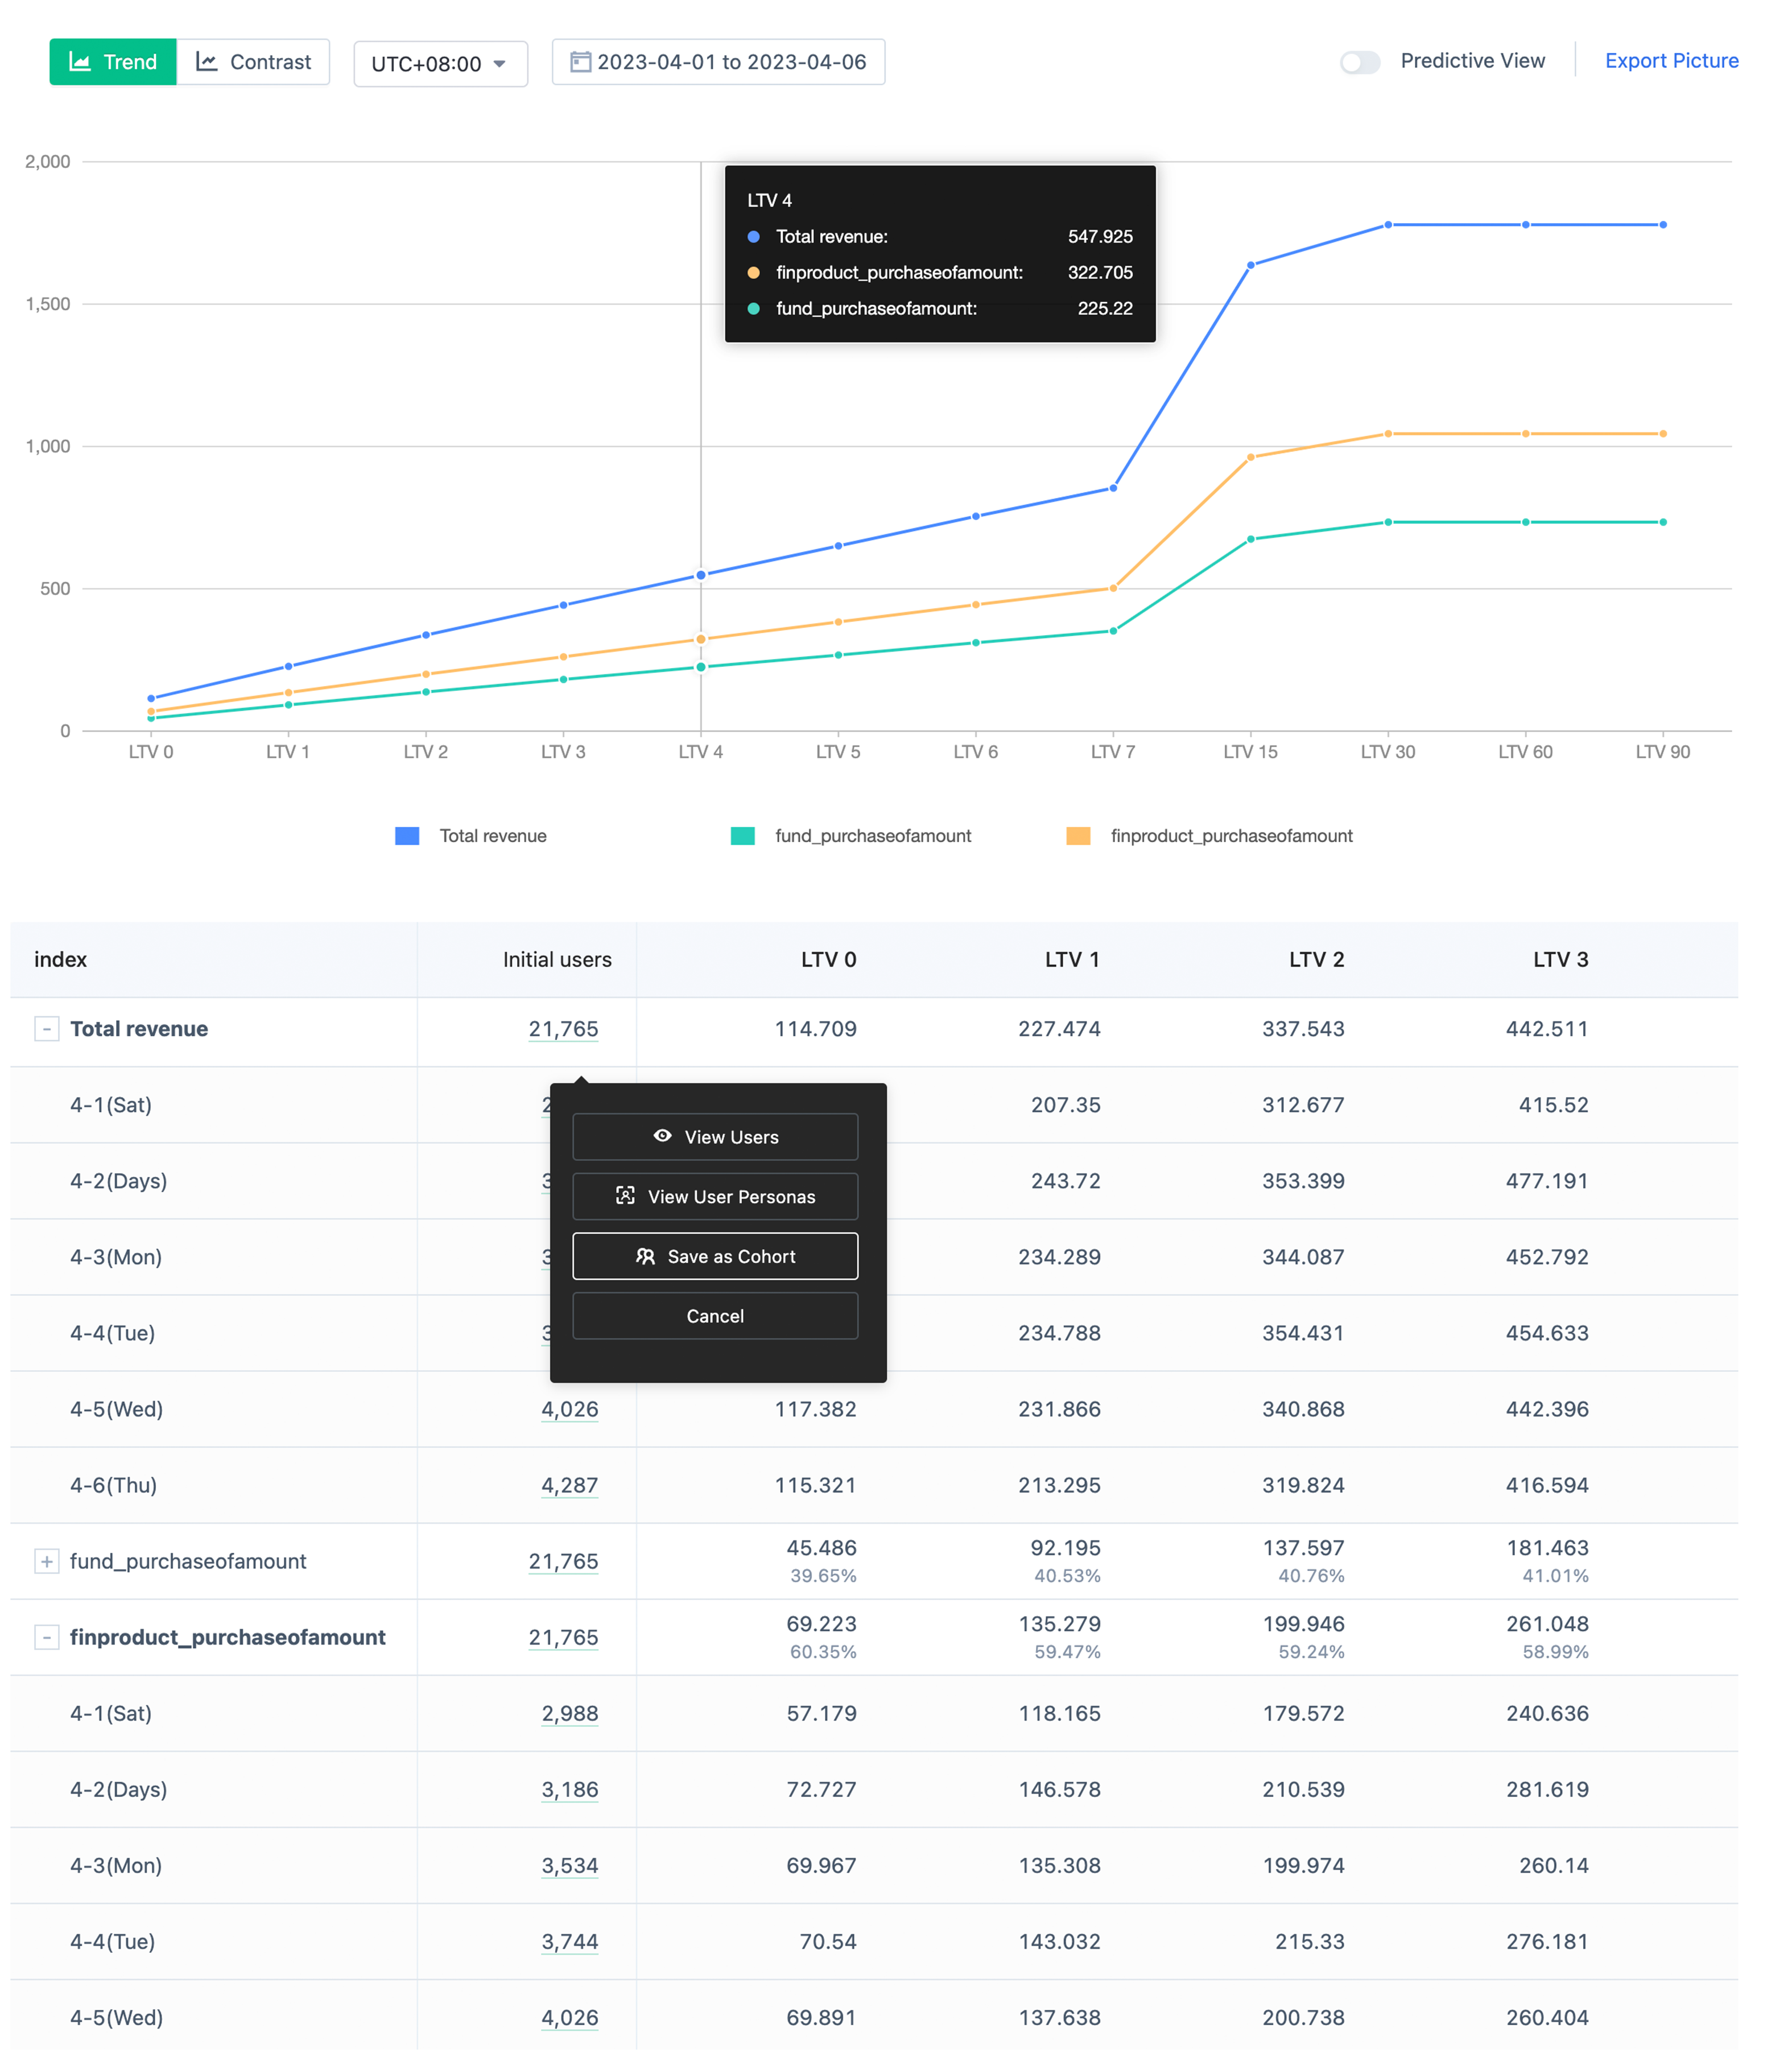
2.5.2. Trend table
In the trend table, you can view the specific LTV indicator values. At the same time, when multiple indicators are present, the total revenue and the percentage of each indicator in the total revenue can be displayed.
In the table,
- the group column is sorted by initial number of users from high to low by default. You can re-sort groups by group name, initial number of users, and total revenue LTV. You can also filter groups by group name.
- In the indicator column, click the "Expand" button to expand the initial date row to view the LTV details for each initial date.
- The initial number of users column shows the number of initial users summed over a period of time and the number of initial users visited on each initial date. When you click on the user count, you can view the user list and create user segments.
- The LTV 0-7, LTV 15, LTV 30, LTV 60, LTV 90 and other columns show specific LTV indicator values, including the LTV corresponding to each initial date and the LTV summarized over the time period. For multiple metrics, the summary row will display the percentage of each indicator in the total revenue.
2.5.2.1. Browsing user details
The numbers in the Initial number of users column are clickable. Click to browse the detailed information of these users, and further browse the detailed behavior sequence of single users.
2.5.3. Customize LTV time period
- Supports displaying continuous LTV data for LTV 7 to LTV 15 and LTV 16 to LTV 30.
- Support custom LTV cycle, up to LTV 365
- Custom LTV data can be saved to dashboard
2.5.4. 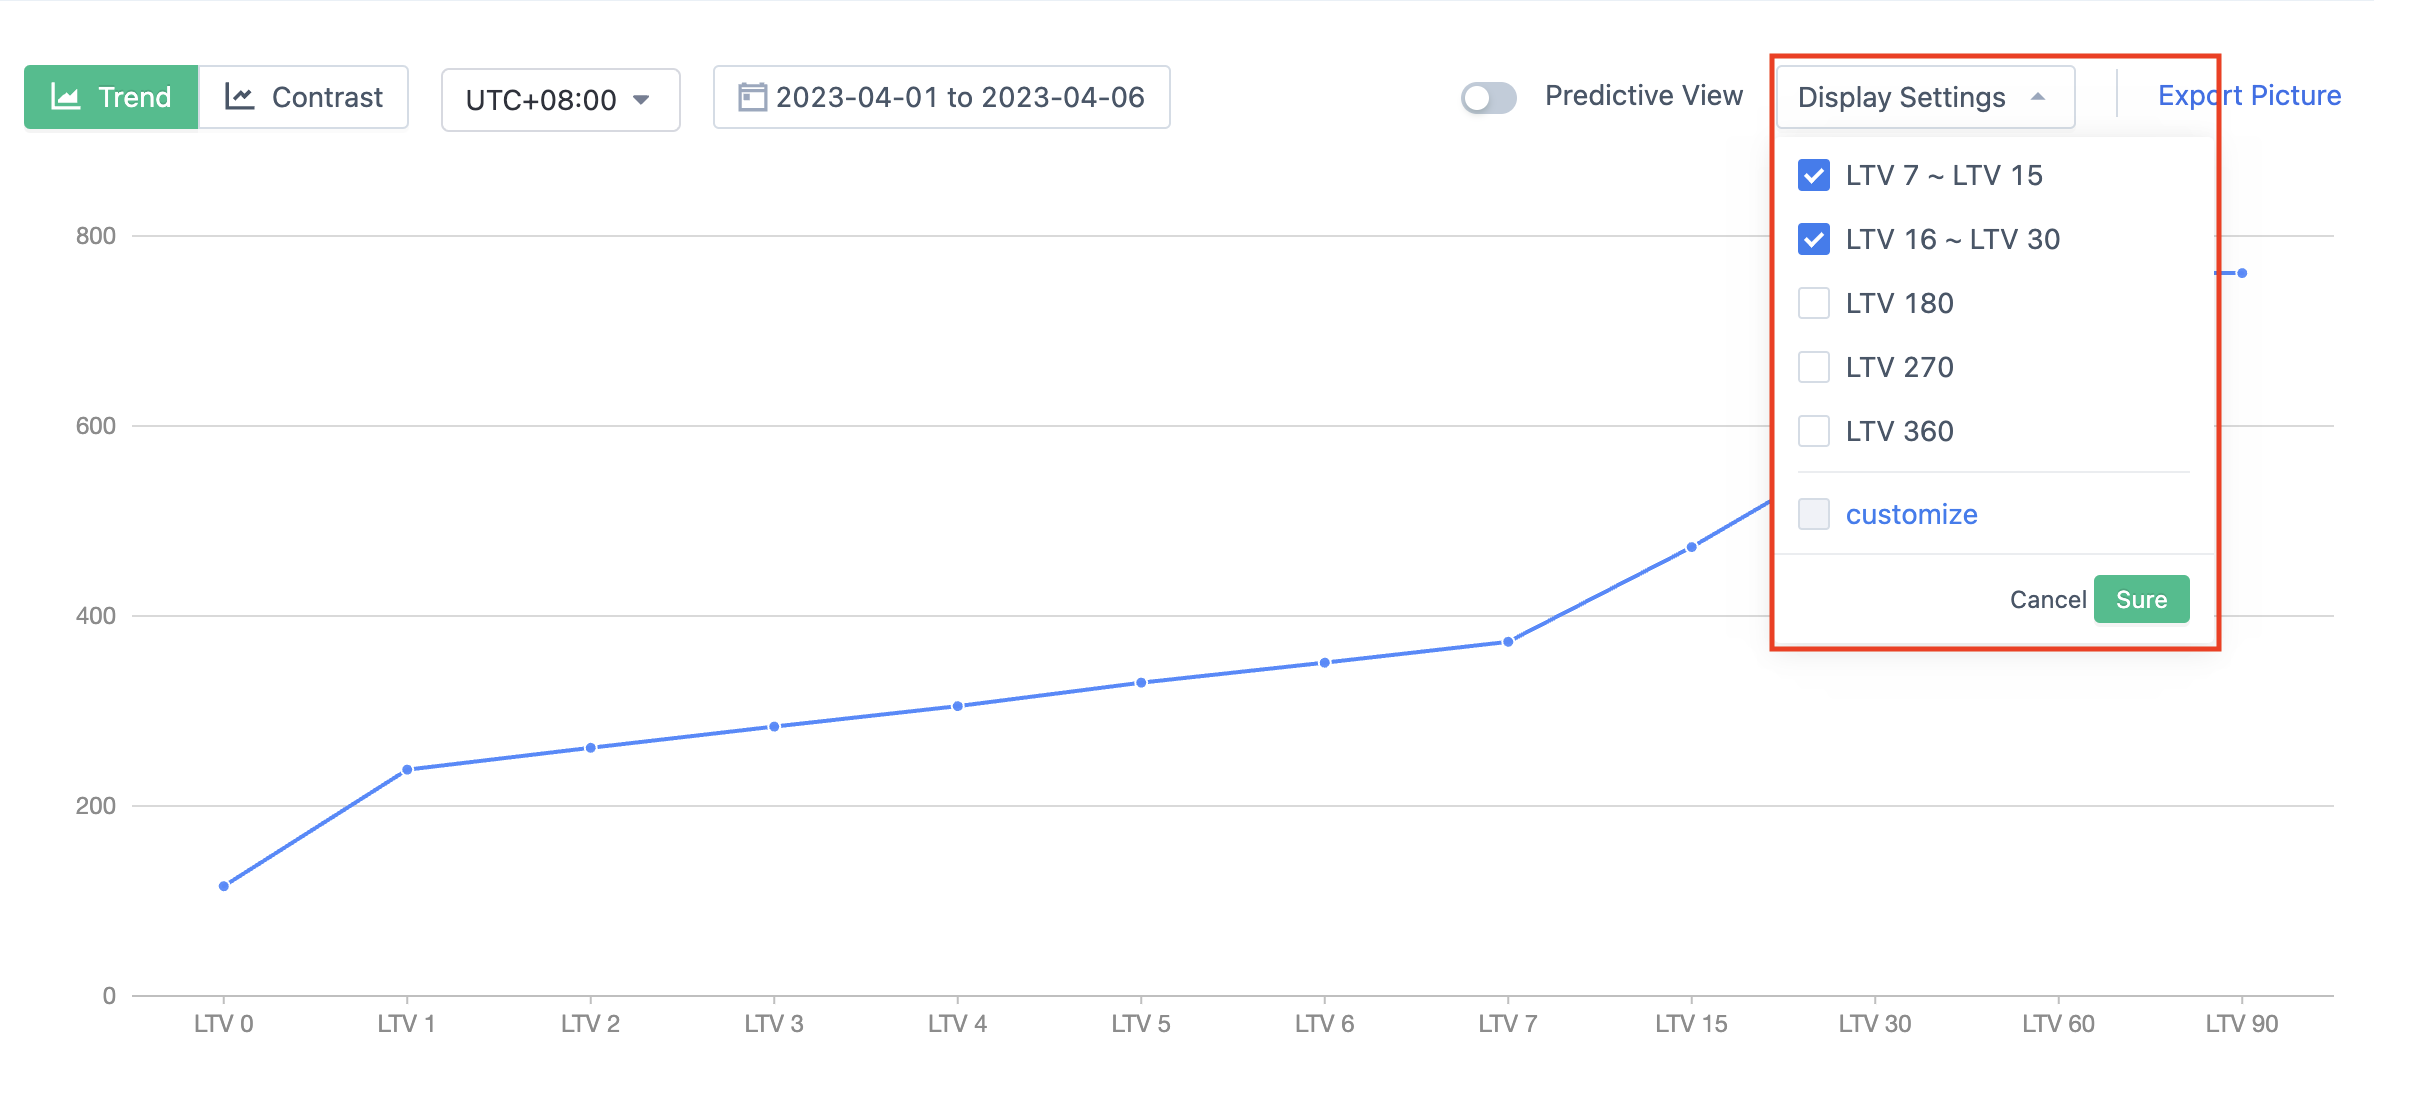
2.5.5. LTV forecast
Support switching to forecast view in trend chart.
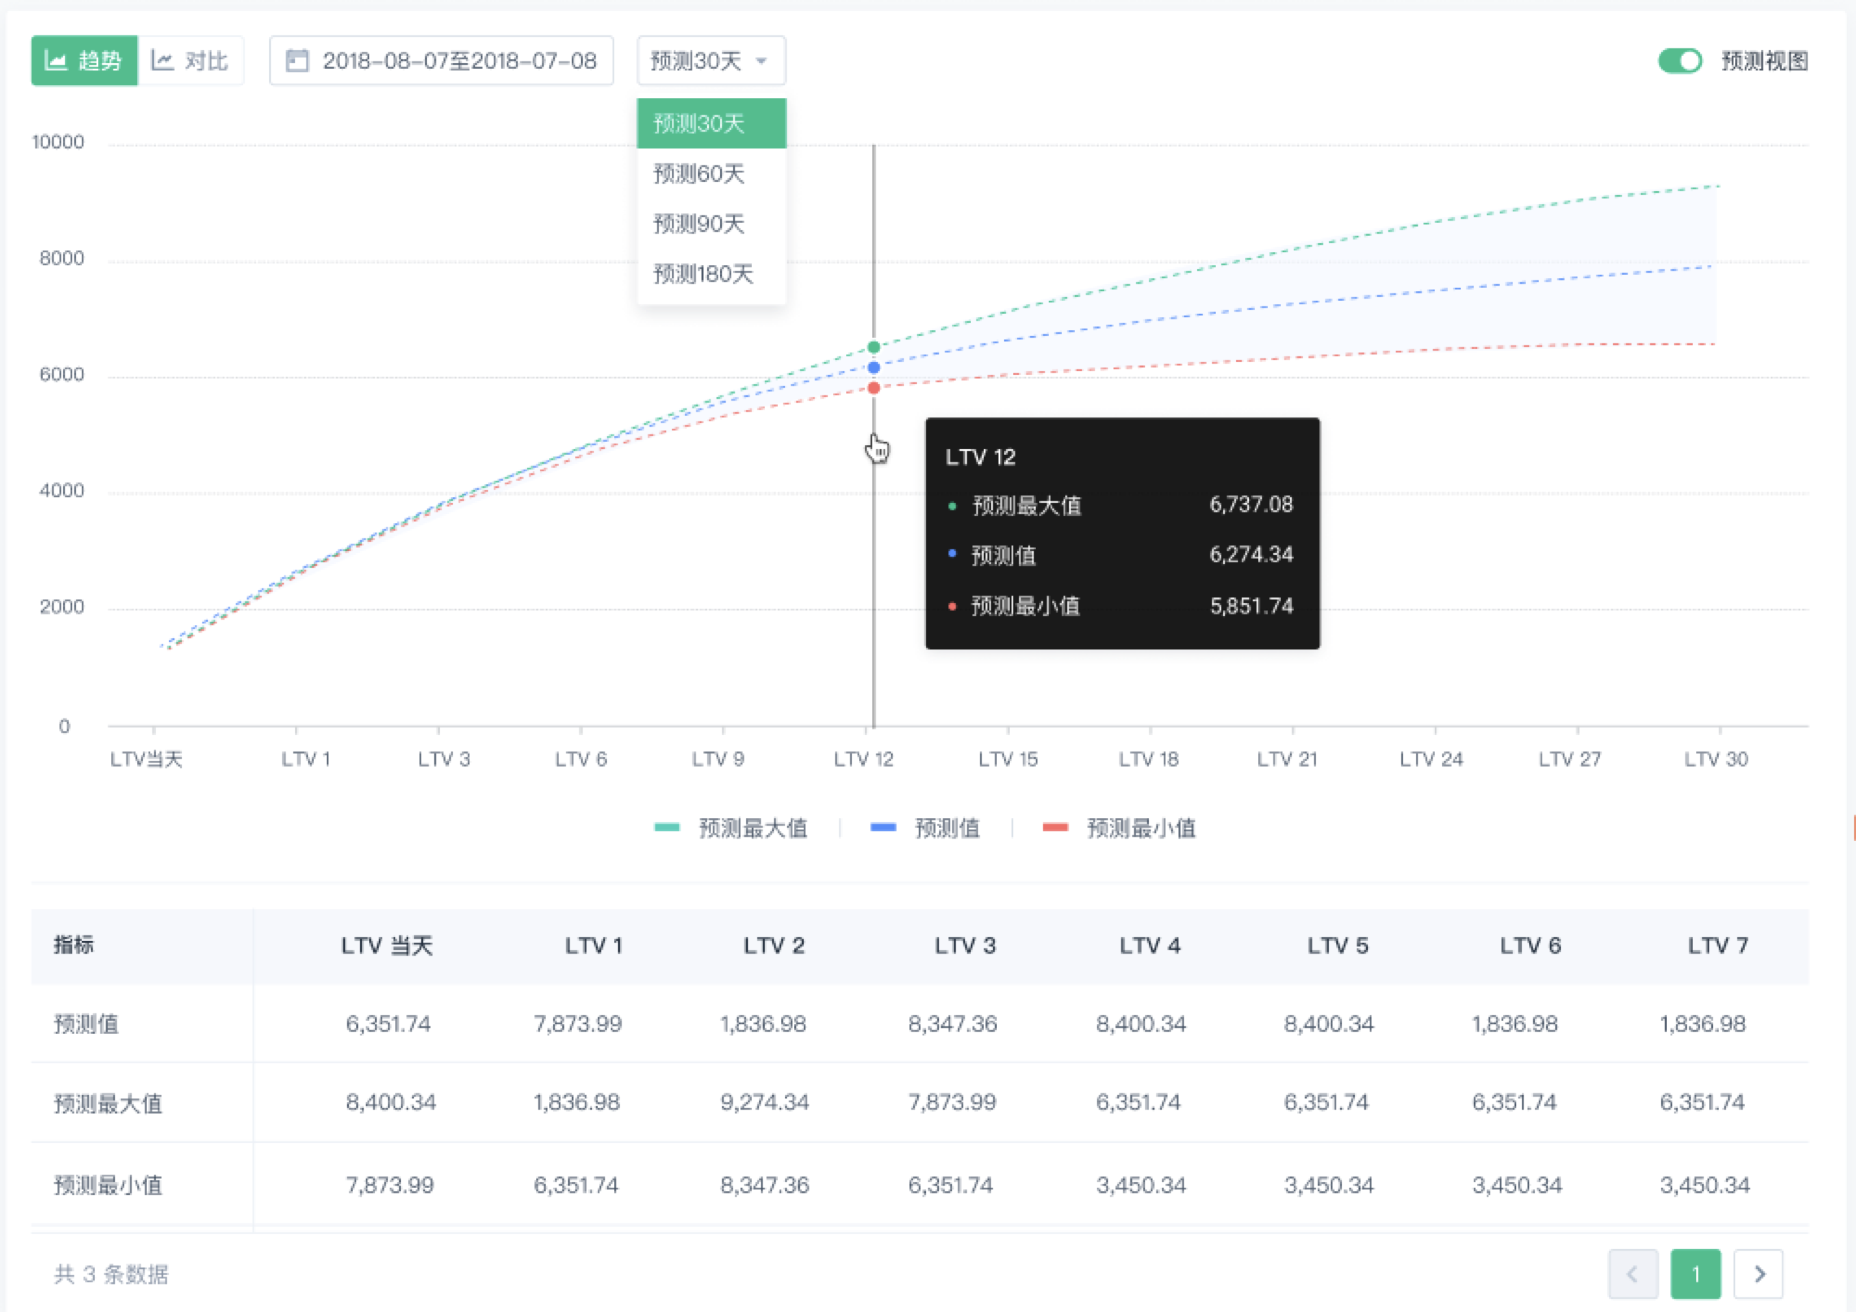
Support forecasting LTV for 30, 60, 90, 180 days, and display the predicted value, maximum value and minimum value obtained by intelligent algorithm prediction.
2.5.5.1. LTV forecast precautions
- Only when there is no grouping in a single index, and the earliest date of the selected period is no less than 7 days from the present time, can it be switched to the forecast view.
- The forecast is the summary value of LTV for each date within the time period. When calculating the summary of the forecast, the dates with incomplete data will be removed. Therefore, the forecast value of LTV may be greater than the summary value of LTV in the trend view.
2.6. Contrast view
In the comparison view, LTV can be compared with the change of initial date.
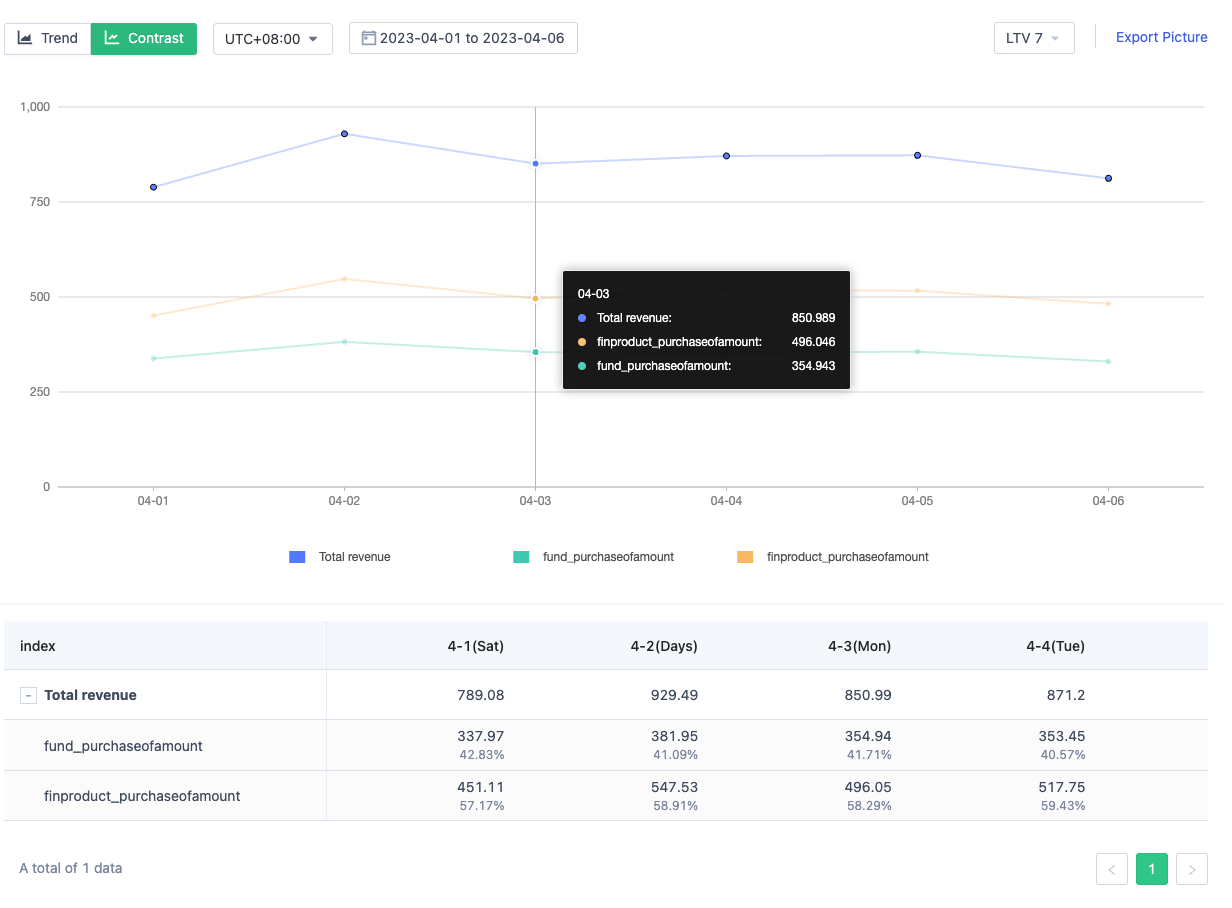
2.6.1. Contrast chart
Similar to the trend chart, the display of the contrast chart can be divided into two situations: when viewed by overall, LTV changes with the initial date for each revenue index and total revenue can be viewed; when viewed by property grouping, the total revenue LTV corresponding to each subgroup can be viewed in the chart.
The LTV value currently displayed in the upper right corner of the chart is LTV 7 by default. Users can switch to other LTV values in the drop-down list, including LTV 0-7, LTV 15, LTV 30, LTV 60 and LTV 90.
2.6.2. Contrast table
Similar to the trend table, detailed LTV index values can be viewed in the contrast table. At the same time, when multiple indicators are used, the total revenue is displayed by default. Click the "unfold" button in the indicator column to show the LTV values of each indicator and their proportions in total revenue.
In the table, when viewed by grouping, the subgroups are sorted by group name in ascending order by default. You can filter the groups and sort them again by group name or total revenue LTV value.
3. More questions
3.1. What's the difference between calculating average cumulative values of LTV in LTV analysis and retention analysis?
LTV analysis calculates the average cumulative value per user. The feature of displaying data for the same period in retention analysis can be used to calculate the cumulative average value per user for each stage, which can also be used to calculate LTV. But there are three differences in the calculation method between the two.
- Difference in the initial user group: In retention analysis, as long as the user has an initial event, he or she will be counted in the corresponding initial date. In LTV analysis, if a user has multiple initial events, the user will only be counted on the day when the initial event occurs earliest.
- Differences in the retained user group: Retention analysis calculates the cumulative average value per user of the retained users. When the subsequent events in the retention analysis are not revenue events, the calculated retained user groups will be different from those in LTV analysis. In LTV analysis, the calculated user group is the users who have revenue events among the initial users.
- Order of occurrence of the first day event: In retention analysis, the calculation of day/week/month 0 does not distinguish the order of initial behavior and subsequent behavior. Therefore, if the subsequent behavior within the day occurs earlier than the initial behavior, it will also be counted in the retained user group. In LTV analysis, only when the revenue event occurs after the initial event, it will be counted in the revenue.
Note: The content of this document is a technical document that provides details on how to use the Sensors product and does not include sales terms; the specific content of enterprise procurement products and technical services shall be subject to the commercial procurement contract.
 Popular Searches