Retention Analysis
|
Collect
1. Video version explanation
Retention analysis and explanation videos
2. Retention analysis overview
Retention analysis is an analytical model used to analyze user engagement/activity levels, looking at how many of the users who have engaged in the initial behavior will engage in subsequent behavior. This is an important indicator to measure the value of the product to the user.
Retention analysis can help answer the following questions:
Does a new customer accomplish the behavior you expect them to over time? If the order is paid.
How to verify that a social product has improved the guidance process for new registered users and is expected to improve user engagement after registration?
Want to determine if a product change is working, such as adding a new feature to invite friends, and see if people use the product for a few more months because of the new feature?
View an application example of retention analysis
3. Retention analysis interface function introduction
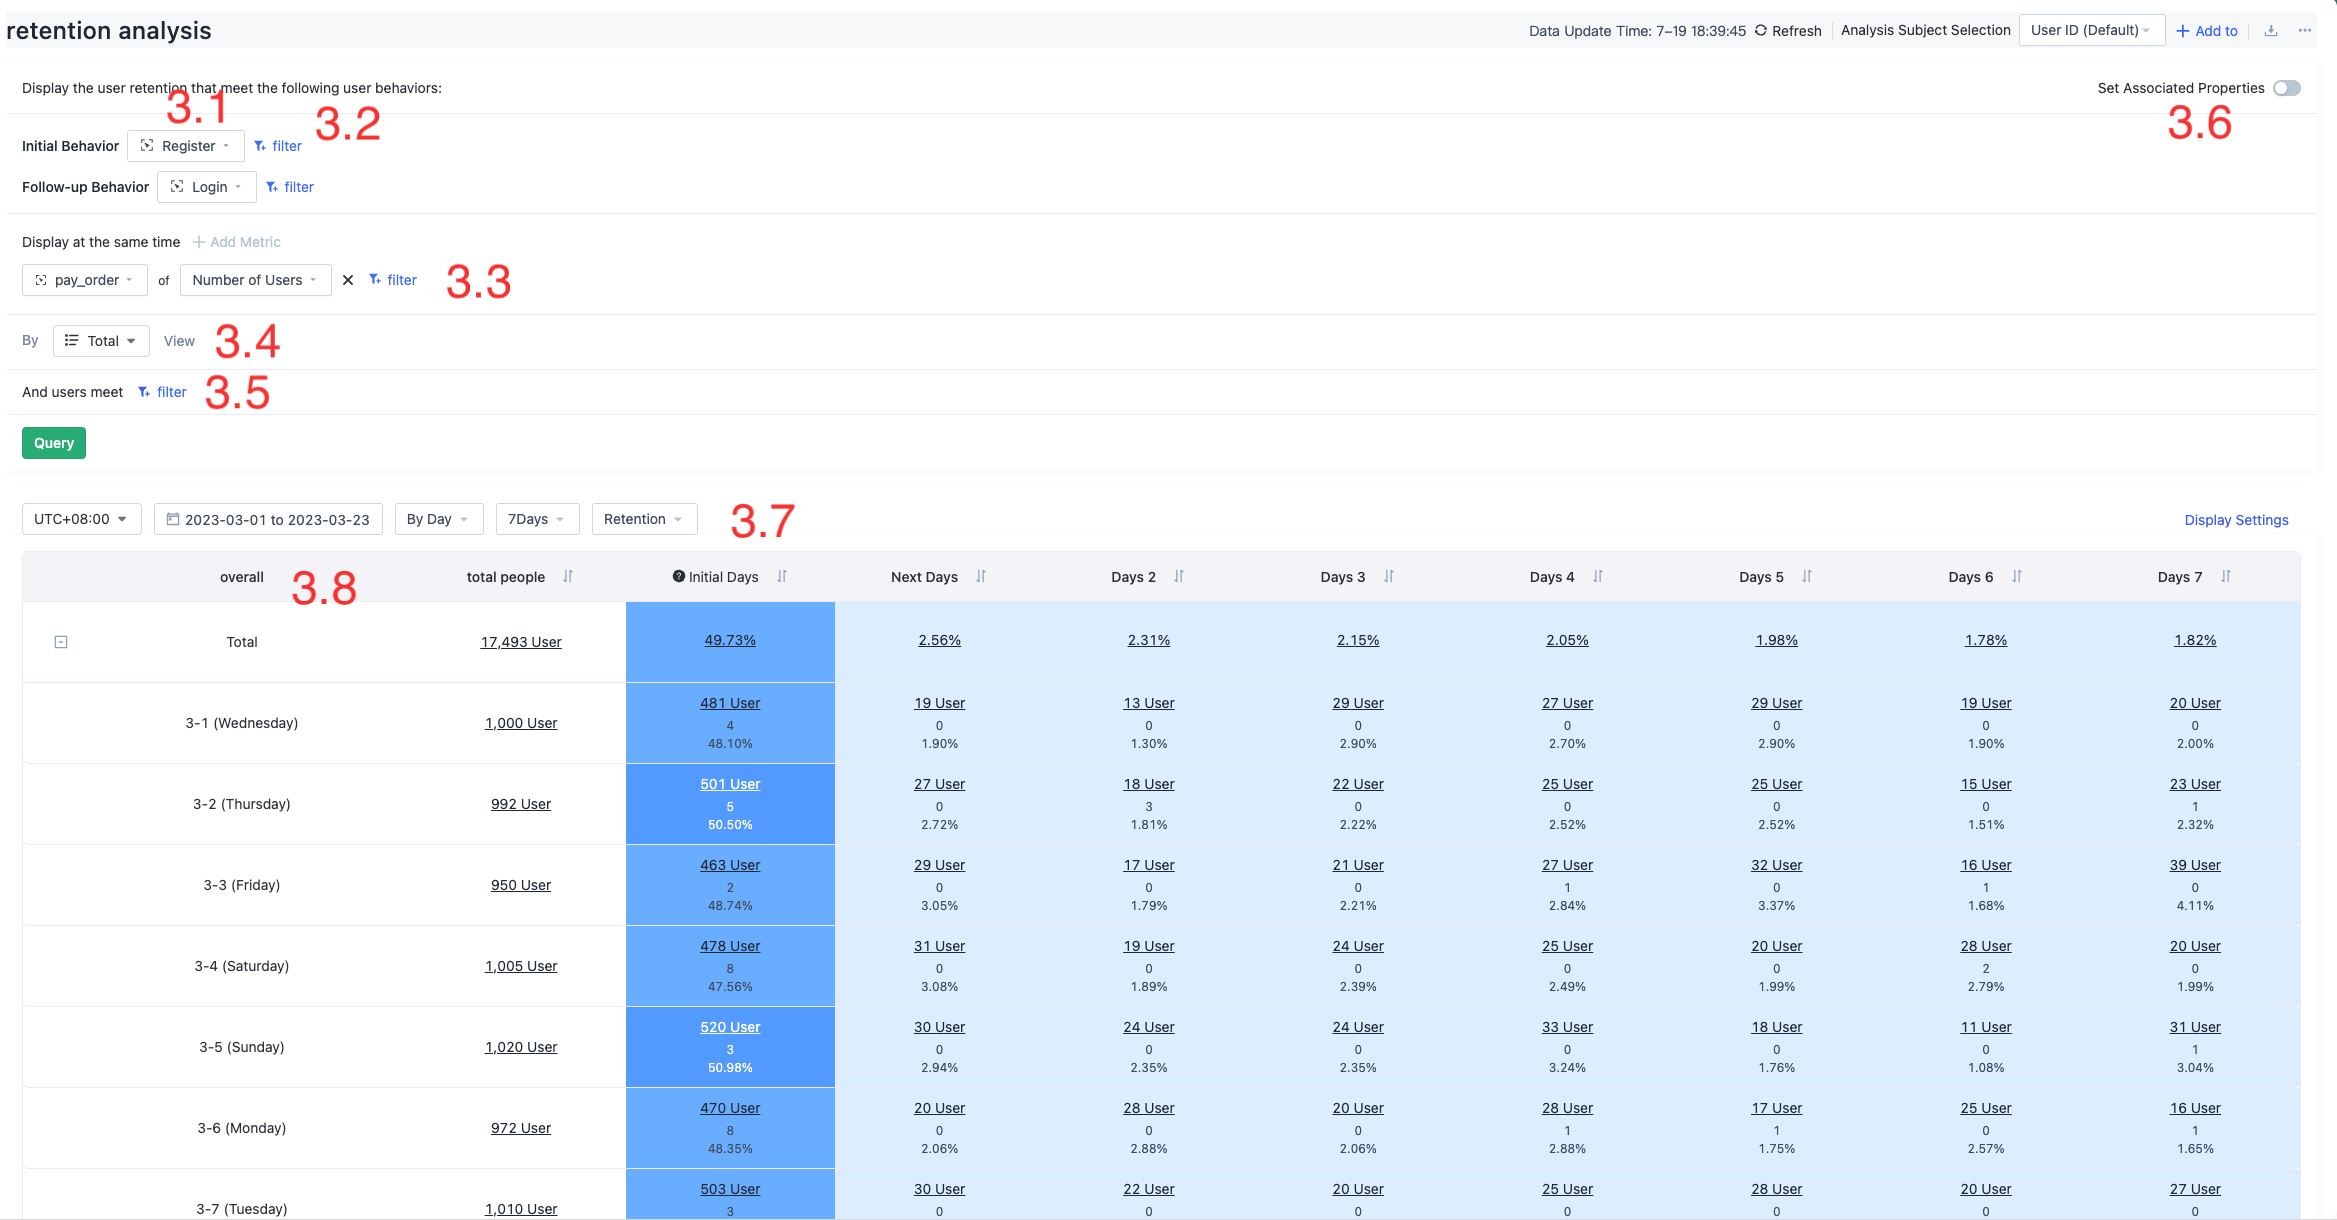
3.1. Select the initial behavior and subsequent behavior
There are two strategies for selecting the initial behavior and the subsequent behavior:
The initial behavior selects the events that the user triggers only once, such as "register", "Upload avatar", "activate device", etc., and the subsequent behavior selects the events that you expect the user to trigger repeatedly, such as "read the article", "post", "purchase", etc. This retention is used to compare and analyze the engagement of new users starting to use the product at different stages to evaluate the gains and losses of product iterations or operational strategy changes.
The initial behavior and subsequent behavior are selected to be the same, and the user is expected to trigger the event repeatedly. This retention is used to analyze the usage patterns of loyal users.
3.2. Set the filtering criteria for the initial behavior and subsequent behavior
For the attributes of the event, the segmentation dimensions of the initial behavior or subsequent behavior can be filtered according to the specific needs. For example, if we want to analyze the retention of the subsequent purchase of mobile phones after the registration of users in the Beijing area, we can define the initial behavior as "register", and add the screening condition of "city equals Beijing", the subsequent behavior is "payment of the order's product details", and add the screening condition of "product type equals mobile phone" to meet the analysis needs.
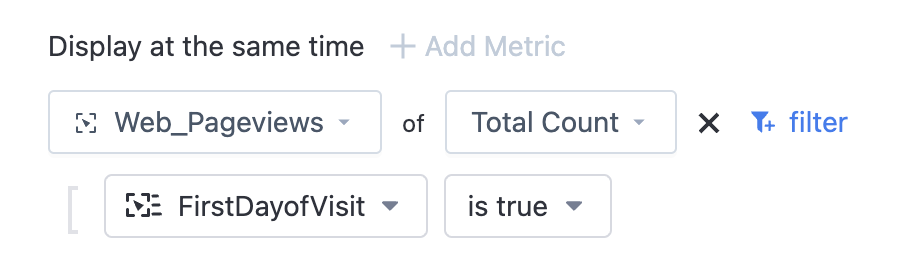
3.3. Add metrics that are displayed simultaneously
In the retention analysis, you can add indicators displayed at the same time to calculate the index value of the retained personnel. For example, the total recharge amount, per capita value, cumulative sum, cumulative per capita value, stage cumulative sum and stage cumulative per capita value of the retained personnel are counted during the retention period. When attributes are grouped, they cannot be displayed at the same time.
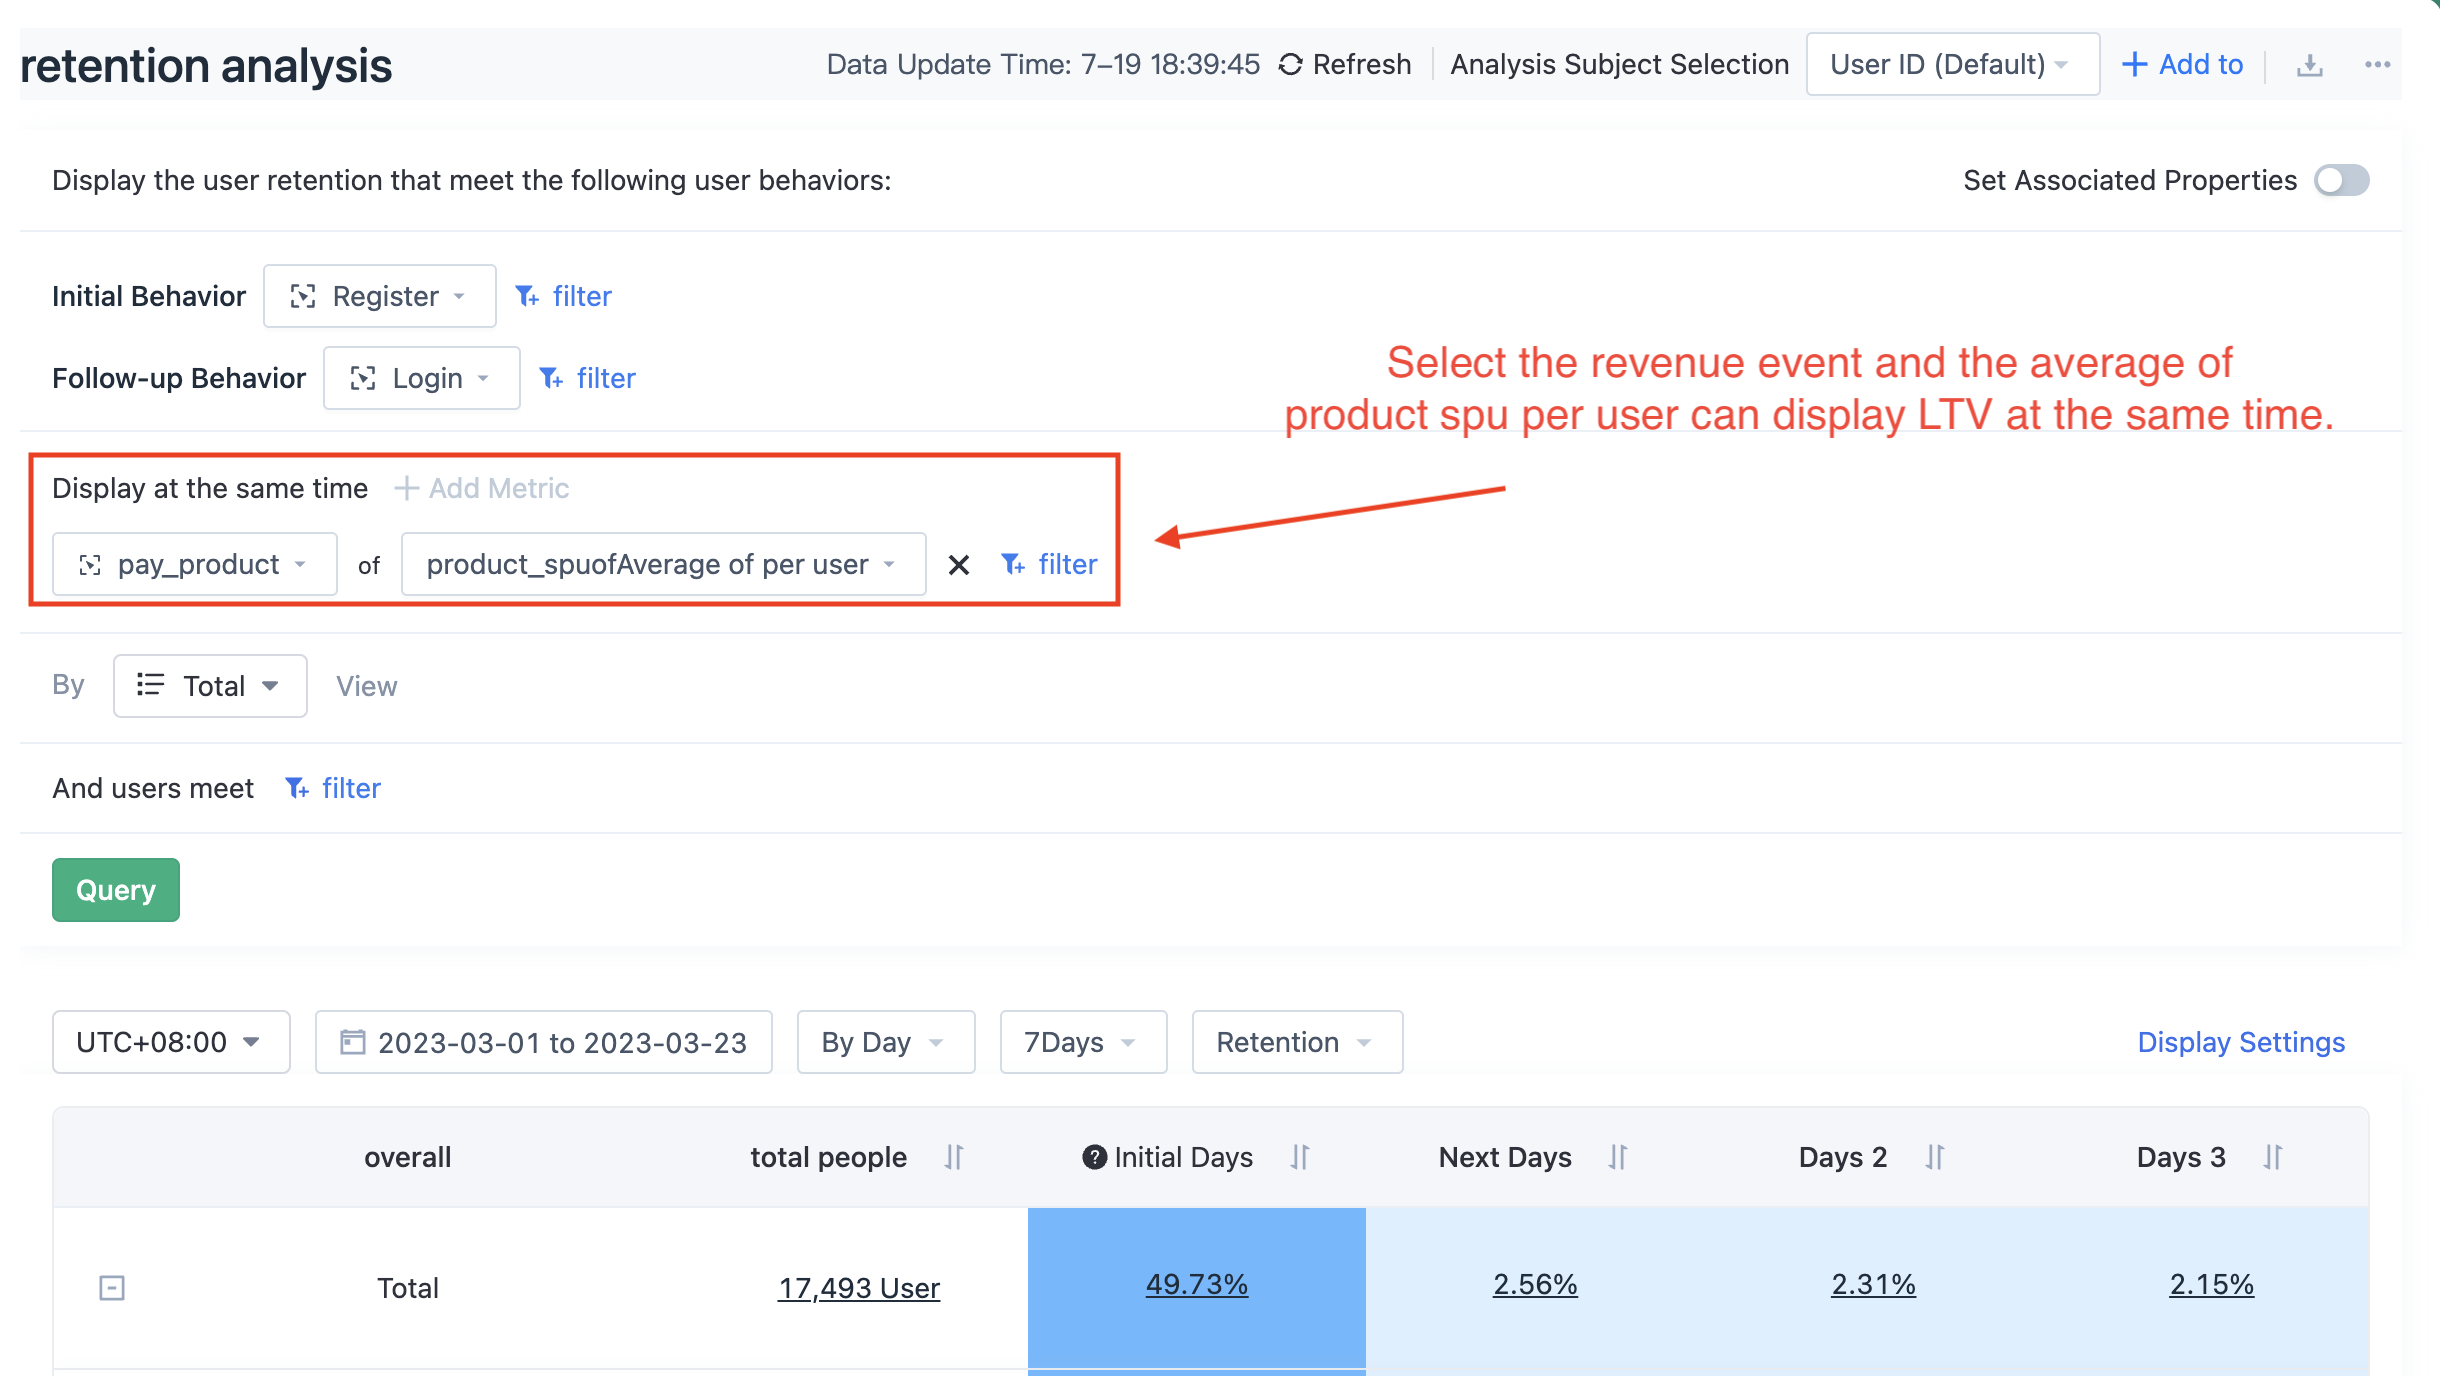
Among them, LTV (the user group visited on a specific date, the value per capita contributed over a certain period of time) can be calculated by the cumulative per capita value index of the stage. Show the cumulative per capita value of the stage in which the revenue event is selected and the amount attribute is selected in the indicator is displayed. The LTV of the user is displayed in the table.
The 2.5.1 version of Sensors Analytics already supports the simultaneous display of indicator increase event filtering.
3.4. Group view by attribute
Retention tables are grouped by default by the initial action date. The first column of each row represents the initial action date; The second column is the total number of people who triggered the initial action on that date (unique users); In the following columns, the number of users that trigger subsequent behaviors after the corresponding time and the percentage of the number of initial behaviors are respectively shown. If indicators are displayed at the same time, the corresponding indicator value is displayed.
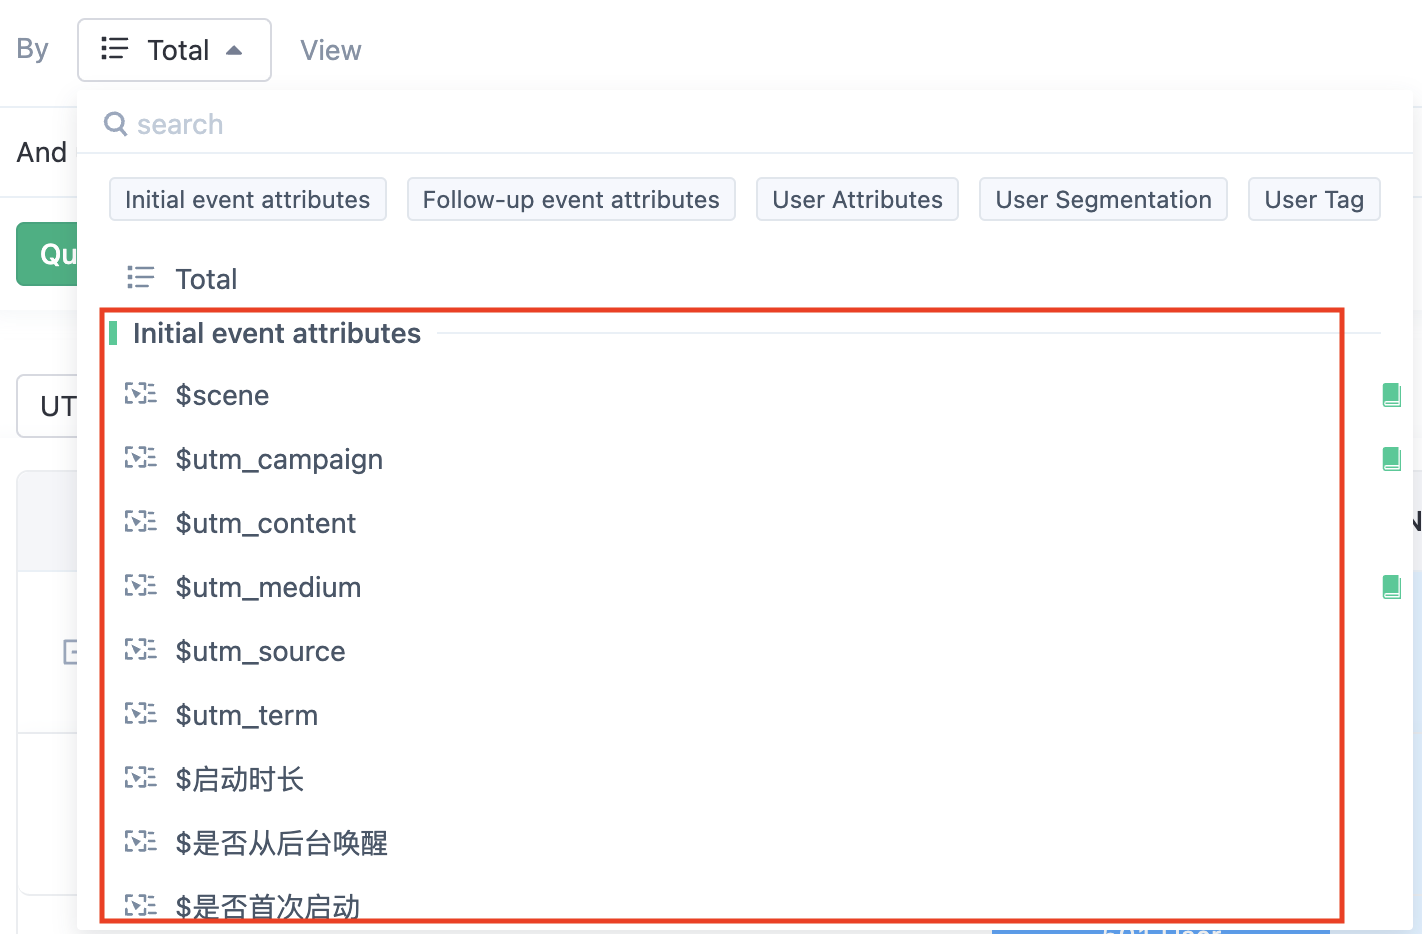
In addition to the initial behavior date, you can also group the view by the initial behavior event attribute or subsequent behavior event attribute. If we select the initial behavior event attribute to group by registration channel, we can see the subsequent retention of different registration channels.
Note that after setting association properties is enabled, you can view groups based on the associated properties of the initial event. If the associated attribute of the initial action event and subsequent action event is selected as the page title, you can see the subsequent retention of different pages.
Think it's a little complicated? It doesn't matter. Hover over each cell and a text will tell you what that cell means. At the same time, the background color of the cell can also intuitively reflect the retention.
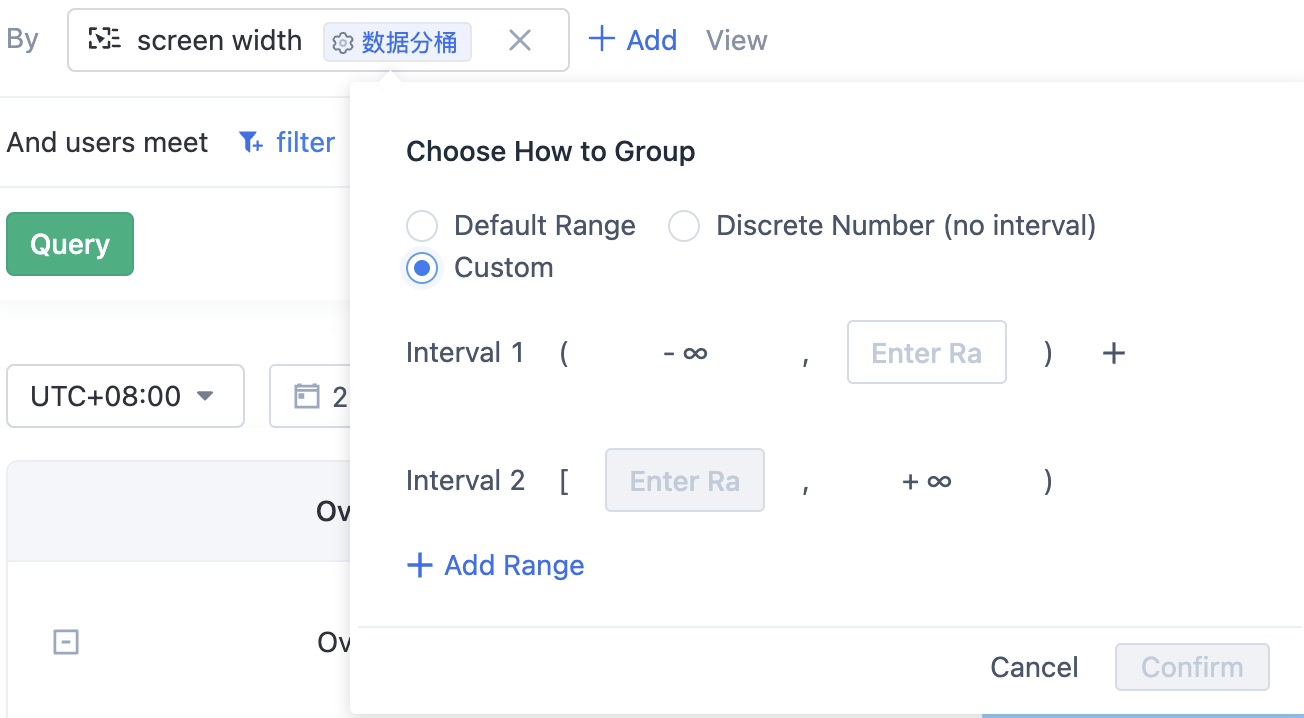
If the property selected here is of a numeric type, you can customize the group interval. If this parameter is not set, the query engine dynamically calculates the packet interval. This setting takes effect only for the current query and also in bookmarks after you save the query as a bookmark.
If the selected attribute is of list type, all attribute values in the list collection are split into separate subitems, and the retained analysis under a single attribute can be viewed separately. Note: If you set groups of multiple list types, only the split display of the last list type is supported.
3.5. Set user filtering criteria
Filter suitable analysis objects according to user attributes, user segmentation, and user tags. For example, only look at female users' retention.
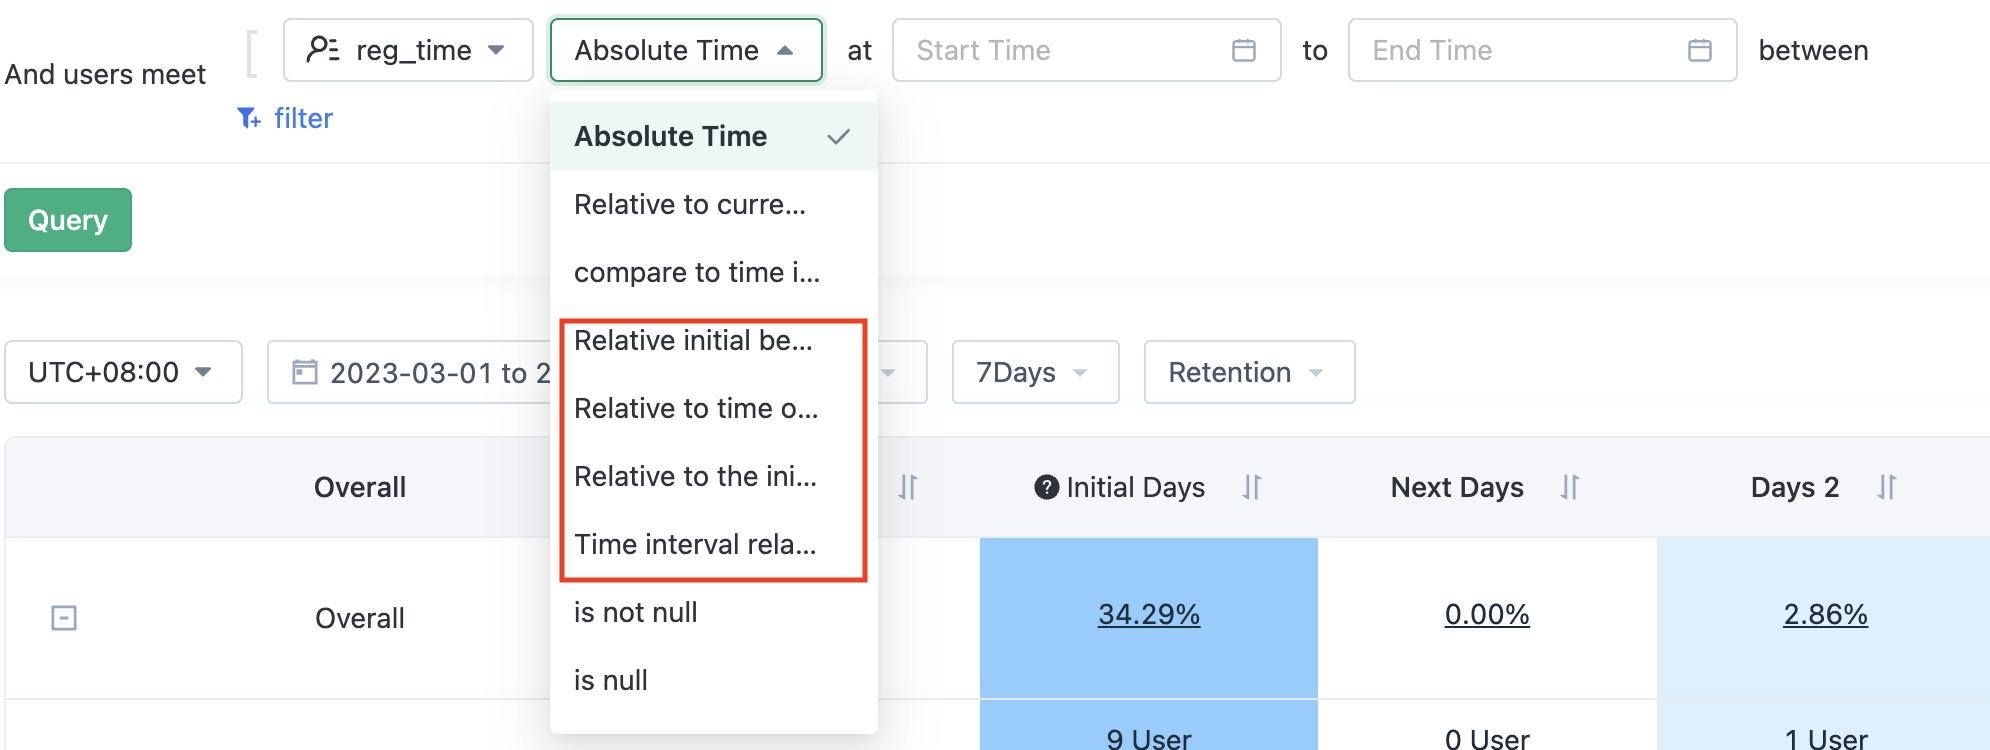
- User Attributes : Attributes of the time type,
You can set the time range relative to the occurrence time of the initial behavior event and the occurrence time of the subsequent behavior event. Comparison methods include: before, after, that day, that week, and that month. The time granularity can be days, hours, minutes, and seconds. For example, set user attribute: first login time, relative to the initial behavior event: App login within the day, the user who meets the screening is the user who logged in on the first day.
You can set the occurrence interval of the initial behavior event and the occurrence interval of the subsequent behavior event. You can set Past/Future N days/hours/minutes/seconds to Past/future N days/hours/minutes/seconds. For example, relative registration event occurrence time Last 60 days to last 30 days" is defined as a regular user, so regular users are filtered out.
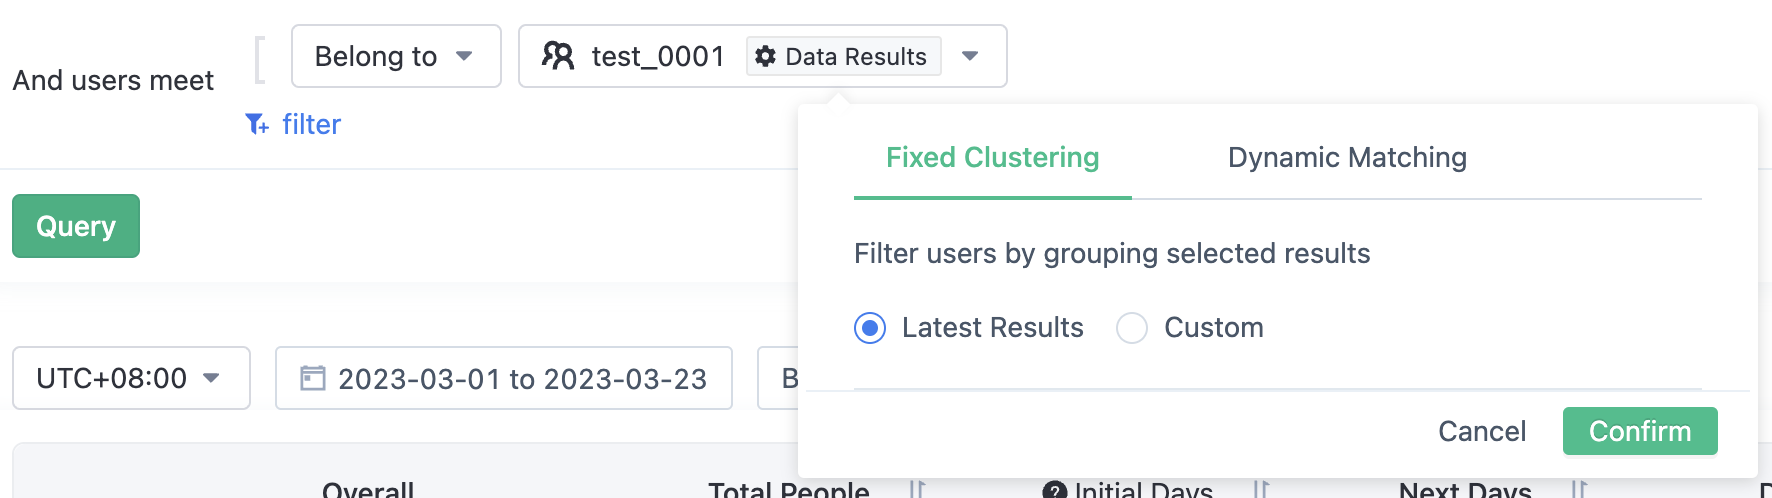
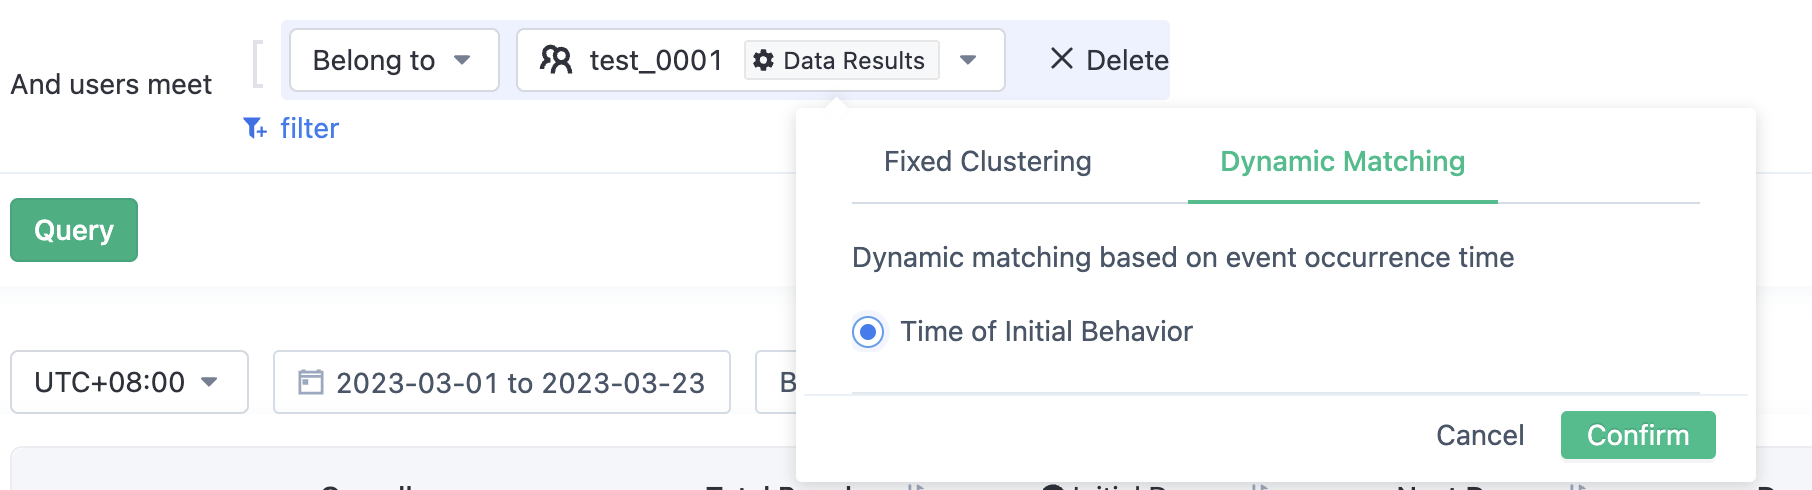
- User segmentation & User tag, support the configuration of user groups and tag results. A fixed segmentation can be selected, or dynamic matching can be performed according to the occurrence time of the initial behavior event.
- Latest results: The selected users are the latest results of the segmentation.
- Custom: Indicates the calculation result of a selected segmentation.
- Match by initial action time: Matches can be made based on the results of the initial action date and the subgroup date. If the occurrence time of the initial behavior event is 1st November, the segmentation result of 1st November can be dynamically matched and users can be selected. It is suitable for the retention analysis of population based on dynamic segmentation.
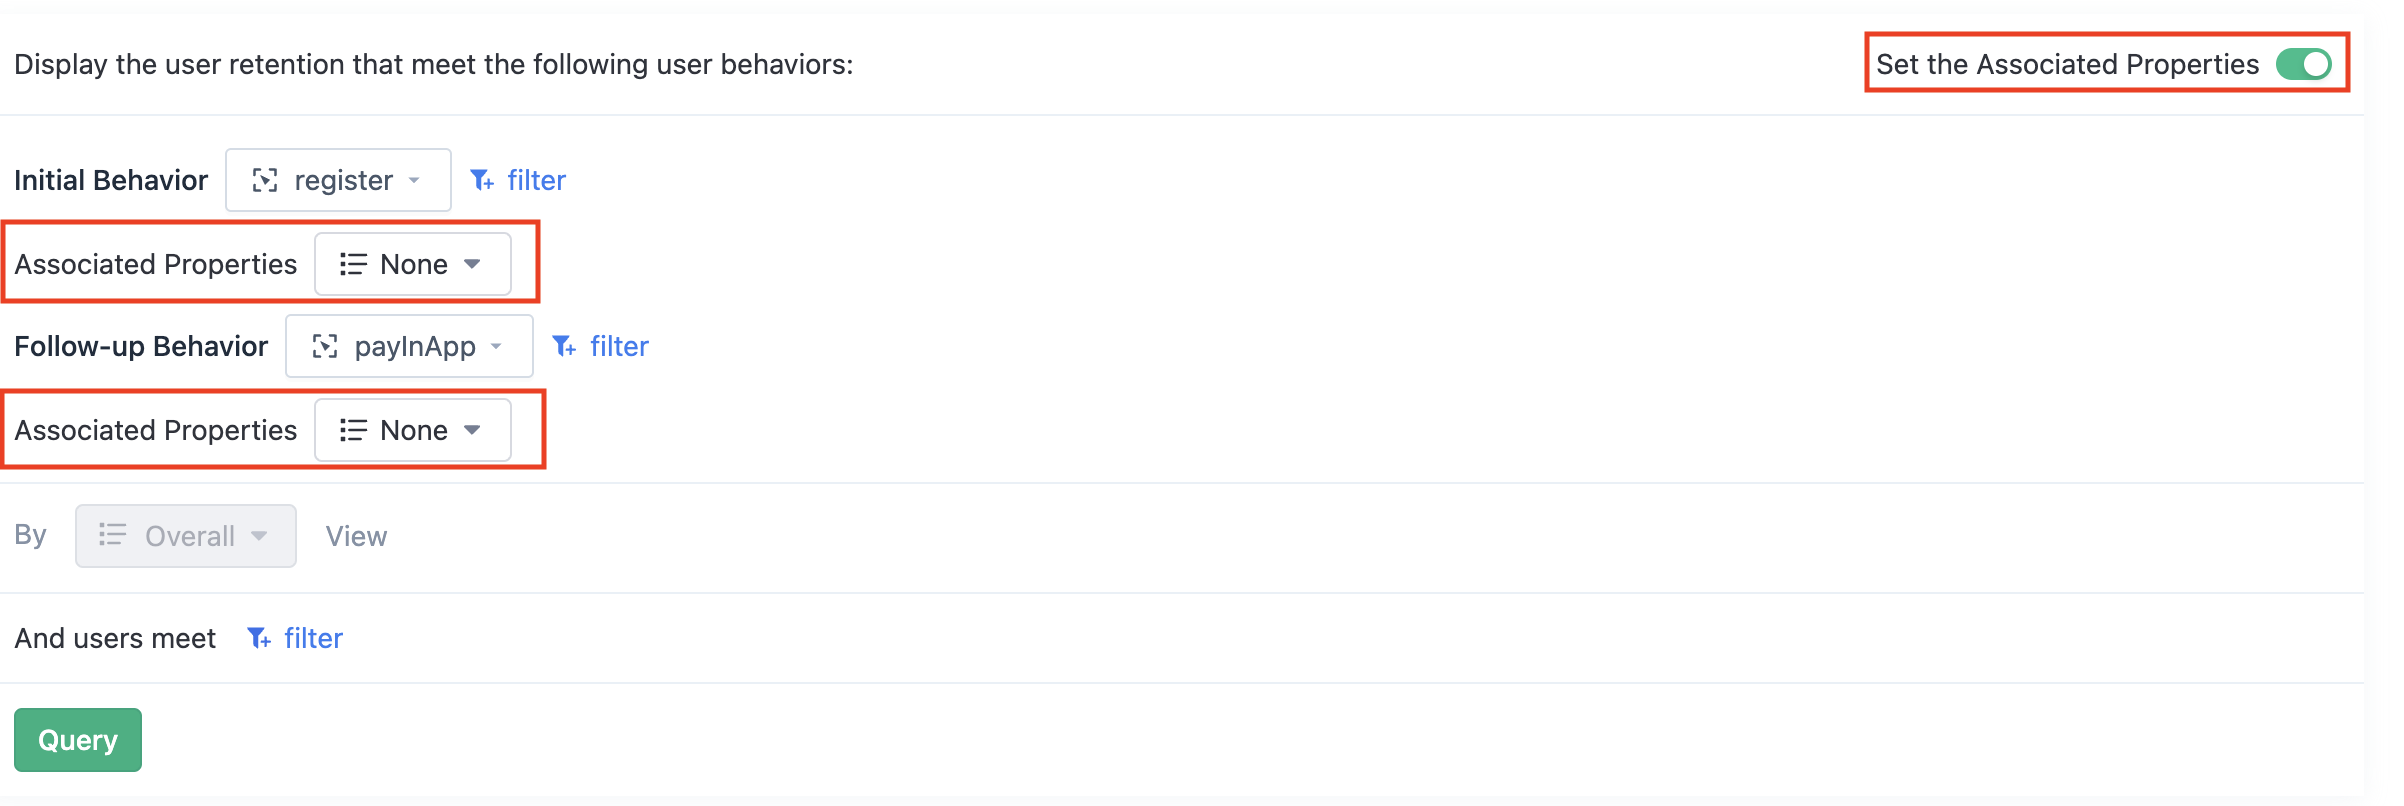
3.6. Set association properties
You can associate the attributes of the initial and subsequent behavior events. The attributes associated with different events can be the same or different, but the types of attributes must be the same. Example: A content site wants to know the seven-day retention of each page, so it needs to add the associated attribute page title to on the initial event App pageview and subsequent behavioral events App pageview. In this case, the association will be associated according to this attribute to ensure that users are matched strictly according to this mode.
3.7. Select the time period for inspection and retention/loss duration
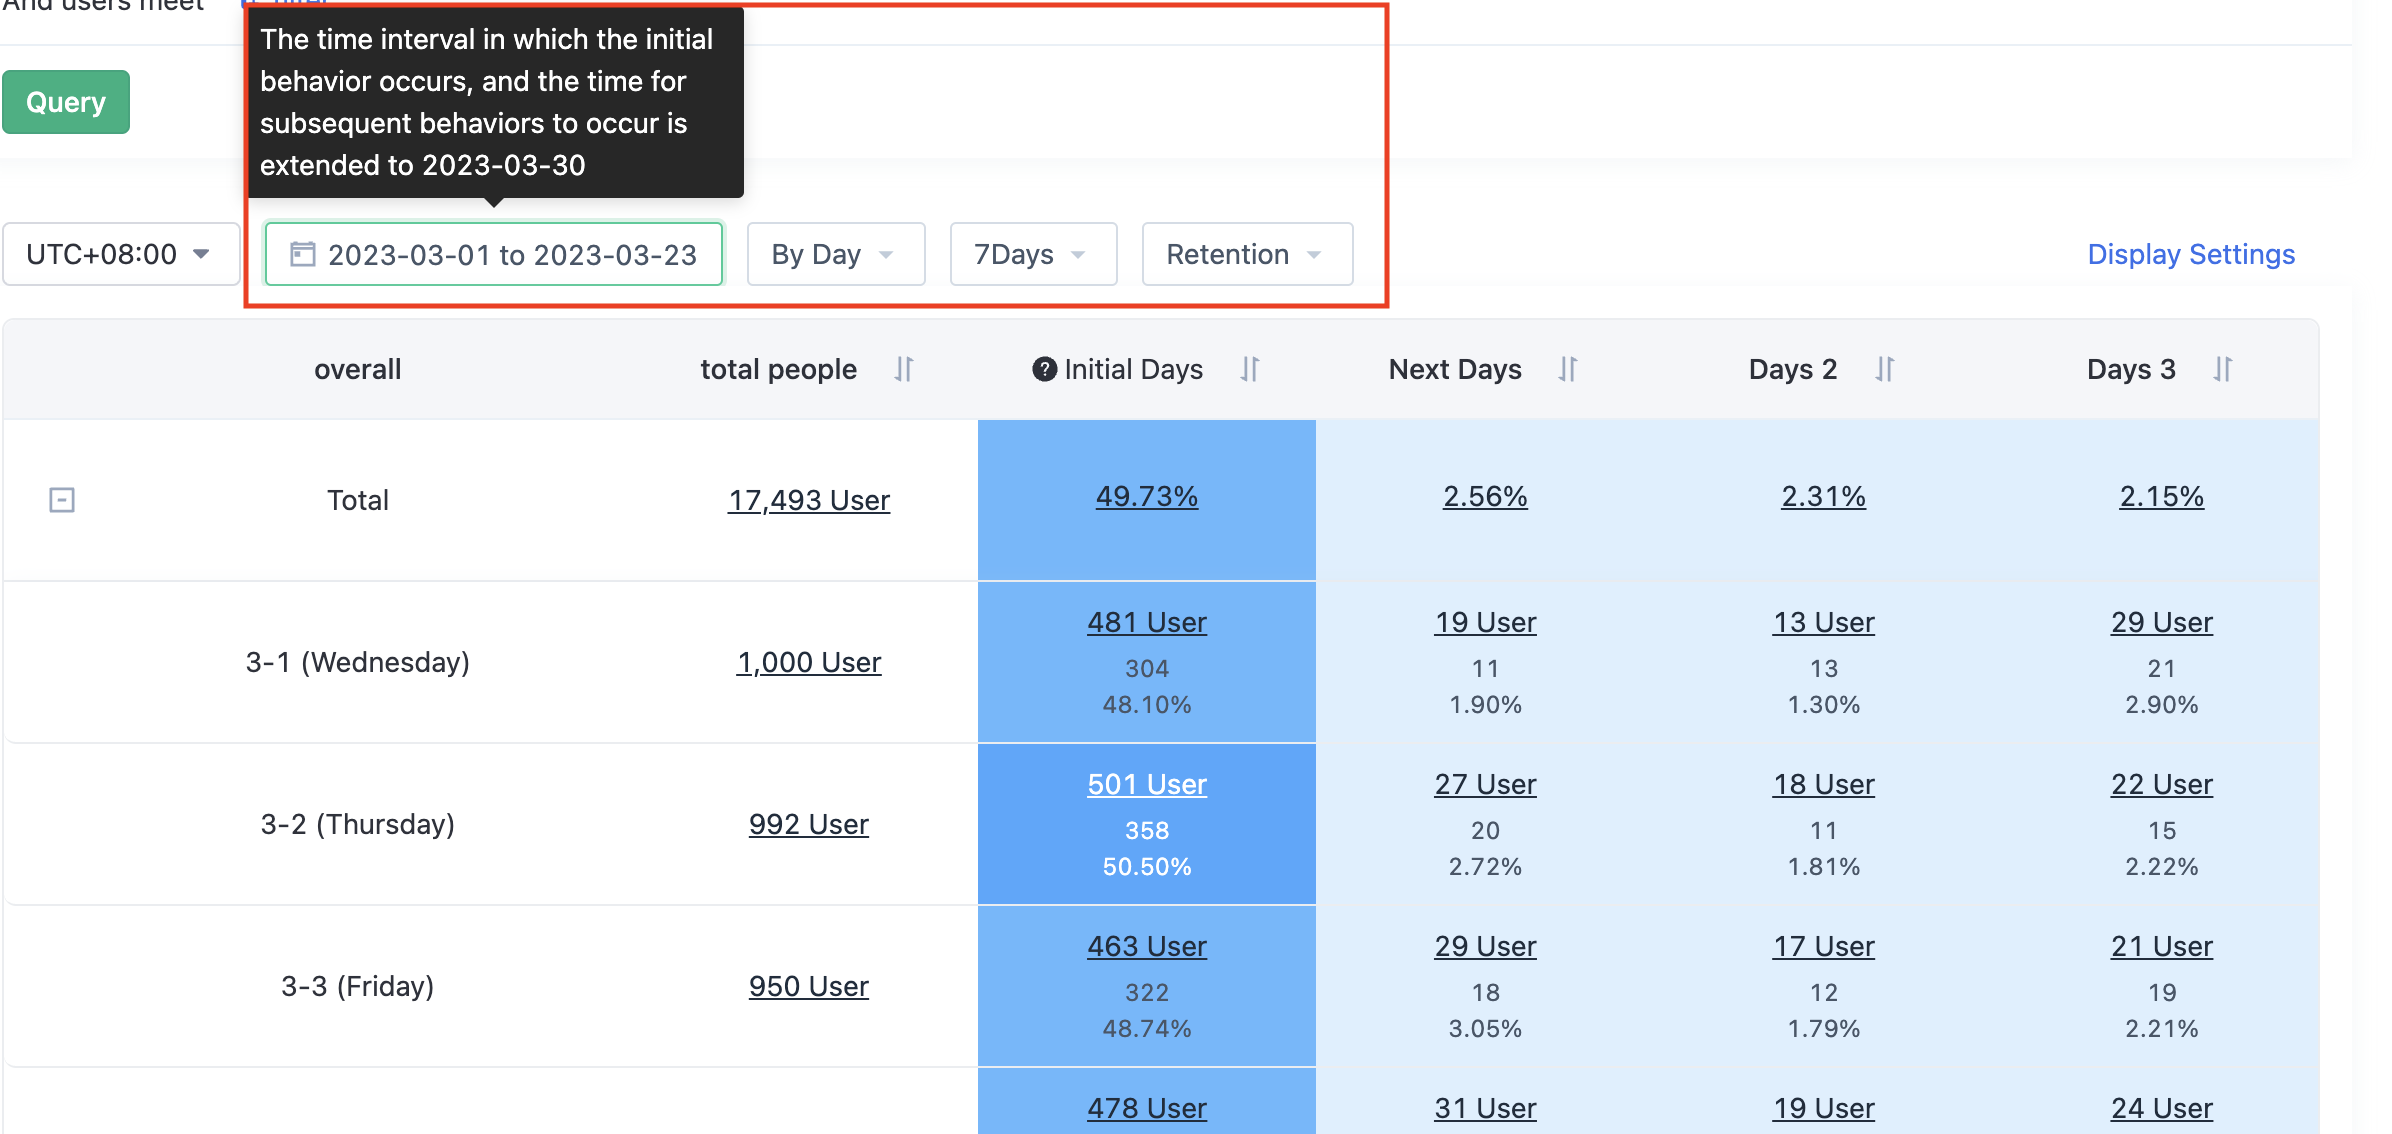
The time range selected here is the time range in which the initial action event occurred. If you select "7-day retention" in the figure above, the expiration date of the subsequent event will be extended to March 30, 2023 (March 23, 2023 extends 7 days).
You can view the retention/loss of different time volumes by day, week and month. Version 1.6.5 provides the ability to view the loss of users, click on the red circle above to select the loss time.
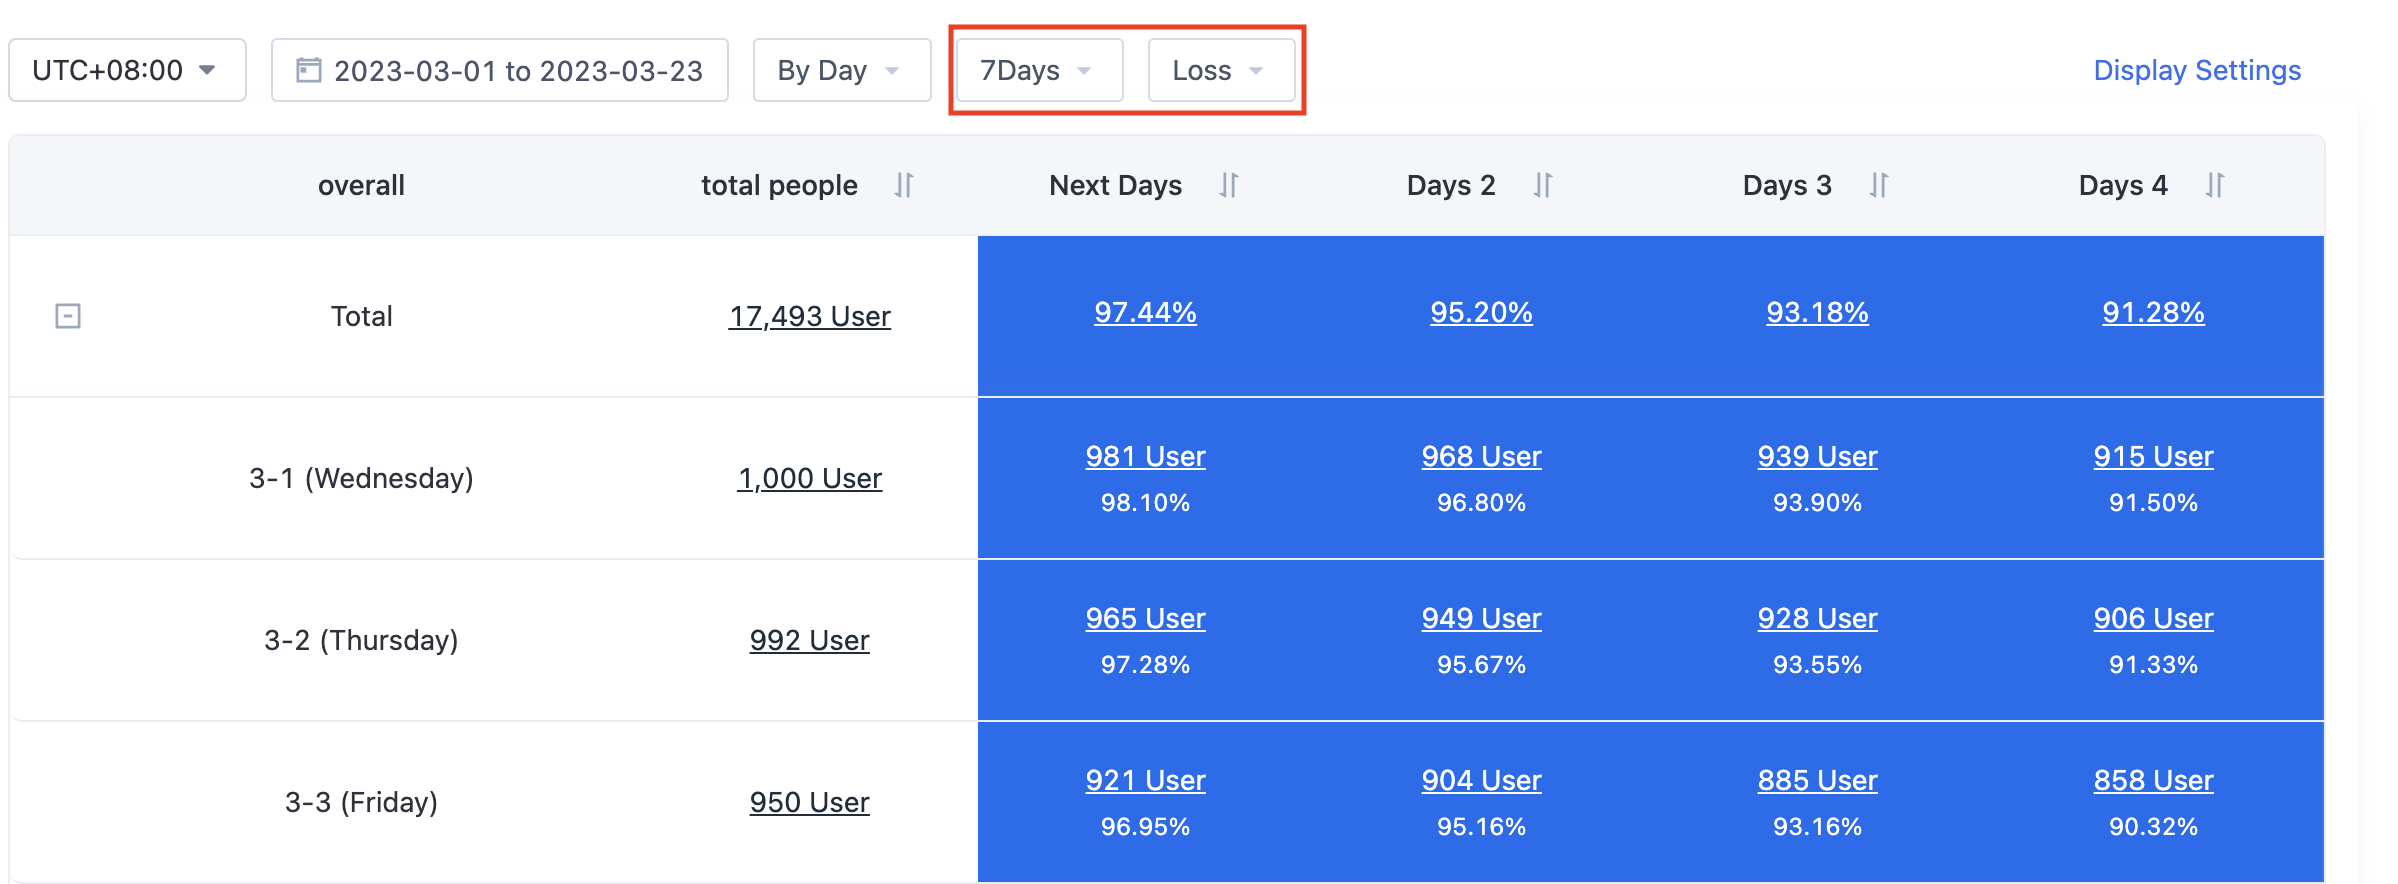
The definition of lost users in retention analysis is that users are lost only when no subsequent events occur after triggering the initial behavior event (excluding that day, that is, starting from the first day, counting consecutive days). As shown in the figure above, "Day 2" loss means that 968 people did not perform subsequent events for 2 days after the initial event (regardless of whether the user triggered subsequent events on 1st March).
3.8. Display setting
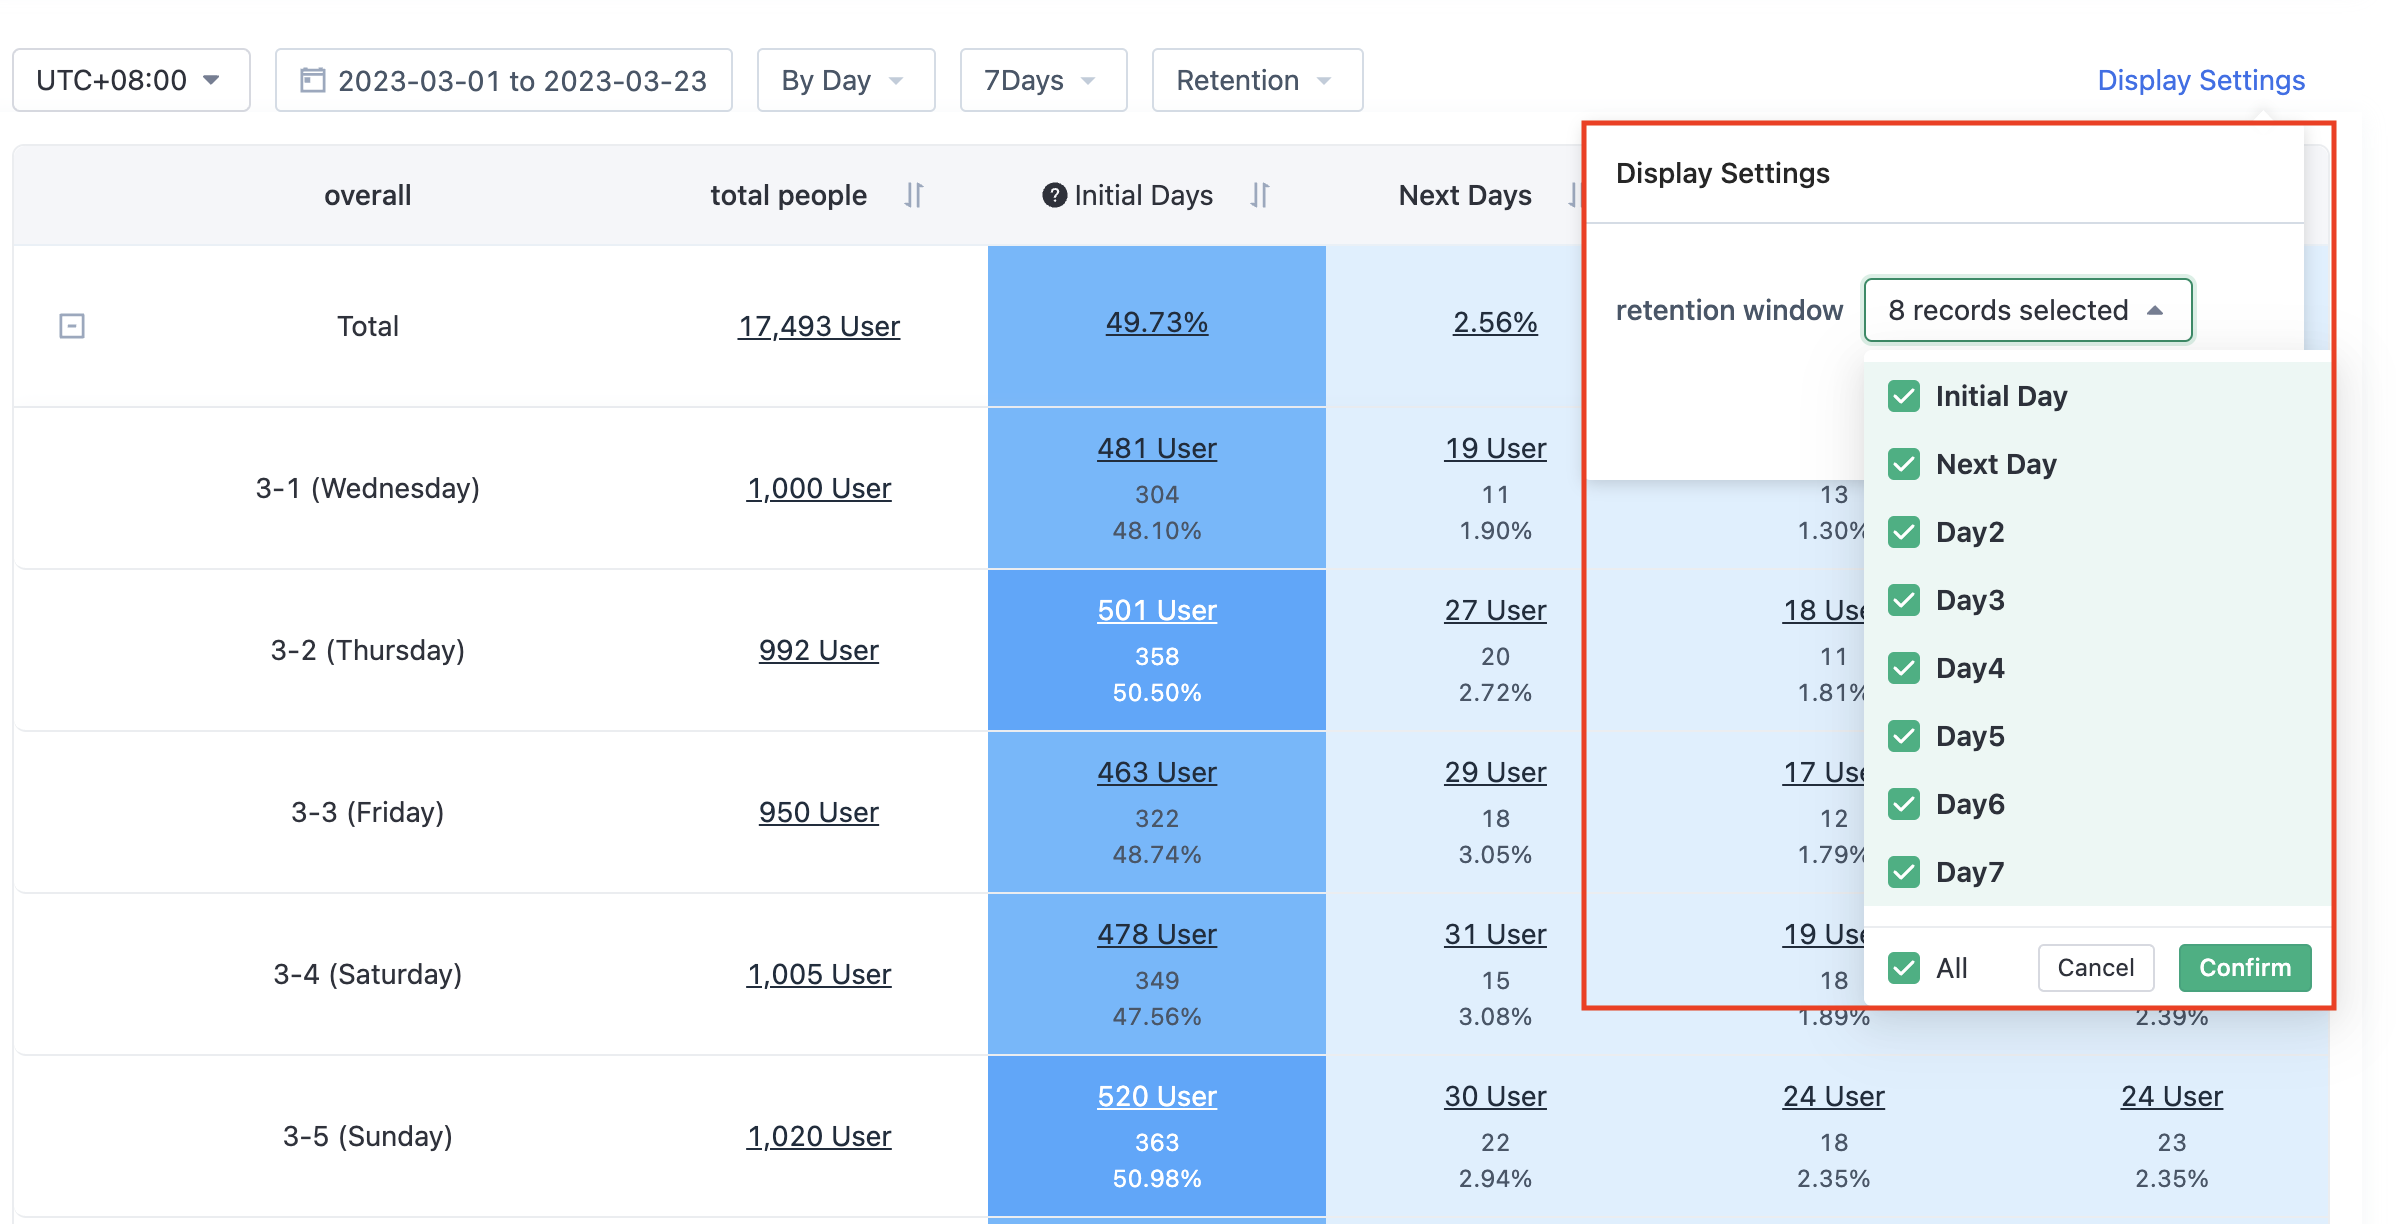
After version 2.5.1, the retention/Churn window key date configuration is supported
If you select 7 days retention by day, you can configure the key dates such as the next day, the 3rd day, and the 7th day retention. This configuration applies to the situation where users only care about the retention/loss of key dates, and do not need to display the retained data for N days, weeks, and months.
3.9. Retention form
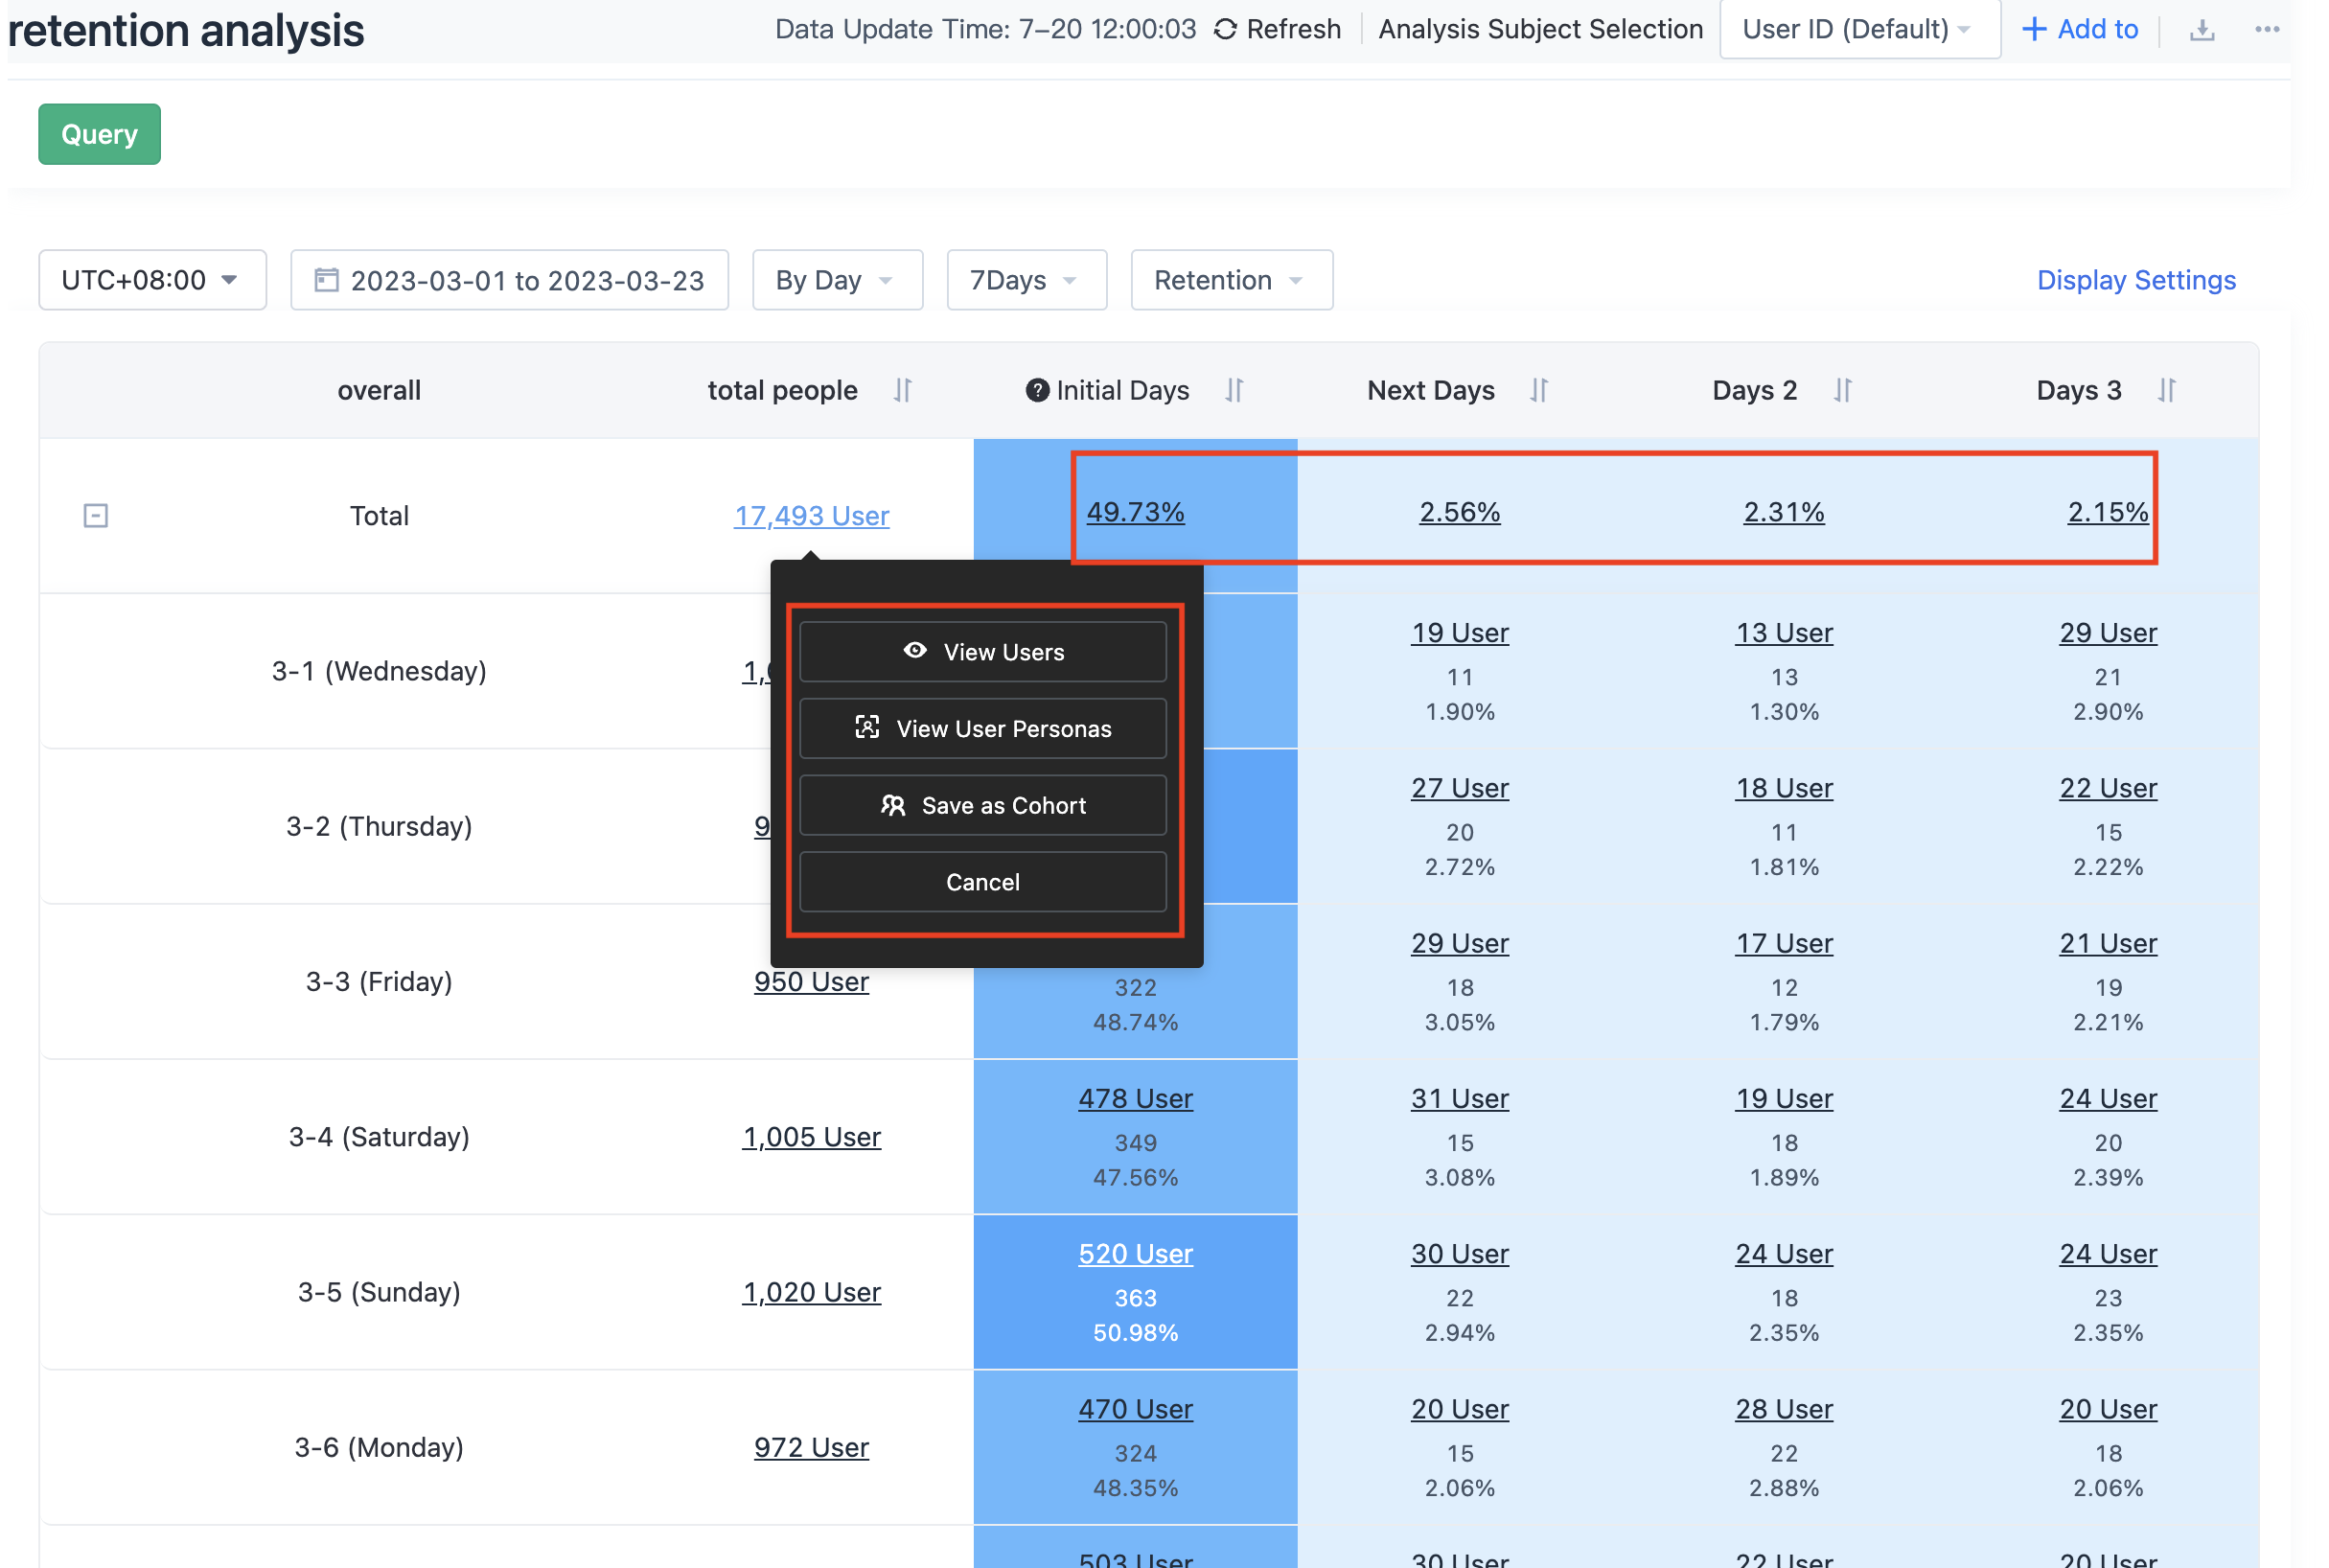
In the retention form, the mouse hover to the table, will display the corresponding prompt information. When you click on the number of users, you can view the user list and create user segmentations.
3.9.1. How to calculate the overall retention rate over time?
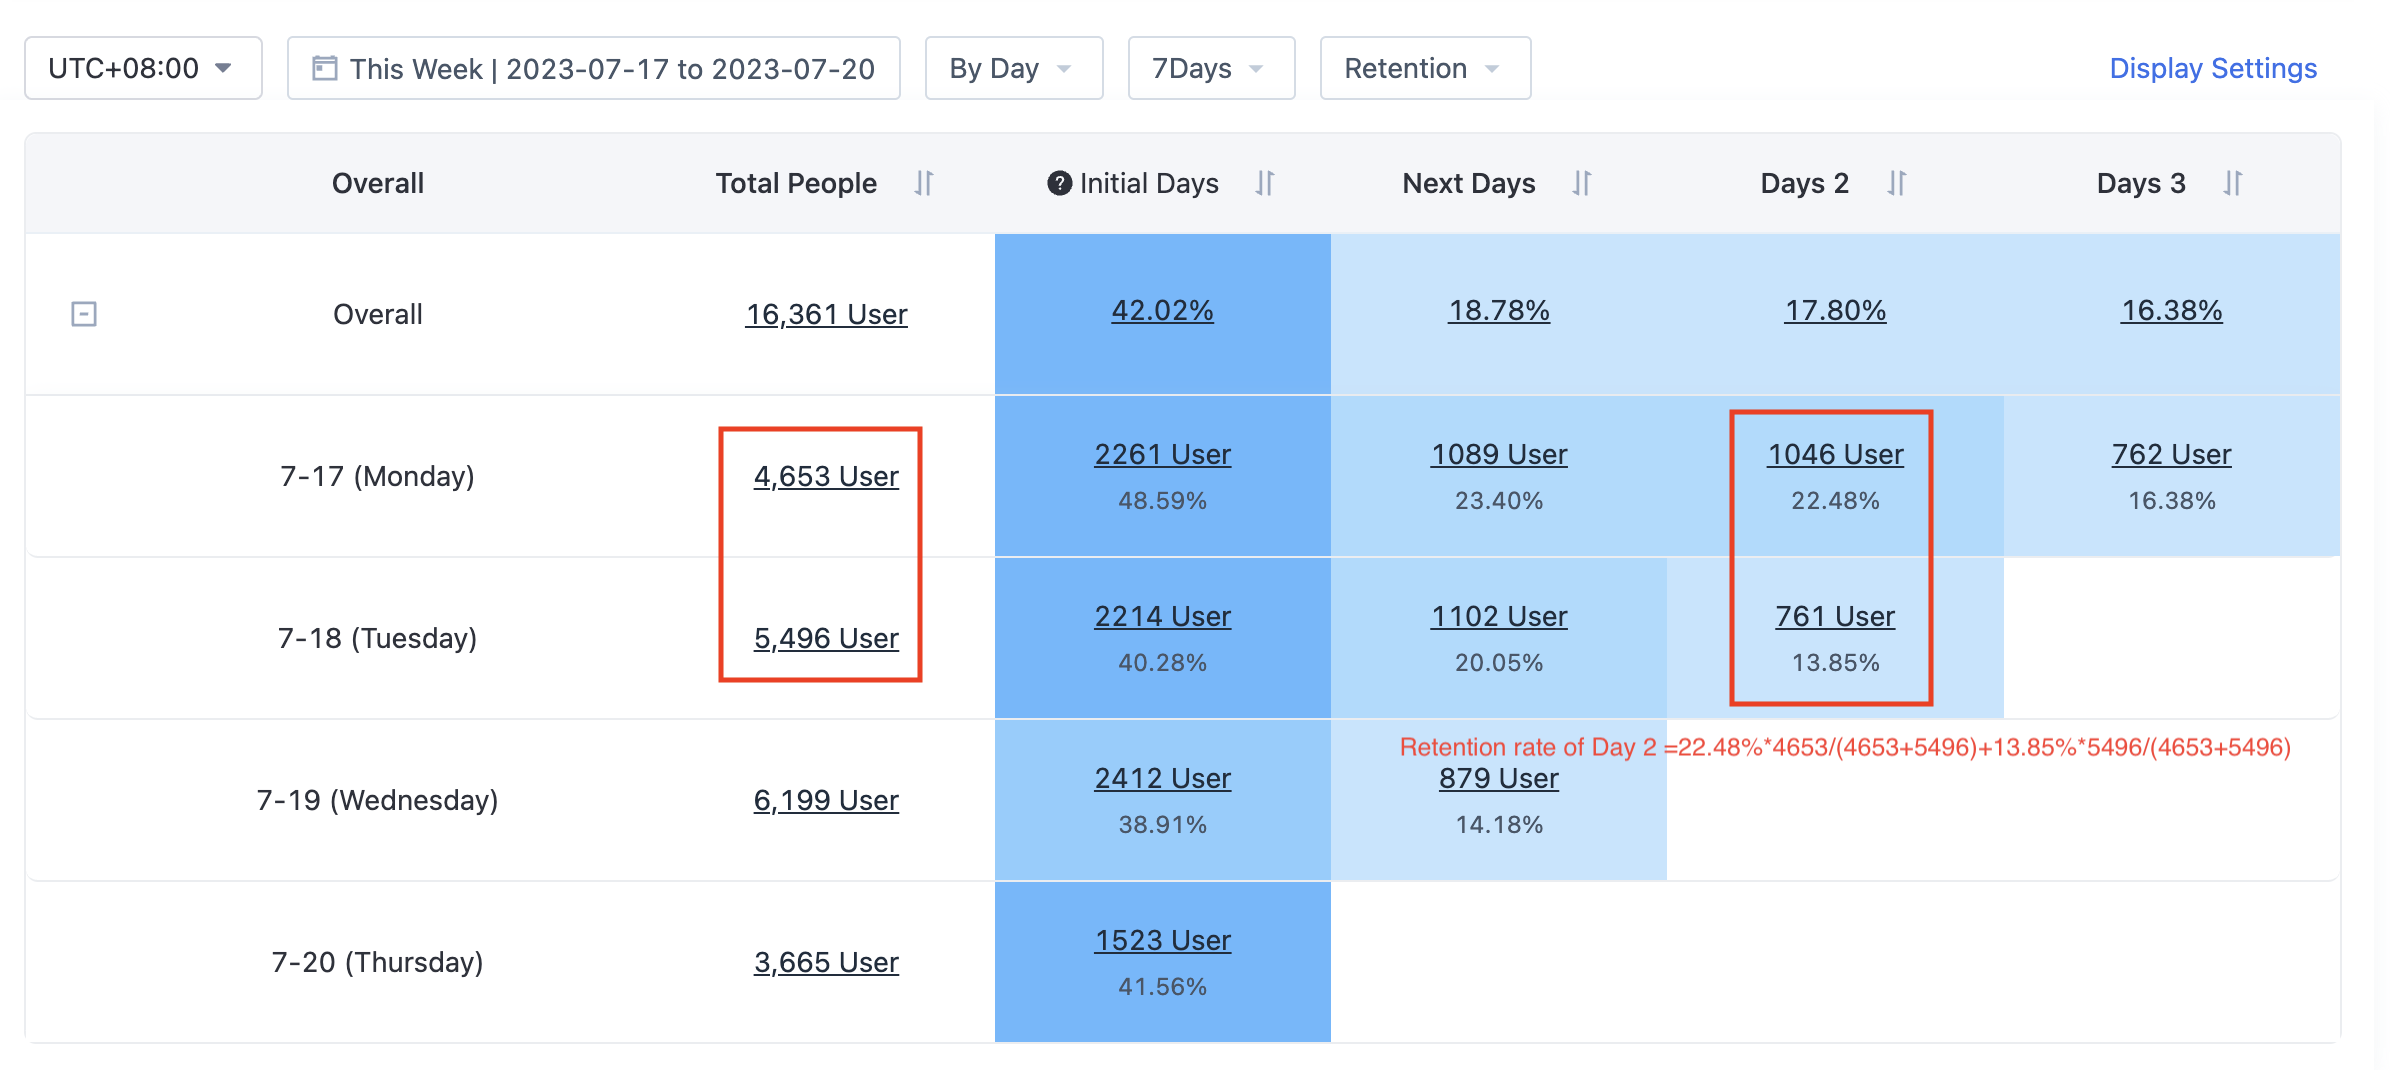
As shown in the chart below: The overall Day 2 retention rate is the "weighted average" of Day 2 retention rates for the two initial action dates of 2023-07-17 and 2023-07-18.
Note: The weighted average is calculated as the proportion of the total number of initial actors on the date of the day. For example, weighted average of 2023-07-17 = Number of initial actors/(2023-07-17 Number of initial actors + 2023-07-18 Number of initial actors) =4653/ (4653+5496)
So the overall retention rate of day 2 = 22.48%*4653/(4653+5496)+13.85%*5496/(4653+5496)=1046/(4653+5496)+761/(4653+5496)=1807/(4653+5496)=17.80%
That is, in SA versions after 2.1, the number of people in the retention/attrition rate of the summary row (which supports the collapse of the expanded table row) is not removed. It is the sum of the retained/lost persons in each period divided by the sum of the total persons in the corresponding period. If you select Overall, you can select Show other indicators at the same time. The indicators displayed will also be displayed in the table.
3.9.2. View User Details
The numbers in the cells of the table can be clicked to view the details of these users and further view the detailed sequence of behaviors of individual users.
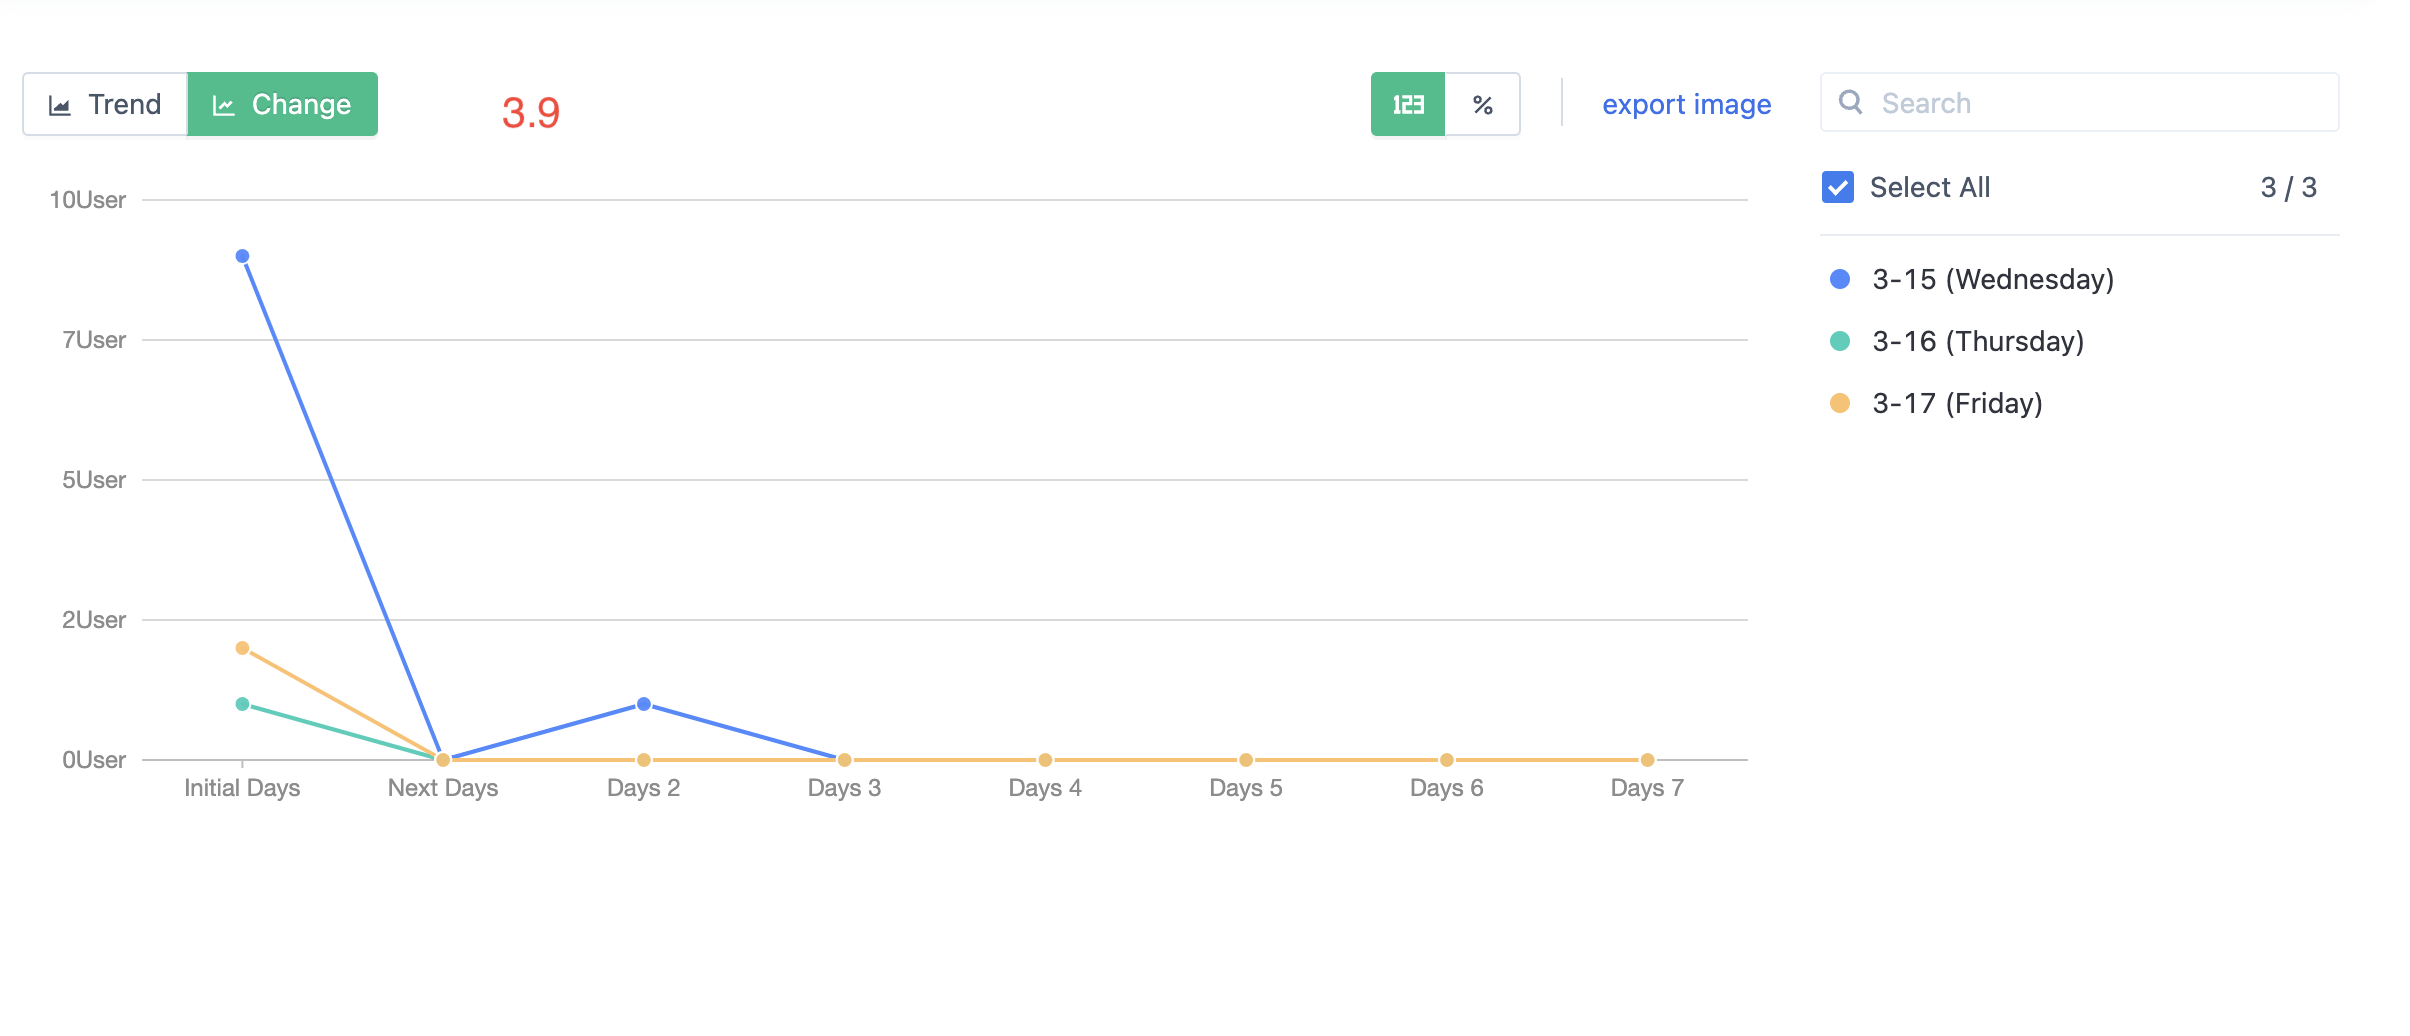
3.10. Change of retention trend curve
In another visual way, the retention of different groups is compared.
4. How is retention calculated
The numbers presented in the retention analysis represent unique users. It indicates how many of the users who performed the initial behavior in the selected time range performed the subsequent behavior on the Nth day/week/month.
4.1. Basic calculation rule
Assume that the defined initial behavior is event A, and the subsequent behavior is event B, and the screening period is from January 1st, 2015 to January 8th, 2015. Note that this time range is the occurrence time range of event A. The time frame for Event B is January 1st to January 15th, 2015 (January 8th plus 7 days).
4.2. The associated property is not set
The following table shows the real behavior sequence of a user from January 1, 2015 to January 8, 2015 and the behavior sequence included in the calculation (retaining the first initial behavior event or subsequent behavior event of the user on that day). In the table, letters A and B represent events, and numbers 1, 2, and 3 represent attribute values of certain attributes of the user.
Date | Real behavior sequence | The sequence of actions |
|---|---|---|
| 01-01 | A1,A2,A2 | A1 |
| 01-02 | B2,B1,B1 | B2 |
| 01-03 | A3,A1,A1 | A3 |
| 01-04 | A1,A3,A3 | A1 |
| 01-05 | A1,A3,A3 | A1 |
| 01-06 | B1,B2,B1 | B1 |
| 01-07 | A1,A2 | A1 |
| 01-08 | B2,B1,B3 | B2 |
The retention status of this user is as follows:
primary action date | primary event | Day 1 | Day 2 | Day 3 | Day 4 | Day 5 | Day 6 | Day 7 |
|---|---|---|---|---|---|---|---|---|
| 01-01 | A1 | B2 | B1 | B2 | ||||
| 01-03 | A3 | B1 | B2 | |||||
| 01-04 | A1 | B1 | B2 | |||||
| 01-05 | A1 | B1 | B2 | |||||
| 01-07 | A1 | B2 |
1. Without grouping, if the initial behavior date is specified as January 1st, 2015, the user is retained on day 1, Day 5, and day 7 respectively. If the specific date of the initial behavior is not specified, then the user has the initial behavior on 01-01, 01-03, 01-04, 01-05, 01-07, and the subsequent retention days are the first day (initial behavior date: 01-01, 01-05, 01-07) and the second day (initial behavior date: 01-04), Day 3 (Initial behavior date: 01-03, 01-05), Day 4 (Initial behavior date: 01-04), Day 5 (initial behavior date: 01-01, 01-03), day 7 (initial behavior date: 01-01).
2. According to the attributes of the initial behavior event A, if the attribute values of the user completing the event A are different, the user will only be classified into the attribute value 1 of the first event A that occurred on January 1 (Note: although the attribute value of the user's event in January to 04 is 3, the user will still be counted in the group of attribute value 1). The user had an initial behavior event A at 01-01, 01-03, 01-04, 01-05, 01-07, respectively. Indicates the retained users of day 1, day 2, day 3, day 4, day 5, and day 7 in the Event A attribute value is 1 group.
3. The user is grouped according to the attributes of subsequent behavior event B. If the attribute values of the user completing event B are different, the user will only be classified into attribute value 2 of the first event B that occurred on January 2. The user had an initial behavior event A at 01-01, 01-03, 01-04, 01-05, 01-07, respectively. It Indicates the retained users of day 1, day 2, day 3, day 4, day 5, and day 7 in the attribute value of Event B is 2 group.
4. Group users by attributes. For example, grouped by gender. If a user is female, the user is retained on day 1, day 2, day 3, day 4, day 5, and day 7 of Attribute Value Female.
4.3. Set association properties
The following table shows the real behavior sequence of a user from January 1, 2015 to January 8, 2015 and the behavior sequence included in the calculation (one attribute value for each of the initial behavior event or subsequent behavior event is reserved on the same day, and the first one is reserved). In the table, letters A and B indicate events, and numbers 1, 2, and 3 indicate the attribute value of an attribute of the user.
Date | Real behavior sequence | Sequence of actions included in the calculation (attribute value 1) | Sequence of actions included in the calculation (attribute value 2) | Sequence of actions included in the calculation (attribute value 3) |
|---|---|---|---|---|
| 01-01 | A1,A2,A2 | A1 | A2 | |
| 01-02 | B2,B1,B1 | B1 | B2 | |
| 01-03 | A3,A1,A1 | A1 | A3 | |
| 01-04 | A1,A3,A3 | A1 | A3 | |
| 01-05 | A1,A3,A3 | A1 | A3 | |
| 01-06 | B1,B2,B1 | B1 | B2 | |
| 01-07 | A1,A2 | A1 | A2 | |
| 01-08 | B2,B1,B3 | B1 | B2 | B3 |
Grouped by attributes of initial behavior event A. If grouped by attribute value 1, only the initial behavior event or subsequent behavior event associated with attribute value 1 will be included in the calculation. The user is the retained user of attribute value 1 on day 1, day 2, day 3, day 4, day 5 and day 7 respectively. If it is grouped by attribute value 2, then the initial behavior event or subsequent behavior event associated with attribute value 2 will be included in the calculation, and the user is the retained user on day 1, day 5 and day 7 of attribute value 2 respectively. Similarly, the user is retained on day 3, day 4, and day 5 of attribute value 3.
4.4. The meaning of the filter
Like other analytics functions, retention analytics also provides filtering functions. Filters for retention analysis provides two different types of filtering.
Filter on user attributes: For example, if the filter condition we add is "gender" is "male", only the users whose "gender" is "male" in the attribute can meet this filter condition and appear in the retention analysis result after screening;
Filter of event attributes: The meaning of the trigger restriction is the same as that of the funnel. The specified event meets the filtering of the specified attribute.
4.5. Meaning of grouping
Retention analysis provides two different types of grouping. Let's elaborate with an initial action A, subsequent action B, and a time frame of 7 days from January 1 to January 8, 2015:
Grouping on user attributes: Further grouping based on user attributes. For example, the grouping condition we added is "gender", then the results of retention analysis will be grouped according to "male" and "female".
Grouping of event attributes: For example, the group setting we select is the attribute "screen height" of the initial behavior, then this group means that in the time range from January 1 to January 15, 2015, they are grouped according to the value of the attribute "screen height" of the initial behavior; Here are some specific examples:
The behavior sequence of A user in this period is A, B, C, A, B. The "screen height" value of the first occurrence of A is "320", and the "screen height" value of the second occurrence of A is "1080", because the first occurrence of A event is grouped according to the "screen height". Therefore, this user will be divided into the "320" group statistics;
The behavior sequence of A user in this time period is A and A, and the user has no subsequent behavior after the initial behavior A event. The "screen height" value of the first occurrence of A is "1080", and the "screen height" value of the second occurrence of A is "320". Because the user is grouped according to the "screen height" of the first occurrence of A event, this user will be divided into the statistical result of the "1080" group.
5. FAQ
5.1. Why do retention analysis? Looking at the percentage of active users is not enough?
Retention analysis grouped by initial behavior time can eliminate the impact of user growth on user engagement data. If the product is currently in a phase of rapid growth, it is likely that the increase in active users among new users is masking changes in the activity of regular users. With retention analytics, you can segment users by sign-up time and come up with something like this: "Before the March change, only 15% of users who signed up that month had 7-day retention; But after the April update, the 7-day retention rate for users who signed up that month increased to 20%." Similarly, retention analysis in terms of non-time dimensions has similar value, for example, to see if a new feature has a different effect on the retention of users of different genders after launch. When we analyze user retention, we must find valuable follow-up behaviors according to actual business needs, and analyze user value retention, so as to provide substantive guidance and suggestions for product optimization and improvement.
Note: The content of this document is a technical document that provides details on how to use the Sensors product and does not include sales terms; the specific content of enterprise procurement products and technical services shall be subject to the commercial procurement contract.
 Popular Searches