Session analysis
|
Collect
1. Video version explanation
Session Analysis explanation video
2. Session Analysis Overview
Session analysis is a session-based analysis that connects the behaviors of users that occur at a single point into a whole for analysis. Based on Session analysis, you can collect statistics on the overall access depth of users in the product and the access information of some special nodes.
In Sensors Analysis version 2.4, the Session analysis entry is: Sensors Analysis→Analysis→Session Analysis.
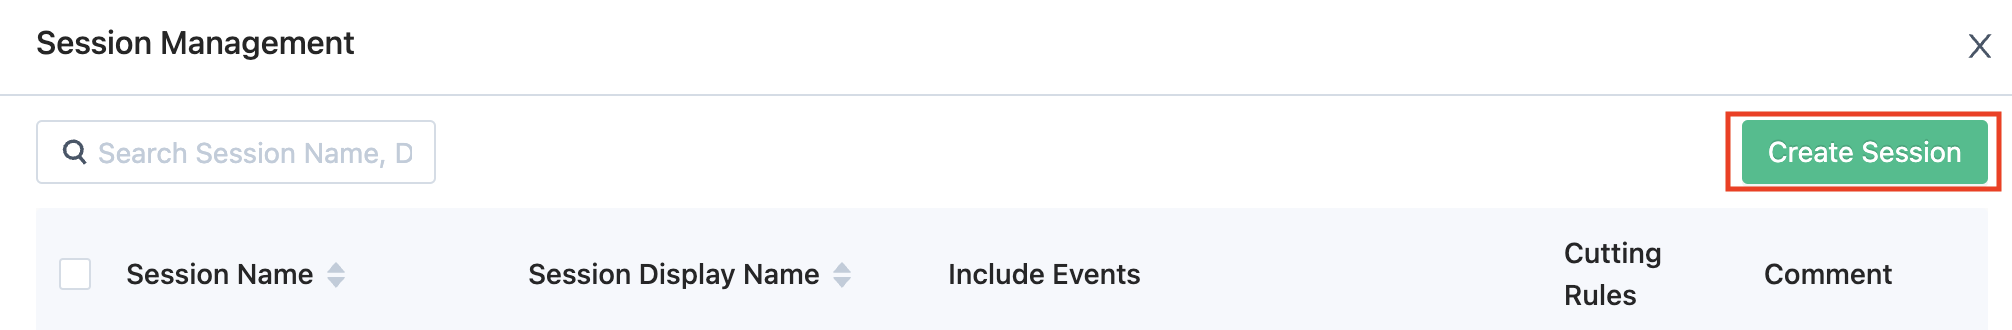
2.1. Before performing Session analysis for the first time, you need to create a Session
To create a Session, you need to fill in the basic information, behavior events contained in the Session, and Session cutting rules.
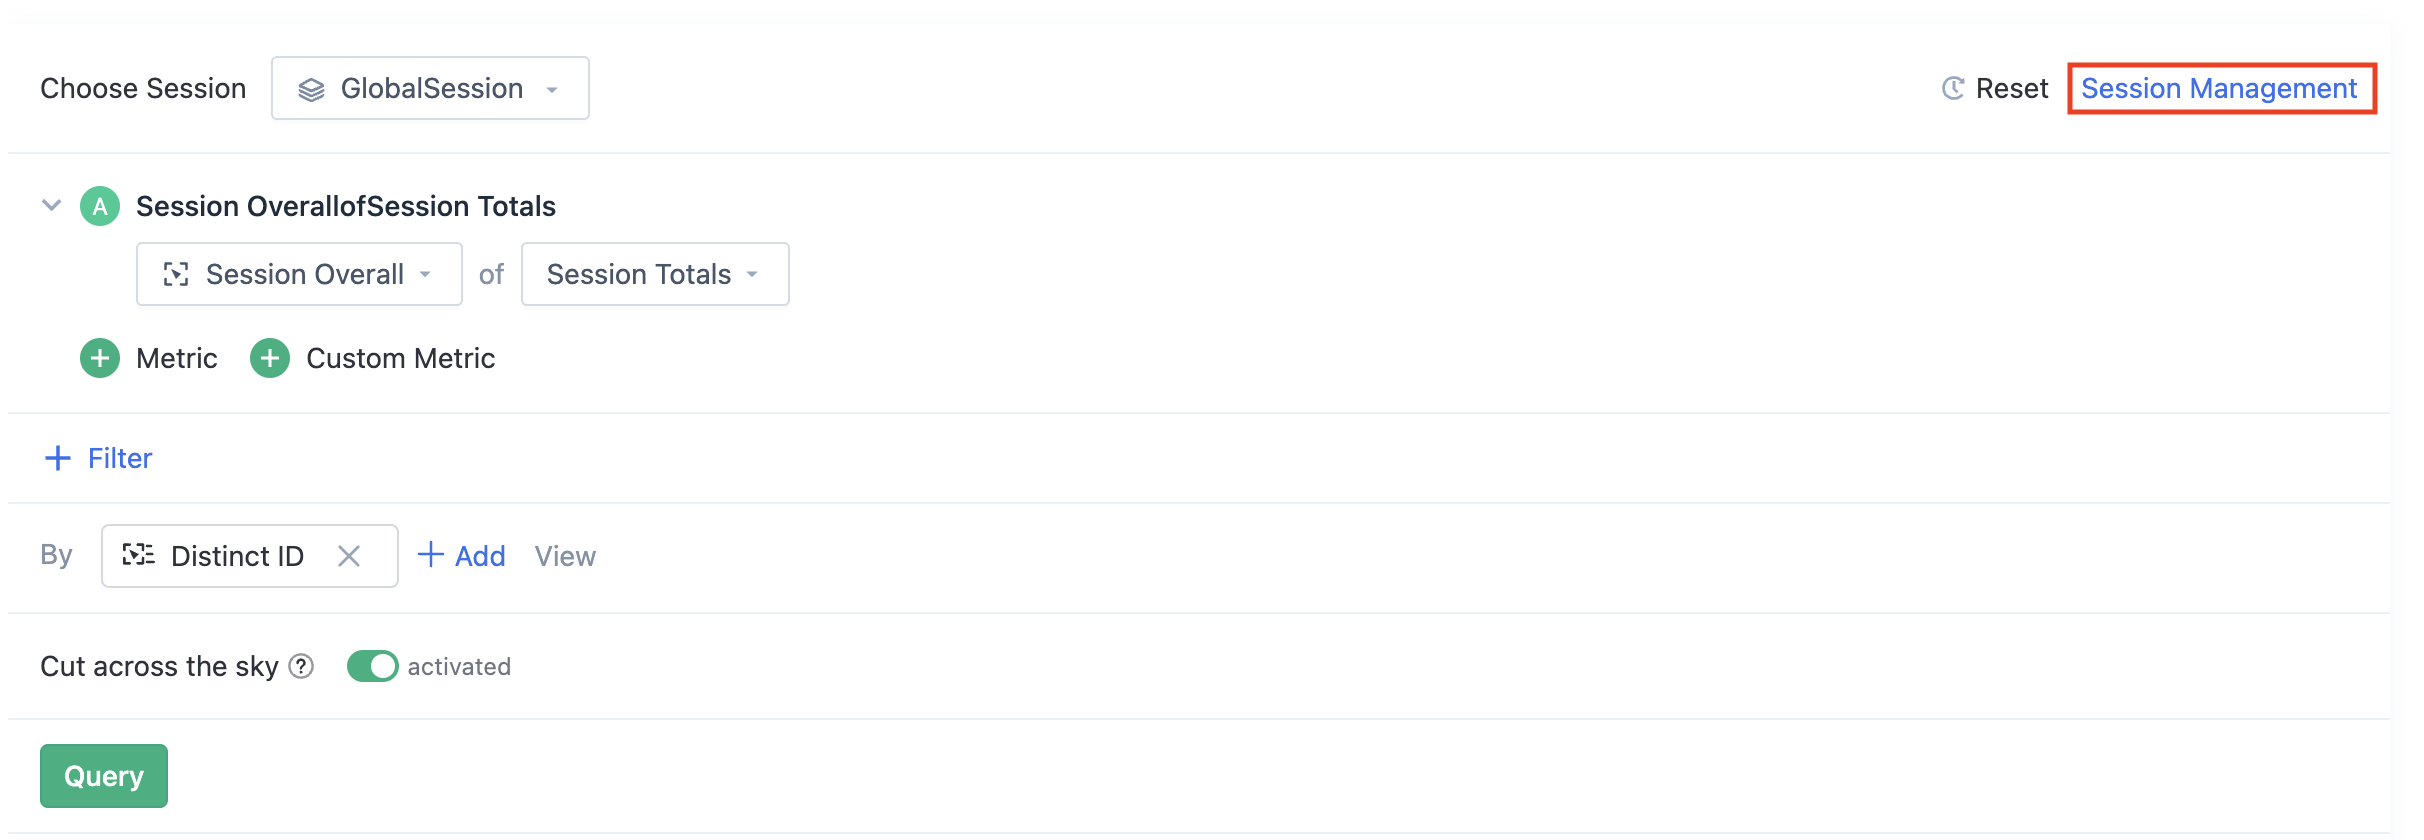
Session Management Resident entry:
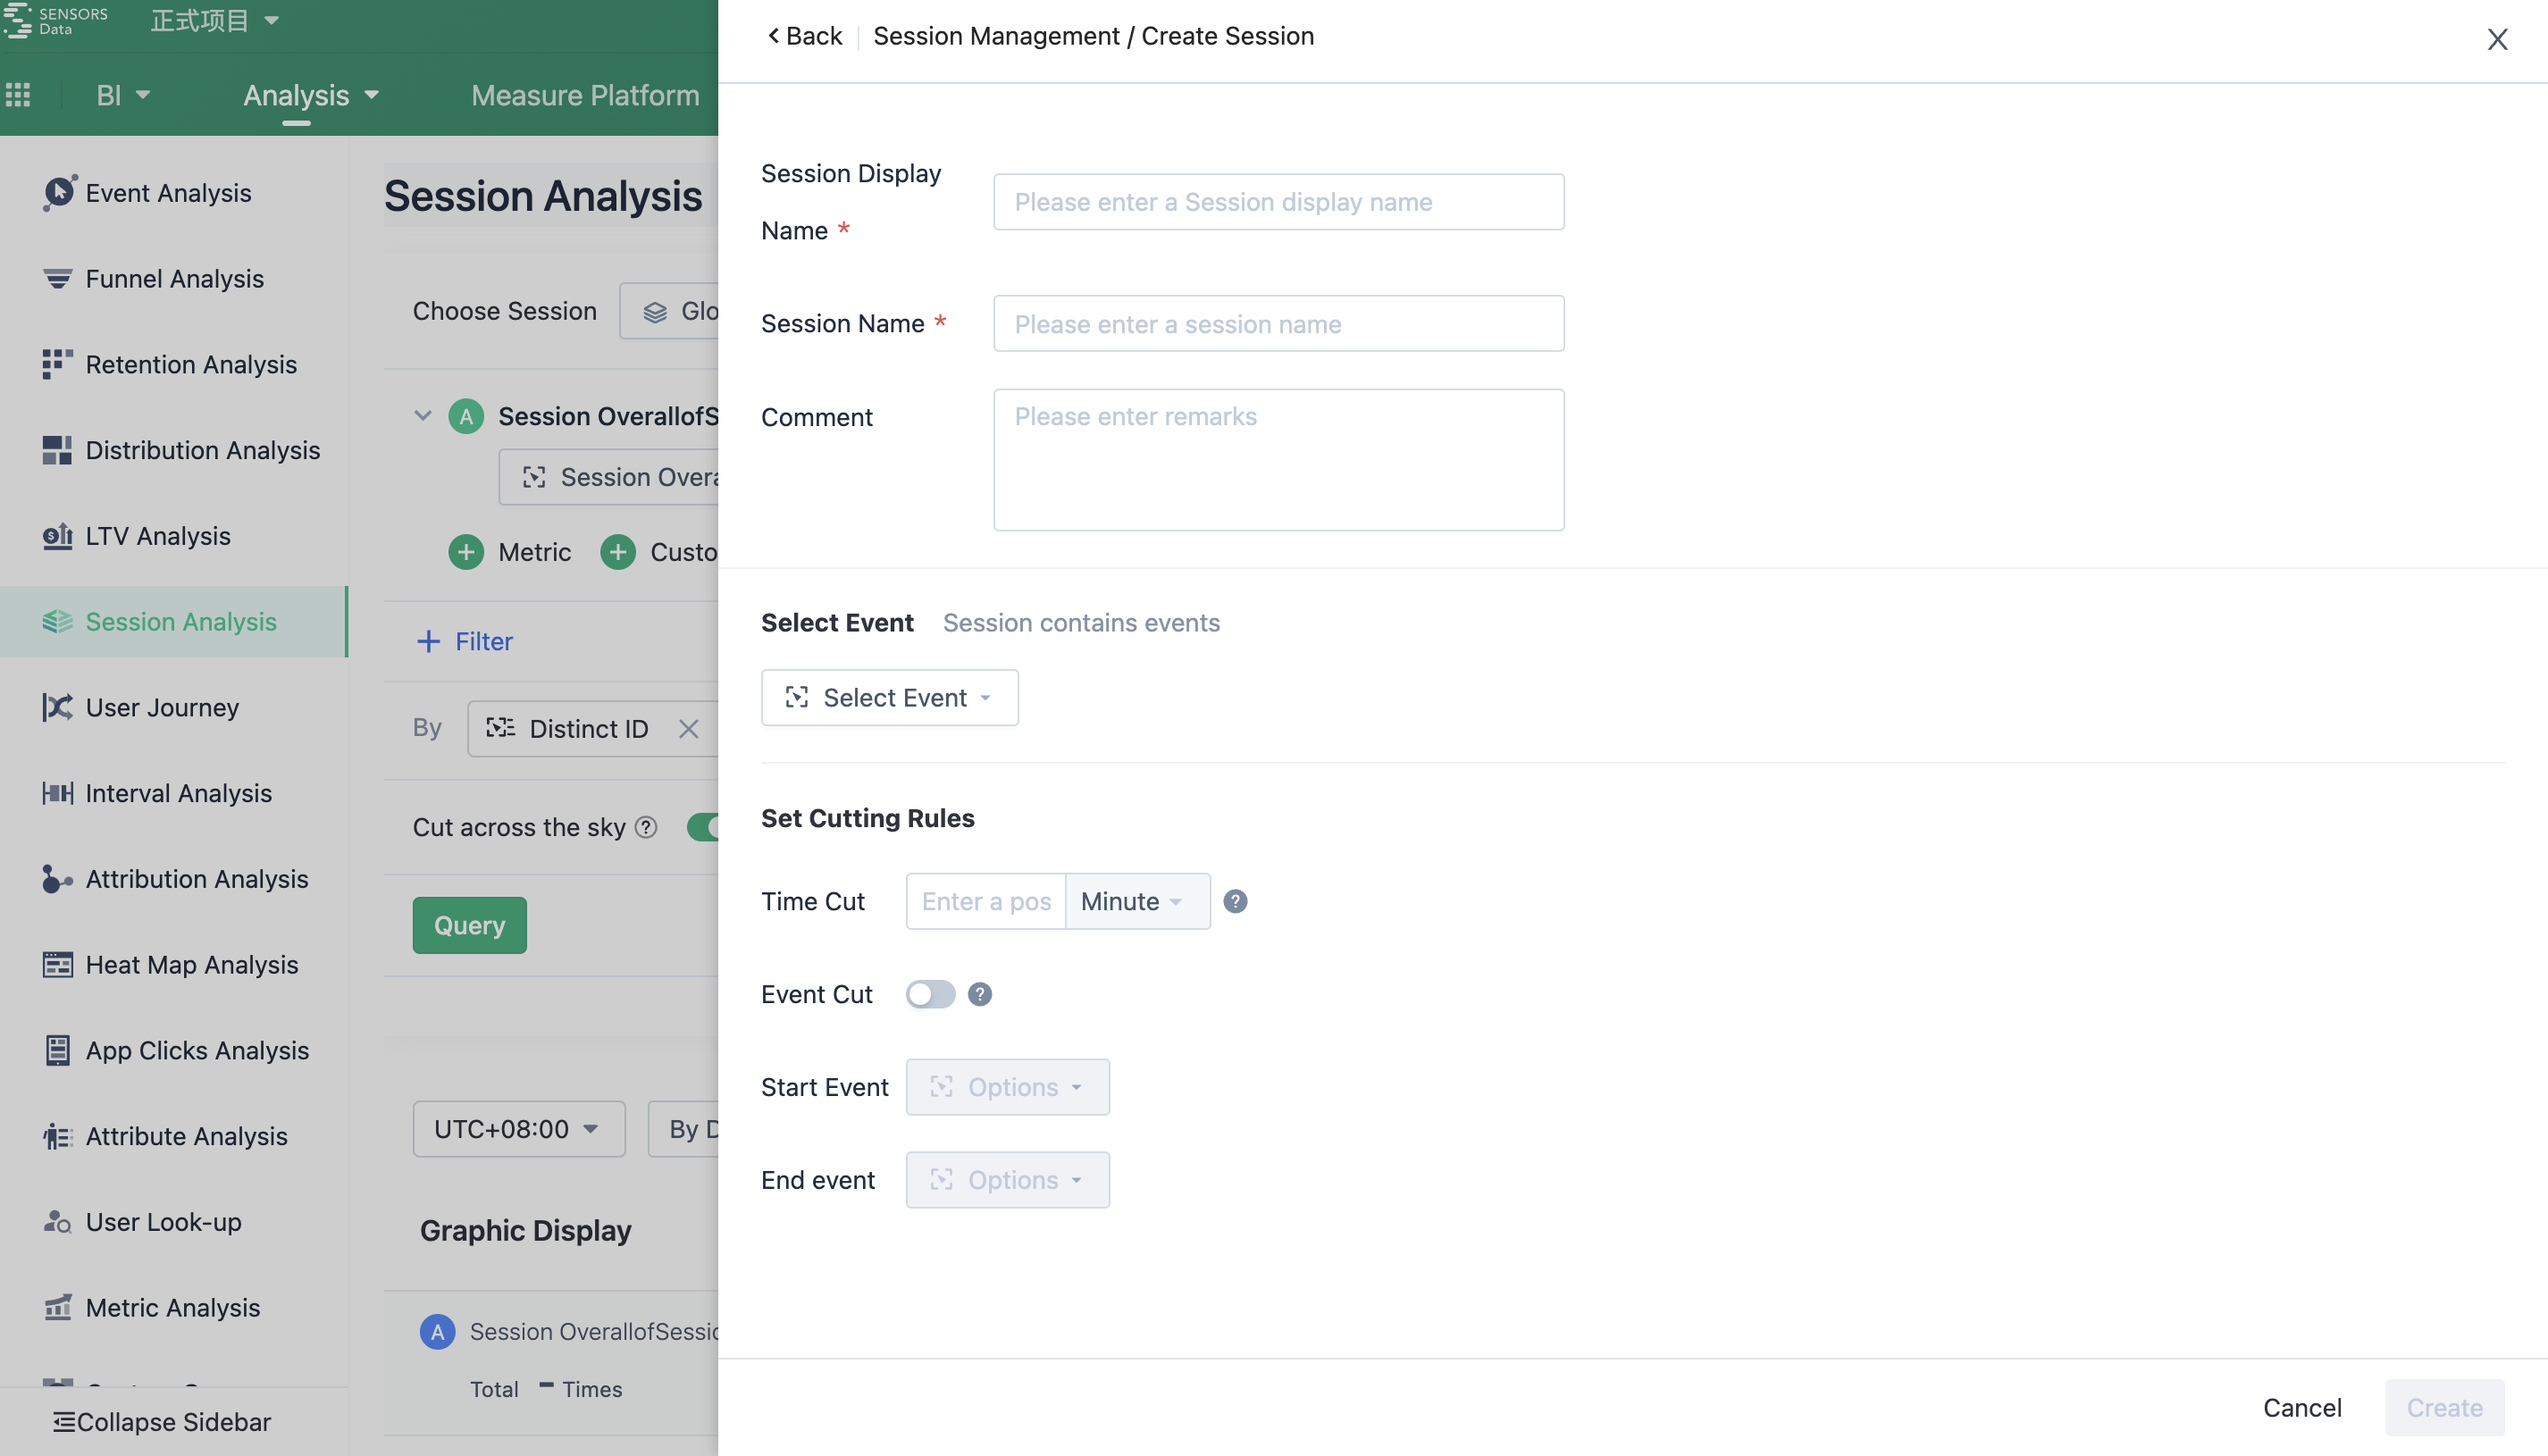
2.2. Session cutting method
2.2.1. Time cutting
Time cutting means that a time cutting is performed when the time interval between adjacent events is longer than this time.
2.2.2. Start event and end event cutting
On the basis of cutting by interval, session cutting can be performed using specified start events and end events. The start event is optional, while the end event is mandatory.
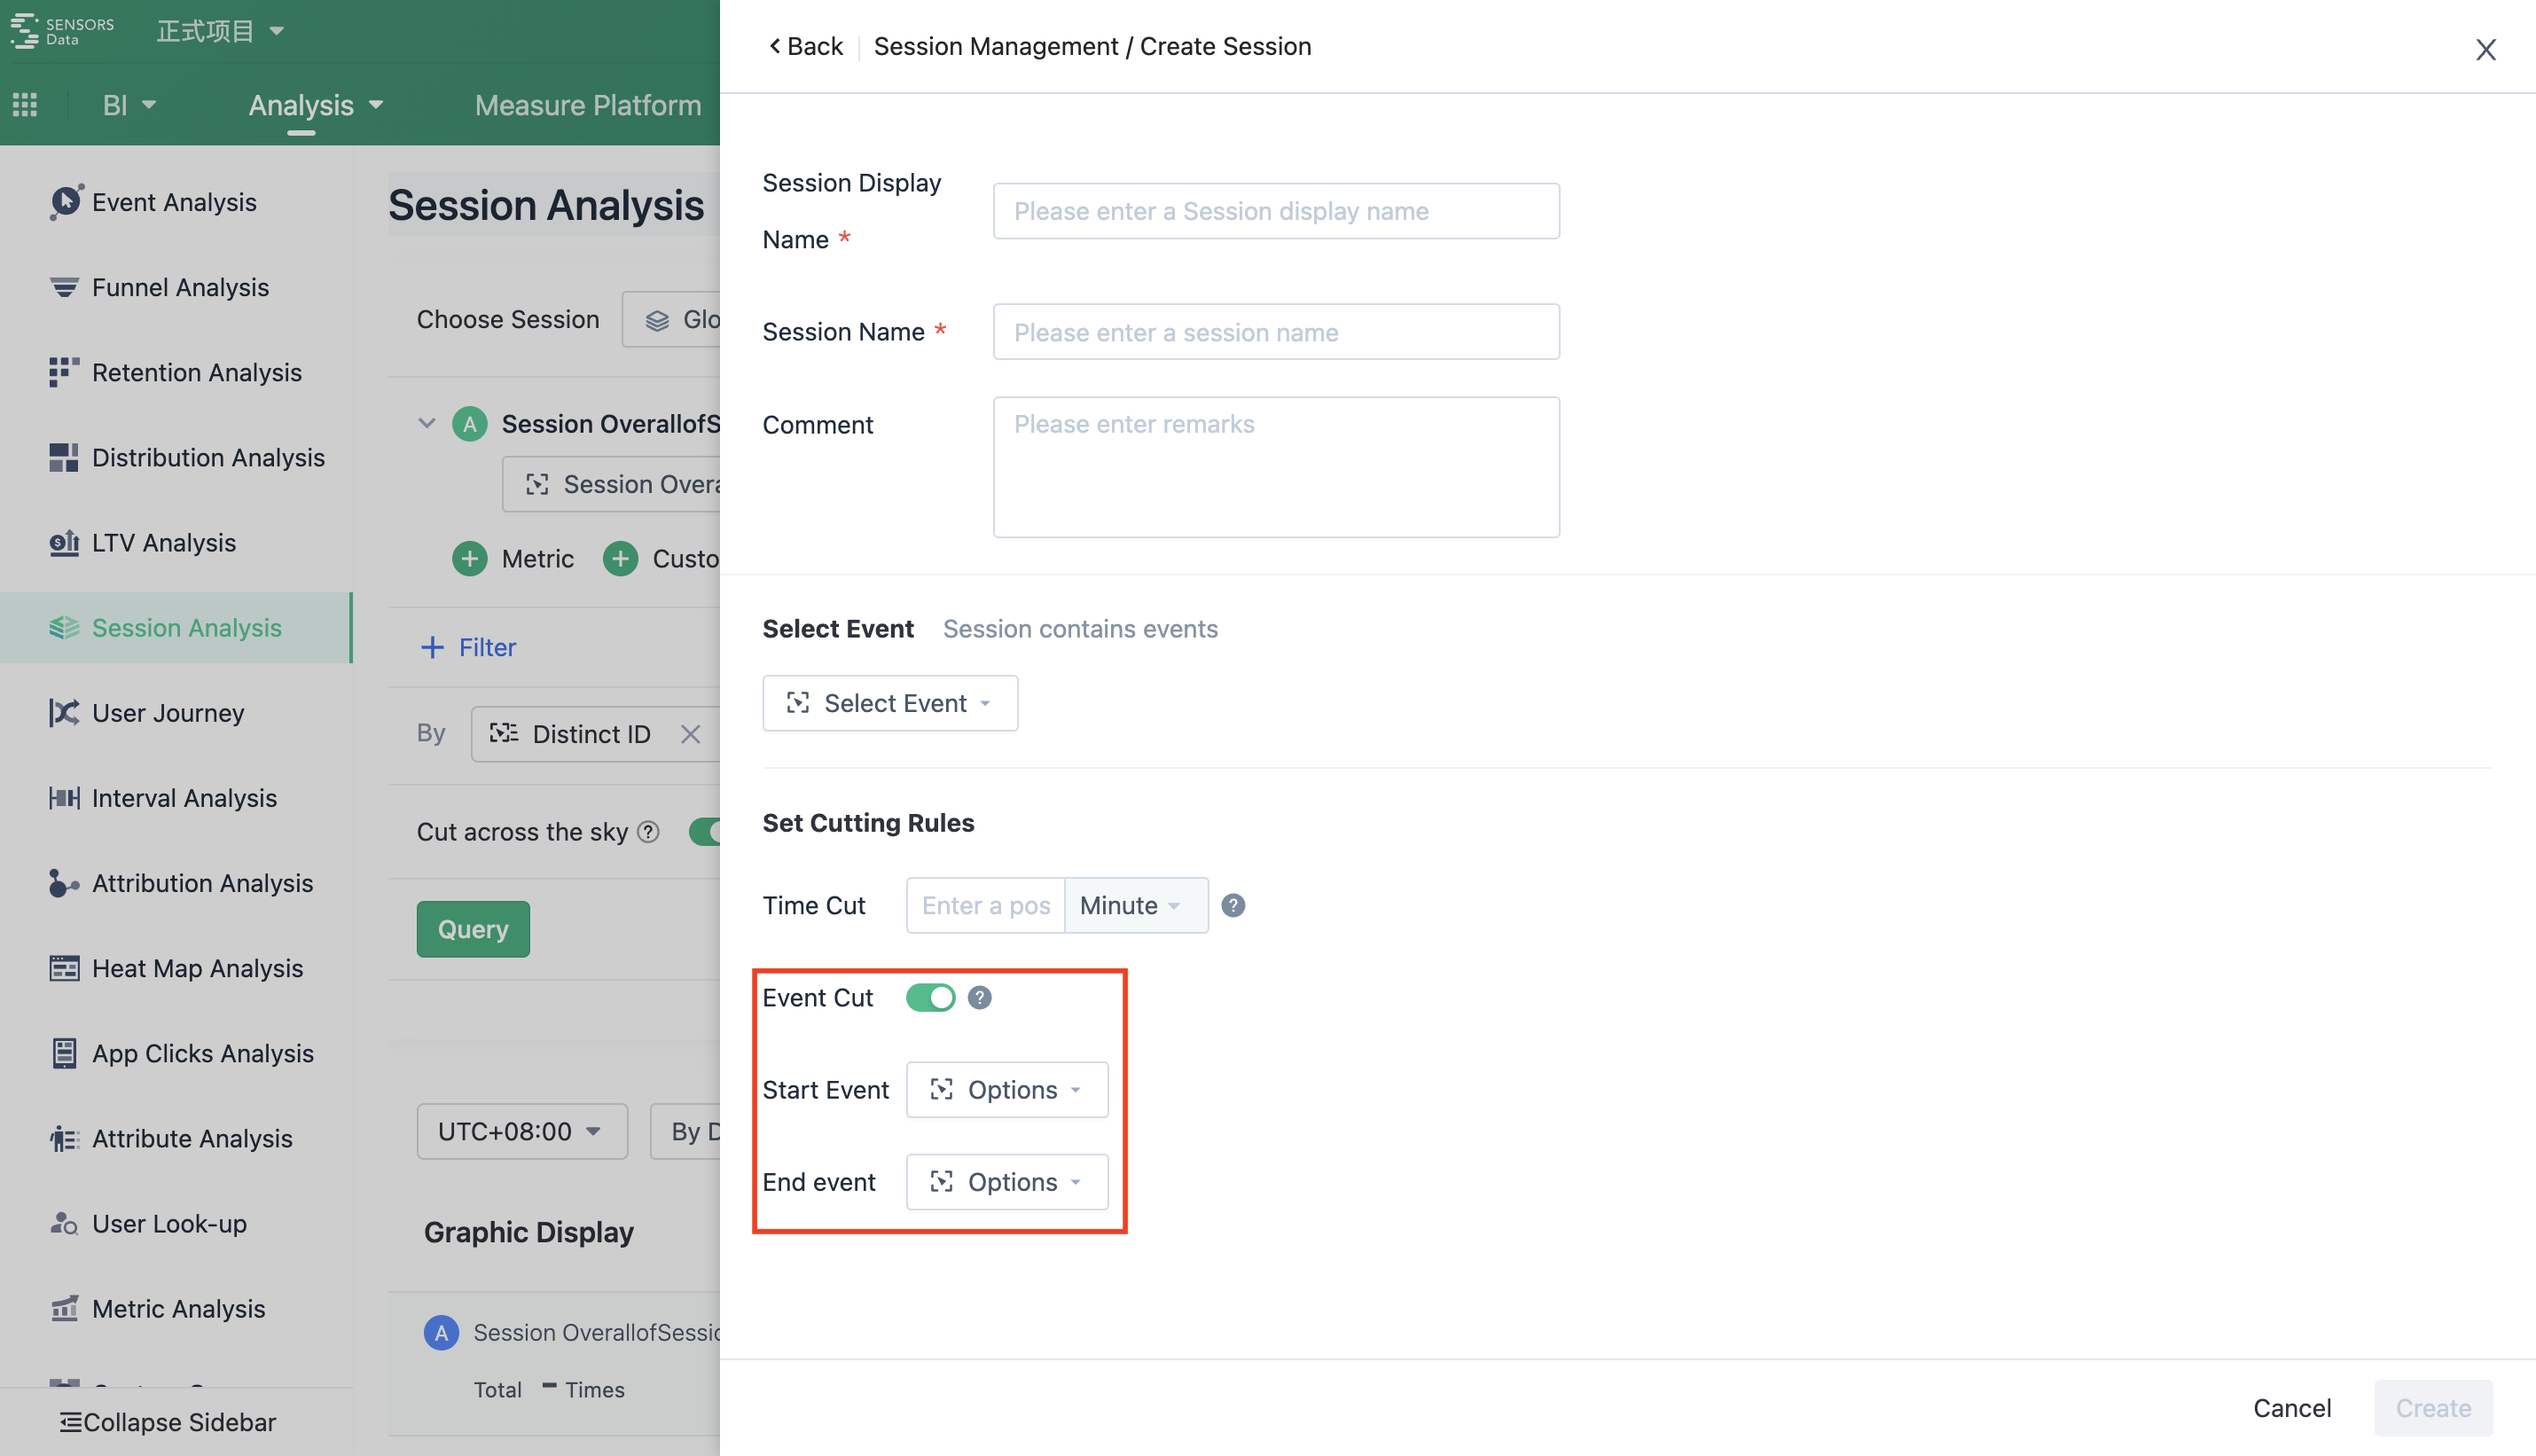
2.2.2.1. Start event, end event cutting usage scenario
When we have clear definitions of start and end events for our sessions, we can use start and end to make the sessions we cut out more in line with expectations.
For example:
- There are clear "start playing" and "end playing" in the video industry
- There are clear "APP startup" and "APP quit" on the mobile end.
- In a conversion path, the "home page" is considered to be a starting point, and the occurrence of "payment" is a sign of the end
2.2.2.2. Cut by start event and end eventHow is it achieved
Step 1: Sequence the user's behavior in order of occurrence time from far to near.
Step 2: Take the first behavior as a starting point and match backwards.
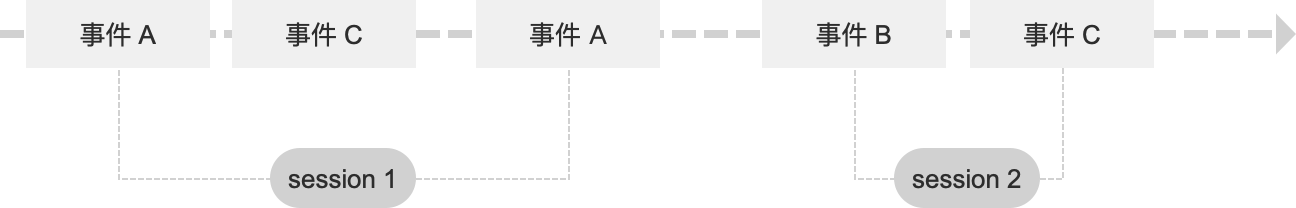
If a "start event" is matched, the session is automatically terminated. This "start event" is used as a starting point to match the second Session
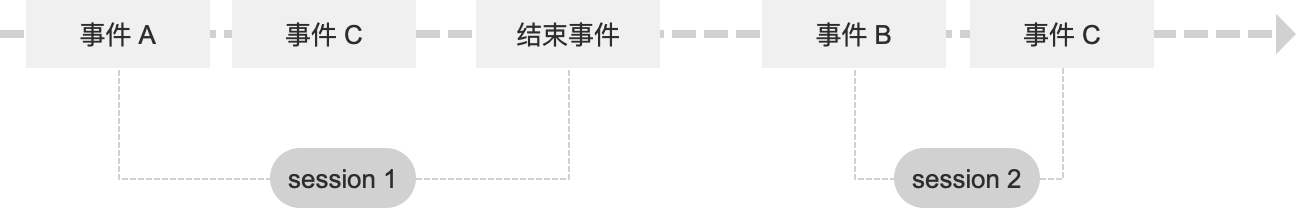
If an "end event" is matched: this "end event" is added to the current session. The next event of the End event is used as the starting point to match the second session
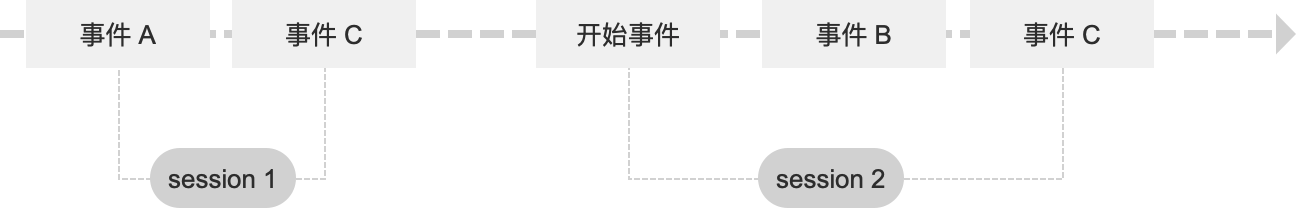
If no events are matched during the cut time:The system automatically cuts the session according to the set session cutting time.The following events are used as a starting point for matching the second session
2.3. Rules for calculating Session indicators
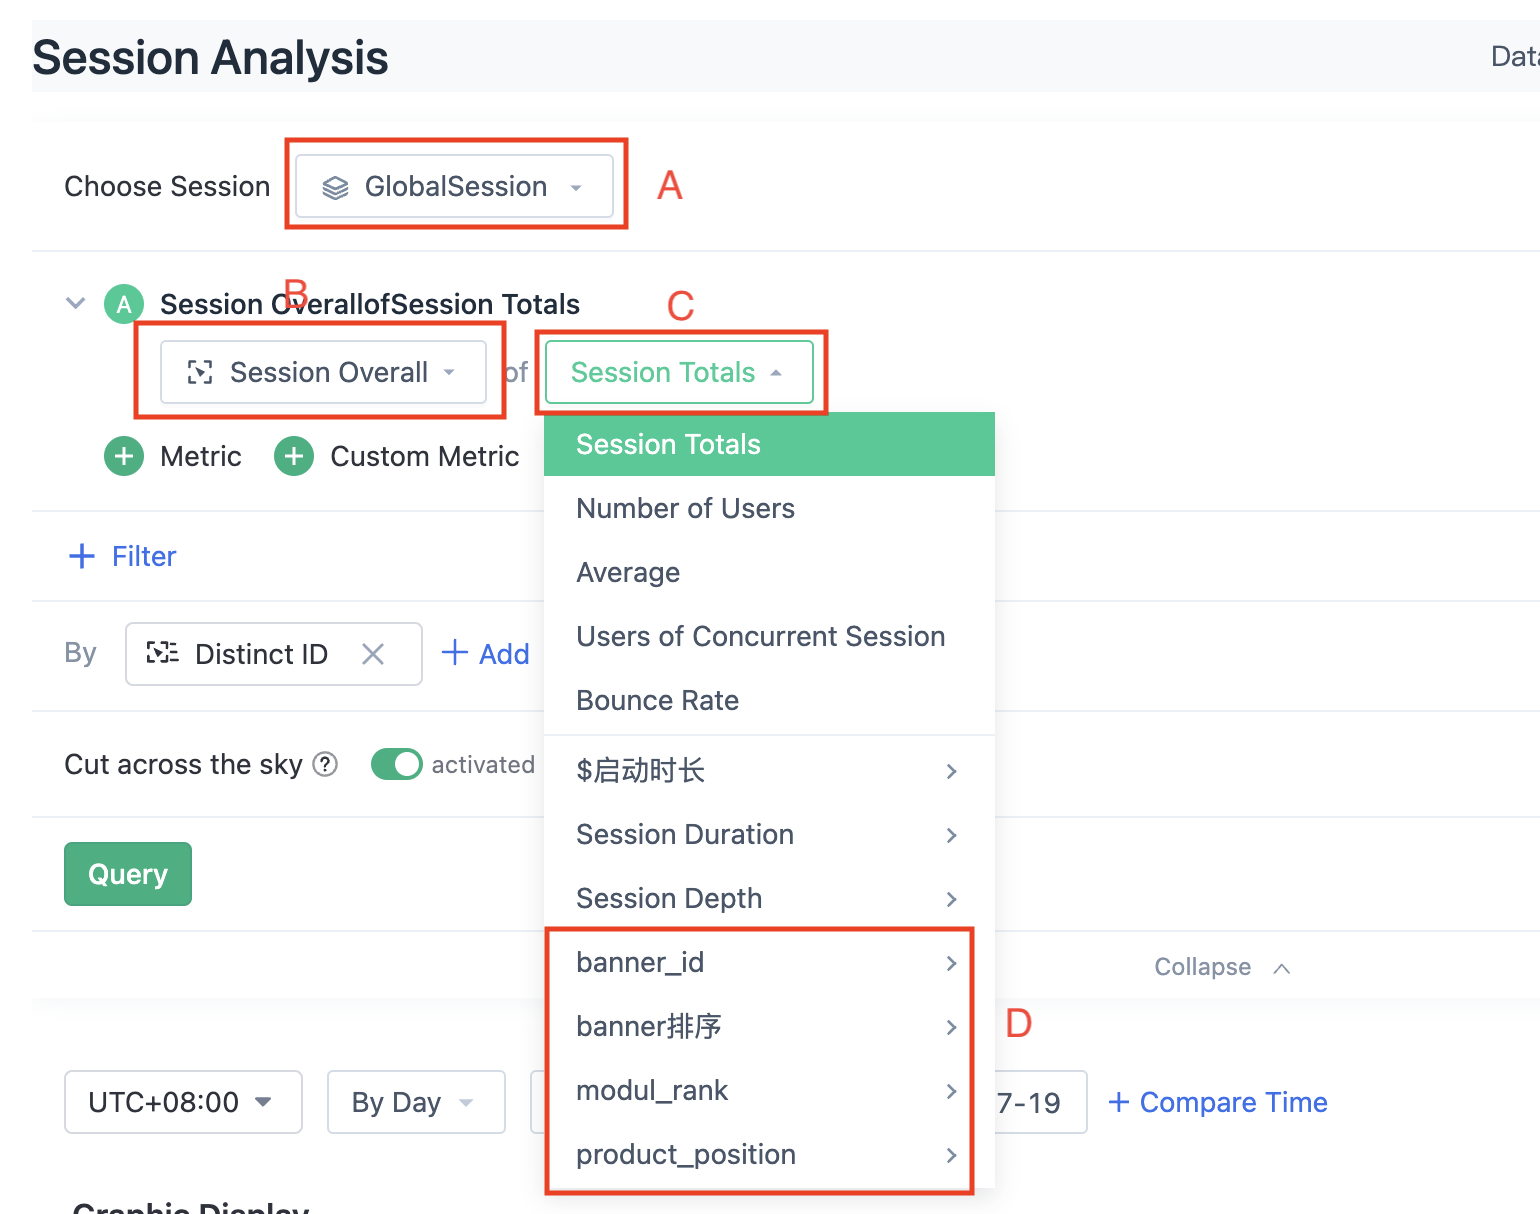
- Select an existing Session at A.
- Select the events in this Session at B, and select Session Totals to analyze the overall situation of the Session. Select Specific Event in a Session to analyze the event itself.
- Select different types of events at B, then the corresponding indicators in C will also change, in addition to some general indicators, but also contains the attributes of the selected event indicators at B.
- Circled in red at D is"Session attribute", a union of the properties of the initial event within each Session. Session primary event indicates the event triggered for the first time in a Session. For example, the sequence of events of A Session is A,B,C; If the operating system of the event A is iOS, the operating system of the event B is Android, and the operating system of the event C is empty, the operating system of the Session attribute in this Session is iOS, which is the operating system attribute value corresponding to the first event.
The following are the main indicators to explain:
1. For "a specific event in a Session"
- exit rate The exit rate of a Session includes the exit rate of a certain event and any event in the Session. The exit rate of an event is the number of times that the event serves as the end event of a Session divided by the number of times that the event occurs. The exit rate of any event is the number of sessions divided by the number of times that all events occur in a Session. For example, there are three sessions, and the first Session event sequence is A,B; The second Session event sequence is A; The third Session event sequence is A,C,A; The exit rate of A events and any events in the Session is 2/4 and 3/6.
- Session event duration: For example, events in a Session are triggered in a > sequence. b > c > d, the duration of event a is b minus a, and the duration of event d is unknown.
- Number of Session events: When analyzing specific events in a Session, you can count the number of events that occur in a Session
2. For "Session Totals" :
- bounce rate: The number of sessions in which only one event occurred divided by the total number of sessions. For example, there are three sessions, and the first Session event sequence is A,B; The second Session event sequence is A; The third Session event sequence is A,C,B; The overall bounce rate of the Session is 1/3.
- Session duration: Time when the last event is triggered in a Session minus the time when the first event is triggered in a Session.
- Session depth: Number of times that events were triggered within the Session.
- Concurrent number: When analyzing sessions totals, you can use the number of concurrent sessions to calculate the number of concurrent sessions at this point in time. We consider a session to be a sustained period of time, so when calculating the number of concurrent people, we can judge how many sessions are online at that point in time.
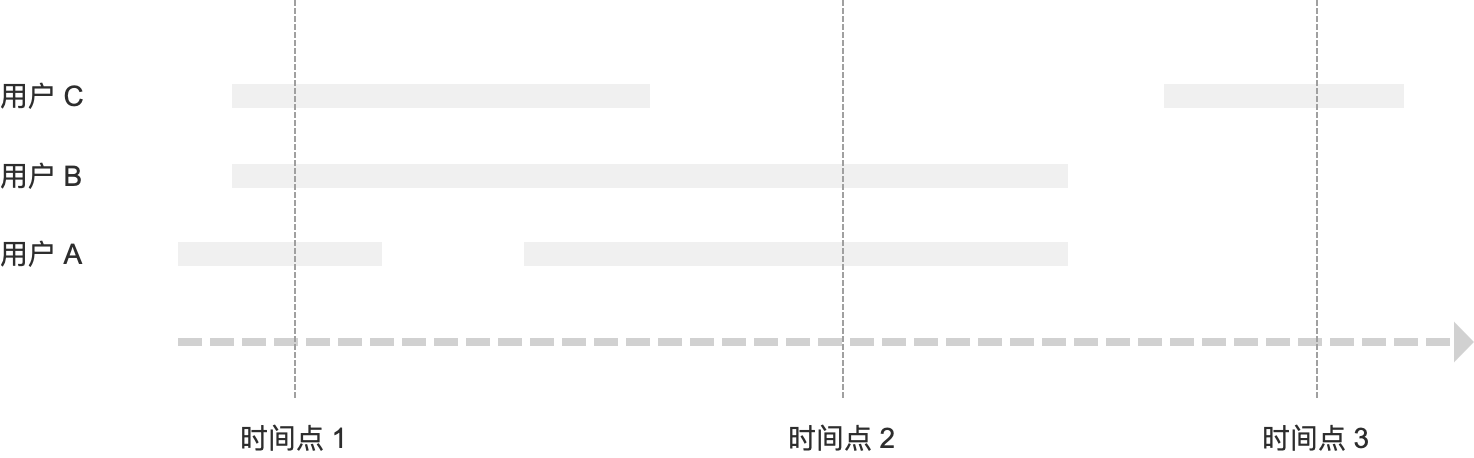
As shown in the figure
- The number of concurrent online users at point 1 is 3
- The number of concurrent online users at point 2 is 2
- The number of concurrent online users at point 3 is 1
In the scenario where the event is a persistent behavior, the number of concurrent events is more significant than the number of events.
Let's take an example:
- A video APP, every time there are users continue to enter and exit.
- When we do some online activities, we want to be in the user Online time is the most intensive moment of the activity is pushed.
- So how do we determine when the most users are online?
Let's look at the conclusion of the simulation data:
| User | start time | end time | Start time View indicators | View metrics online at the same time |
|---|---|---|---|---|
| A | 19:01 | 20:14 | 19:00-19:30 —— 3 people 19:30-20:00 —— 1 person 20:00-20:30 —— 2 people 20:30-21:00 —— 0 person In the end, it was concluded that we were19:00-19:30 It works best when it is placed during the period | 19:00-19:30 —— 3 people 19:30-20:00 —— 4 people 20:00-20:30 —— 6 people 20:30-21:00 —— 2 people In the end, it was concluded that we were20:00-20:30 It works best when it is placed during the period |
| B | 19:14 | 20:14 | ||
| C | 19:29 | 20:14 | ||
| D | 19:59 | 20:14 | ||
| E | 20:14 | 21:01 | ||
| F | 20:29 | 22:01 |
In fact, our users are the most online between 20:00 and 20:30, when operational activities are most effective.
If you want to learn more about Session definition, use and more, you can read the Sensorsdata blog post《How to Use Sensors Analytics for Session Analysis》.
Note: The content of this document is a technical document that provides details on how to use the Sensors product and does not include sales terms; the specific content of enterprise procurement products and technical services shall be subject to the commercial procurement contract.
 Popular Searches