User Journey Analysis
|
Collect
1. Video Explanation
2. User Journey Analysis Overview
User Journey Analysis is mainly used to analyze the distribution of user paths in product use.
For example, after a user visits an e-commerce product homepage, what percentage of users perform a search, what percentage of users visit a category page, and what percentage of users directly visit the product detail page.
3. Introduction to User Journey Analysis Interface
Click on "User Journey" in the left function bar to enter the User Journey Analysis interface.
3.1. Set query conditions
3.1.1. Add analysis event
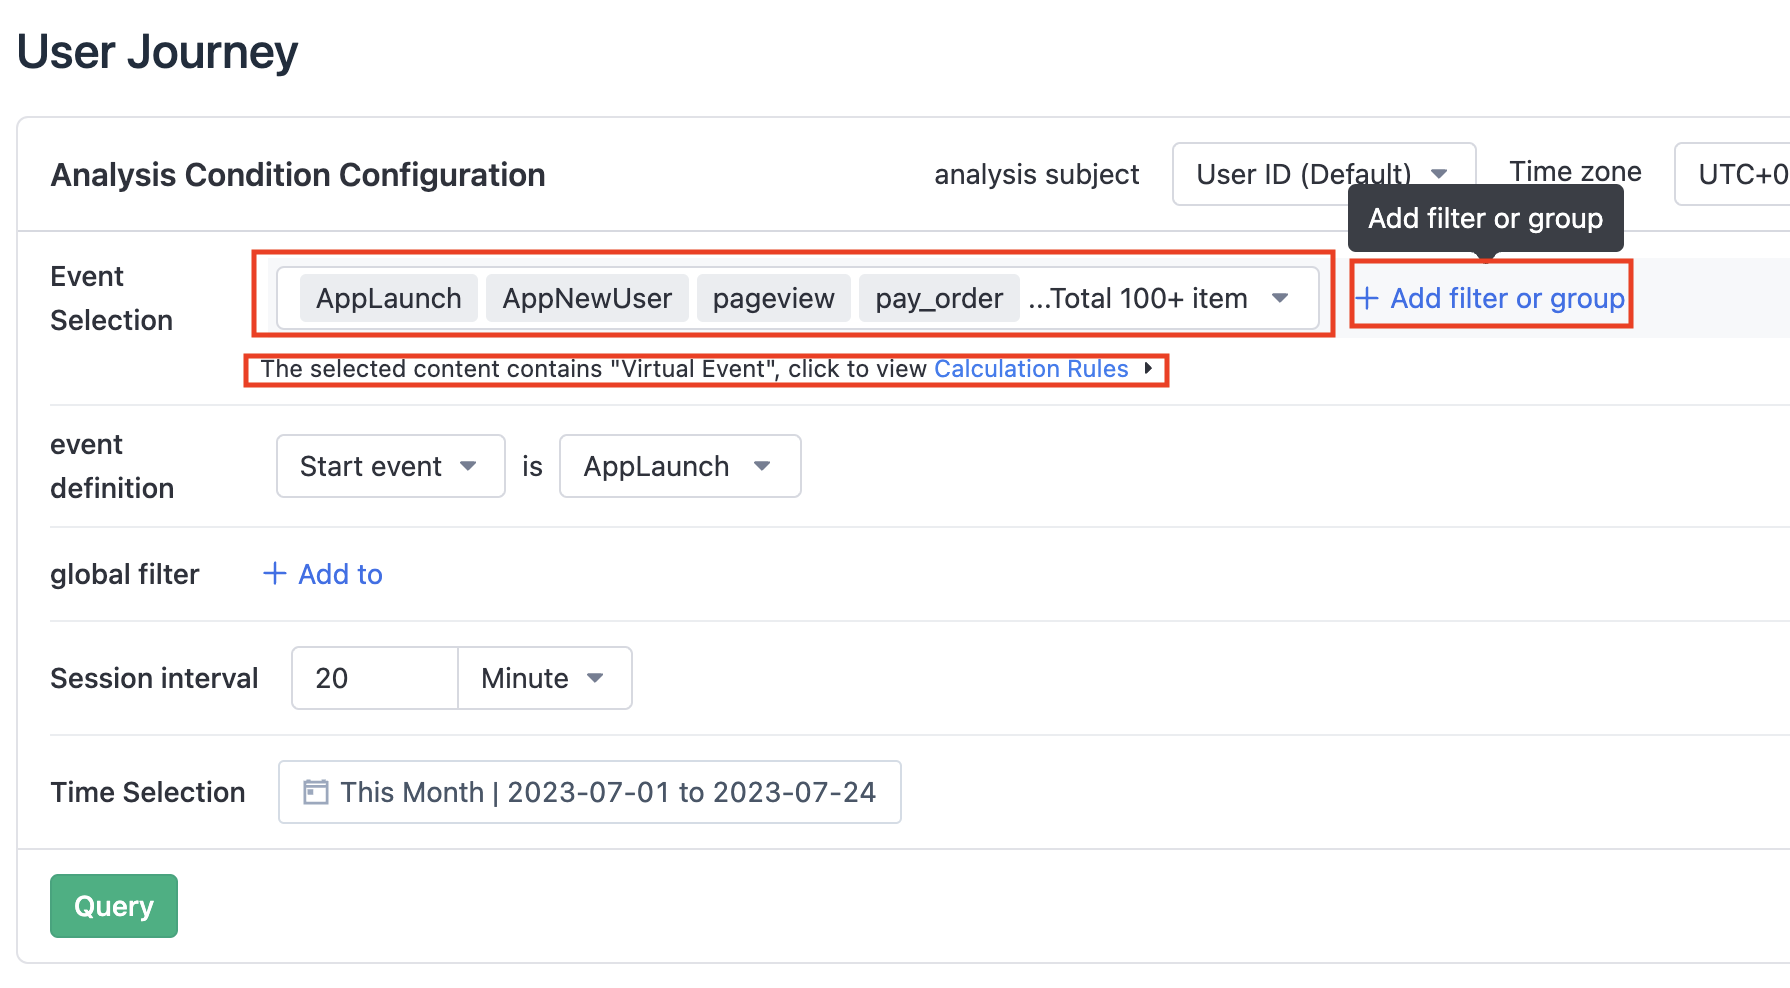
Click the drop-down button to select the event to be analyzed, and click the "add filter or group" on the right to add filter conditions or grouping for each event. Currently, only one event can have up to one group. If the selected content includes virtual events, the virtual events in the analysis result will be calculated as a whole stream.
If the selected analysis event includes certain "virtual events" and the selected "elemental event" has overlapping or complete inclusion conditions, or multiple "virtual events" use the same elemental event, then we will use this strategy as the basis for priority stream calculation.
- If a virtual event is selected for the participating event, it will be displayed directly as a virtual event.
- If the virtual event and its included elemental event are both in the participating event, the elemental event will be attributed according to the priority of (start event, virtual event, elemental event).
- If multiple virtual events contain the same elemental event, the elemental event will be attributed to the first virtual event in the order of the event selection list.
3.1.2. Set start or end event
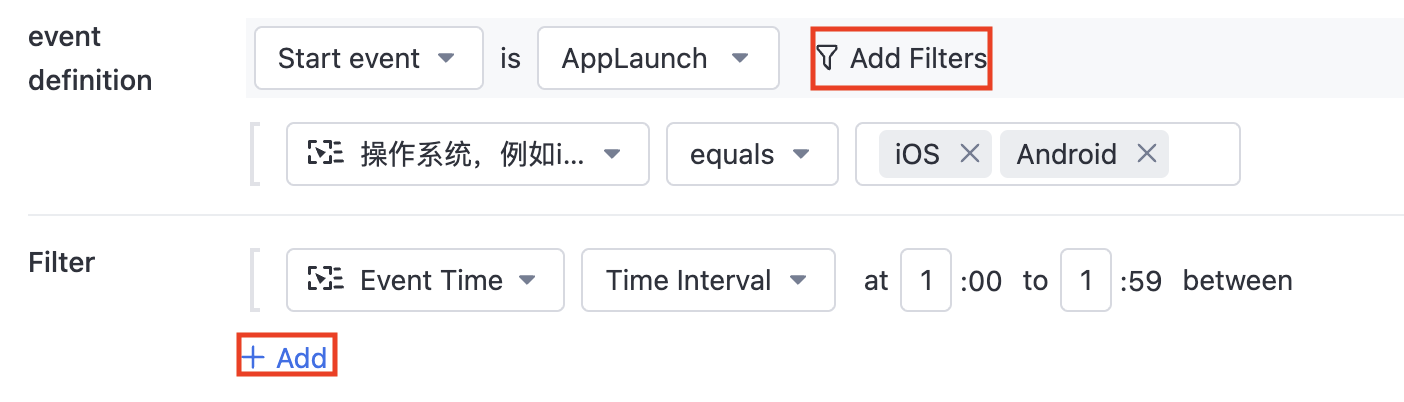
You can set a certain event in the selected event group as the start or end event to be analyzed. Click "add filter" on the right to add filter conditions for this event. Click "+add" at the bottom to add filter conditions for users.
3.1.3. Set session interval

The required item. Optional units are "seconds", "minutes", and "hours".
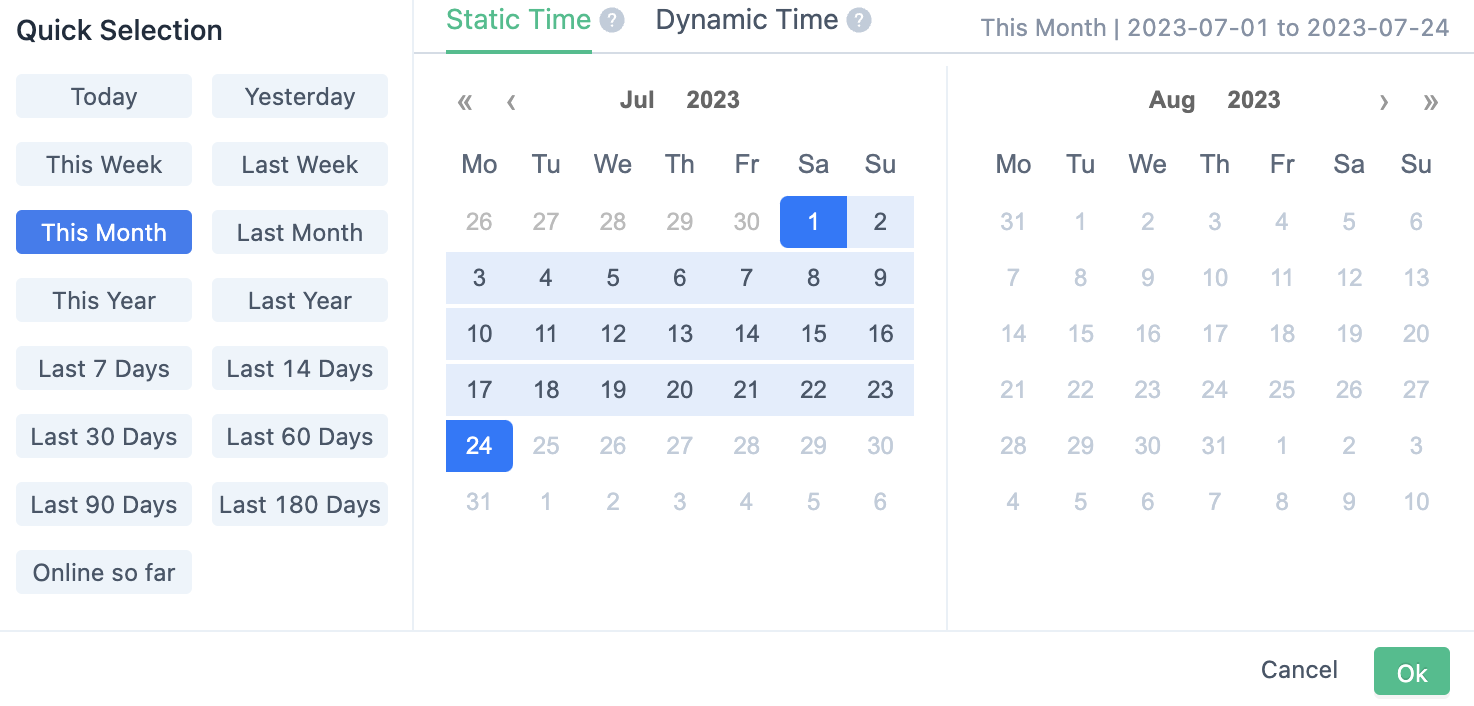
3.1.4. Set time range
Set the time range to be analyzed, which means that the events to be analyzed all occur within the time range, and then the users and events are analyzed. Supports relative time and absolute time.
3.2. Query
After the user sets up the above query conditions, click the "Query" button to get the result.
3.3. Supports result routing based on virtual events.
- If a virtual event is selected as a participating event, it will be displayed directly as a virtual event.
- If the virtual event and its contained meta events are both in the participating event, the meta event will be attributed according to the (start event, virtual event, meta event) priority.
- If multiple virtual events contain the same meta events, then the meta event will be attributed to the first virtual event in the event selection list.
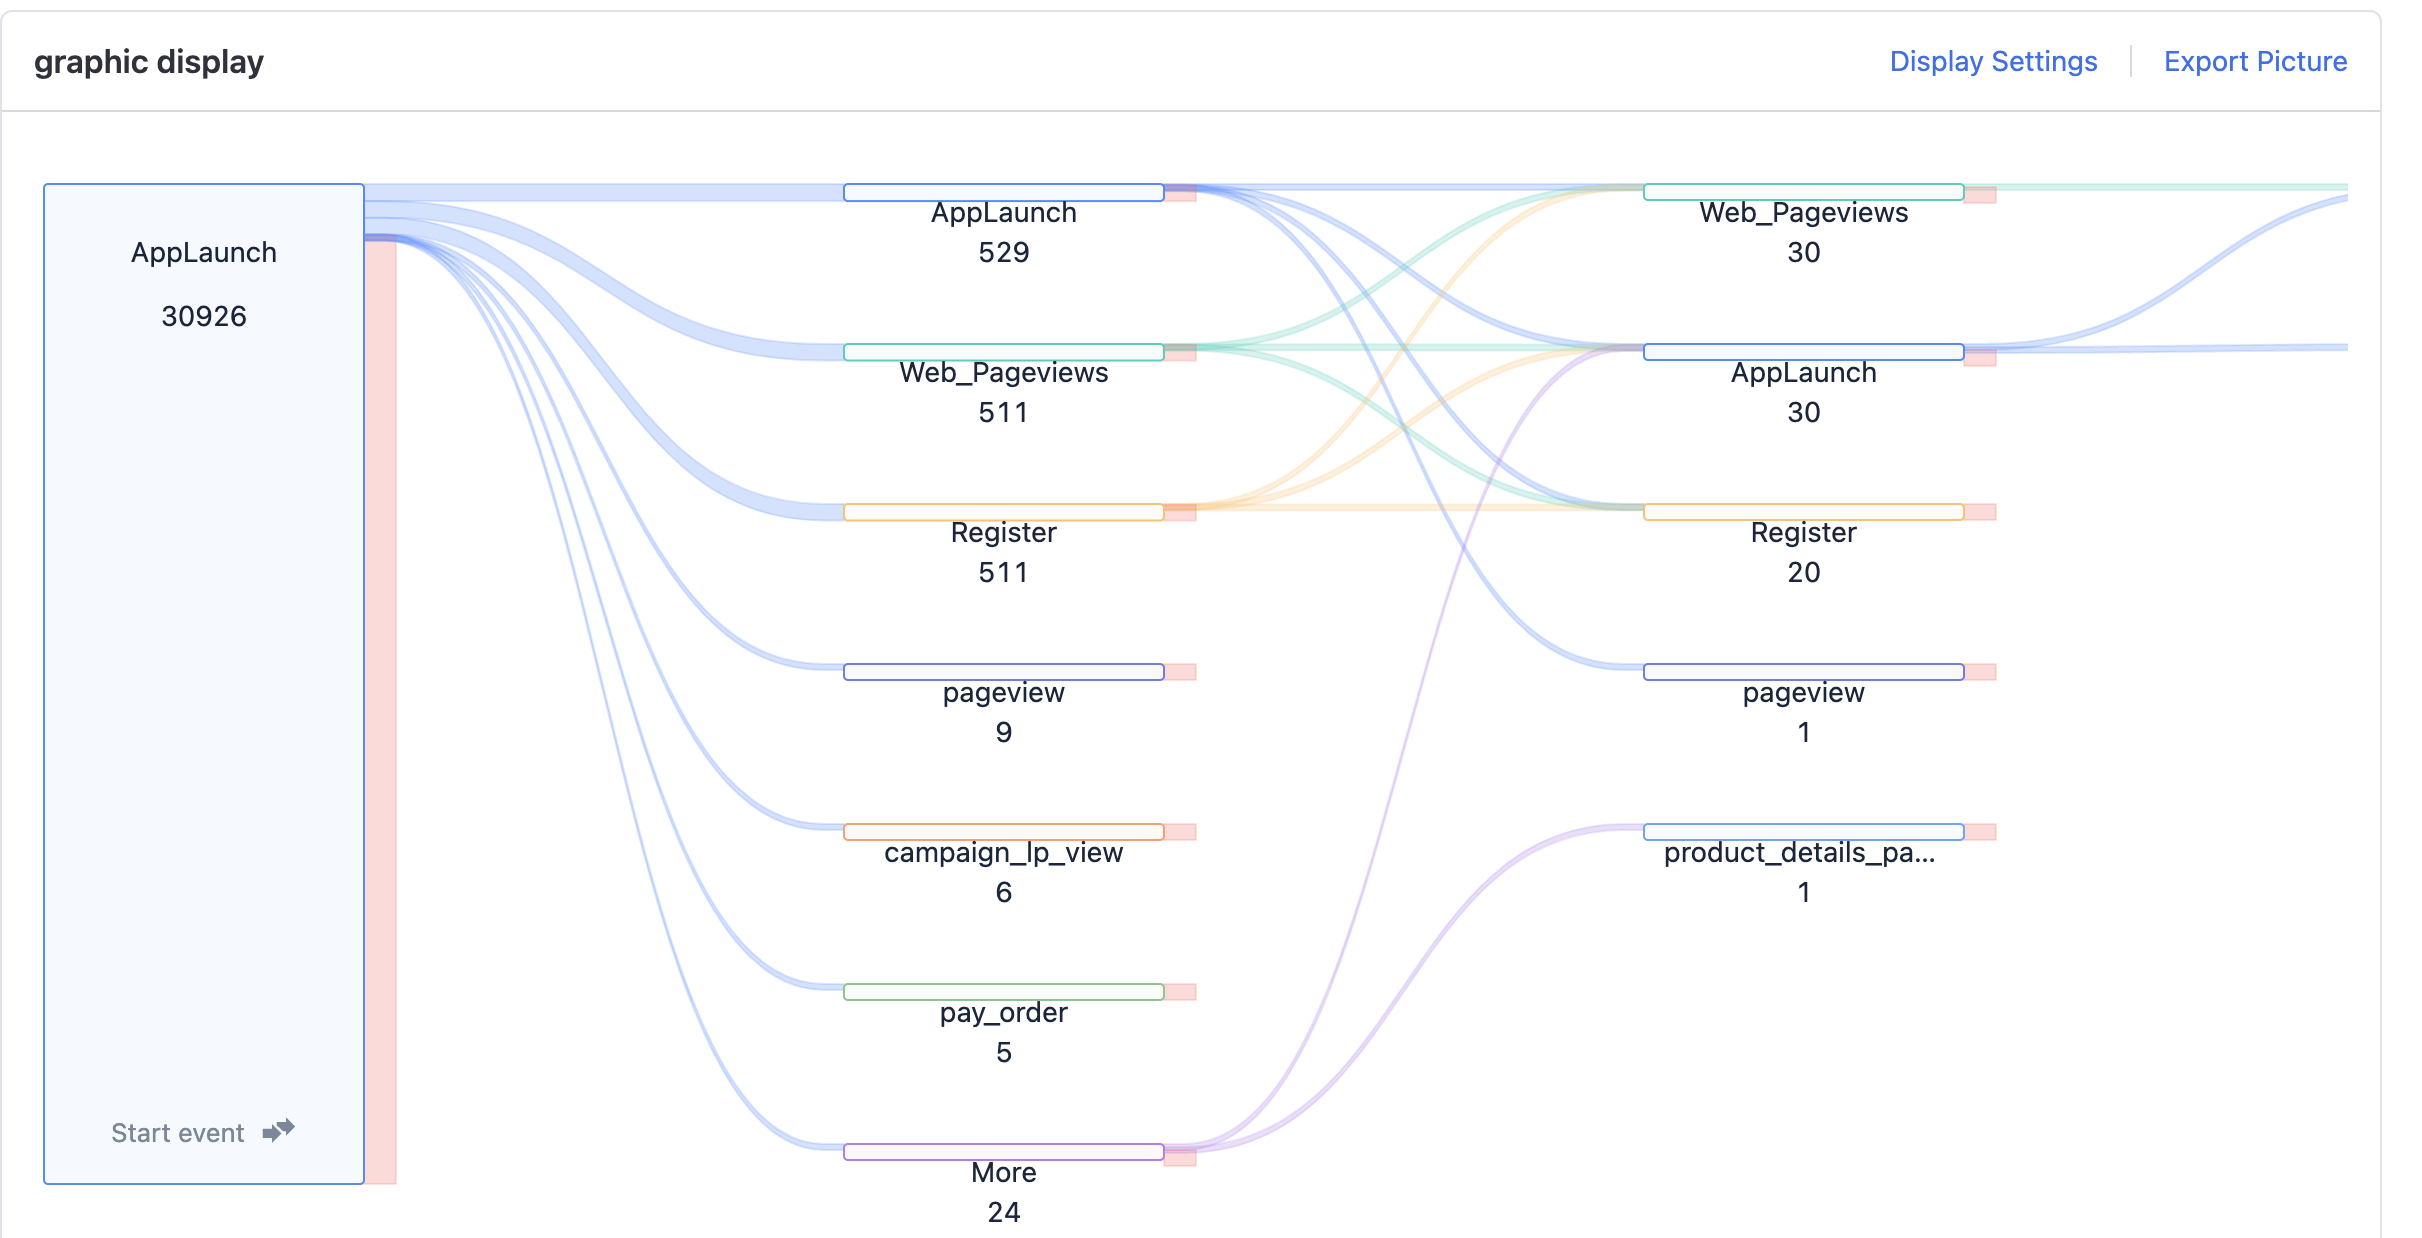
3.4. Visual analysis result
As shown in the figure, the analysis result is presented in the form of a Sankey diagram, starting or ending with the target event. Users can view the subsequent/previous paths and traffic of certain events in detail.
It also supports one-click export of "Sankey diagram analysis result image" for reporting.
3.5. Highlight the current path
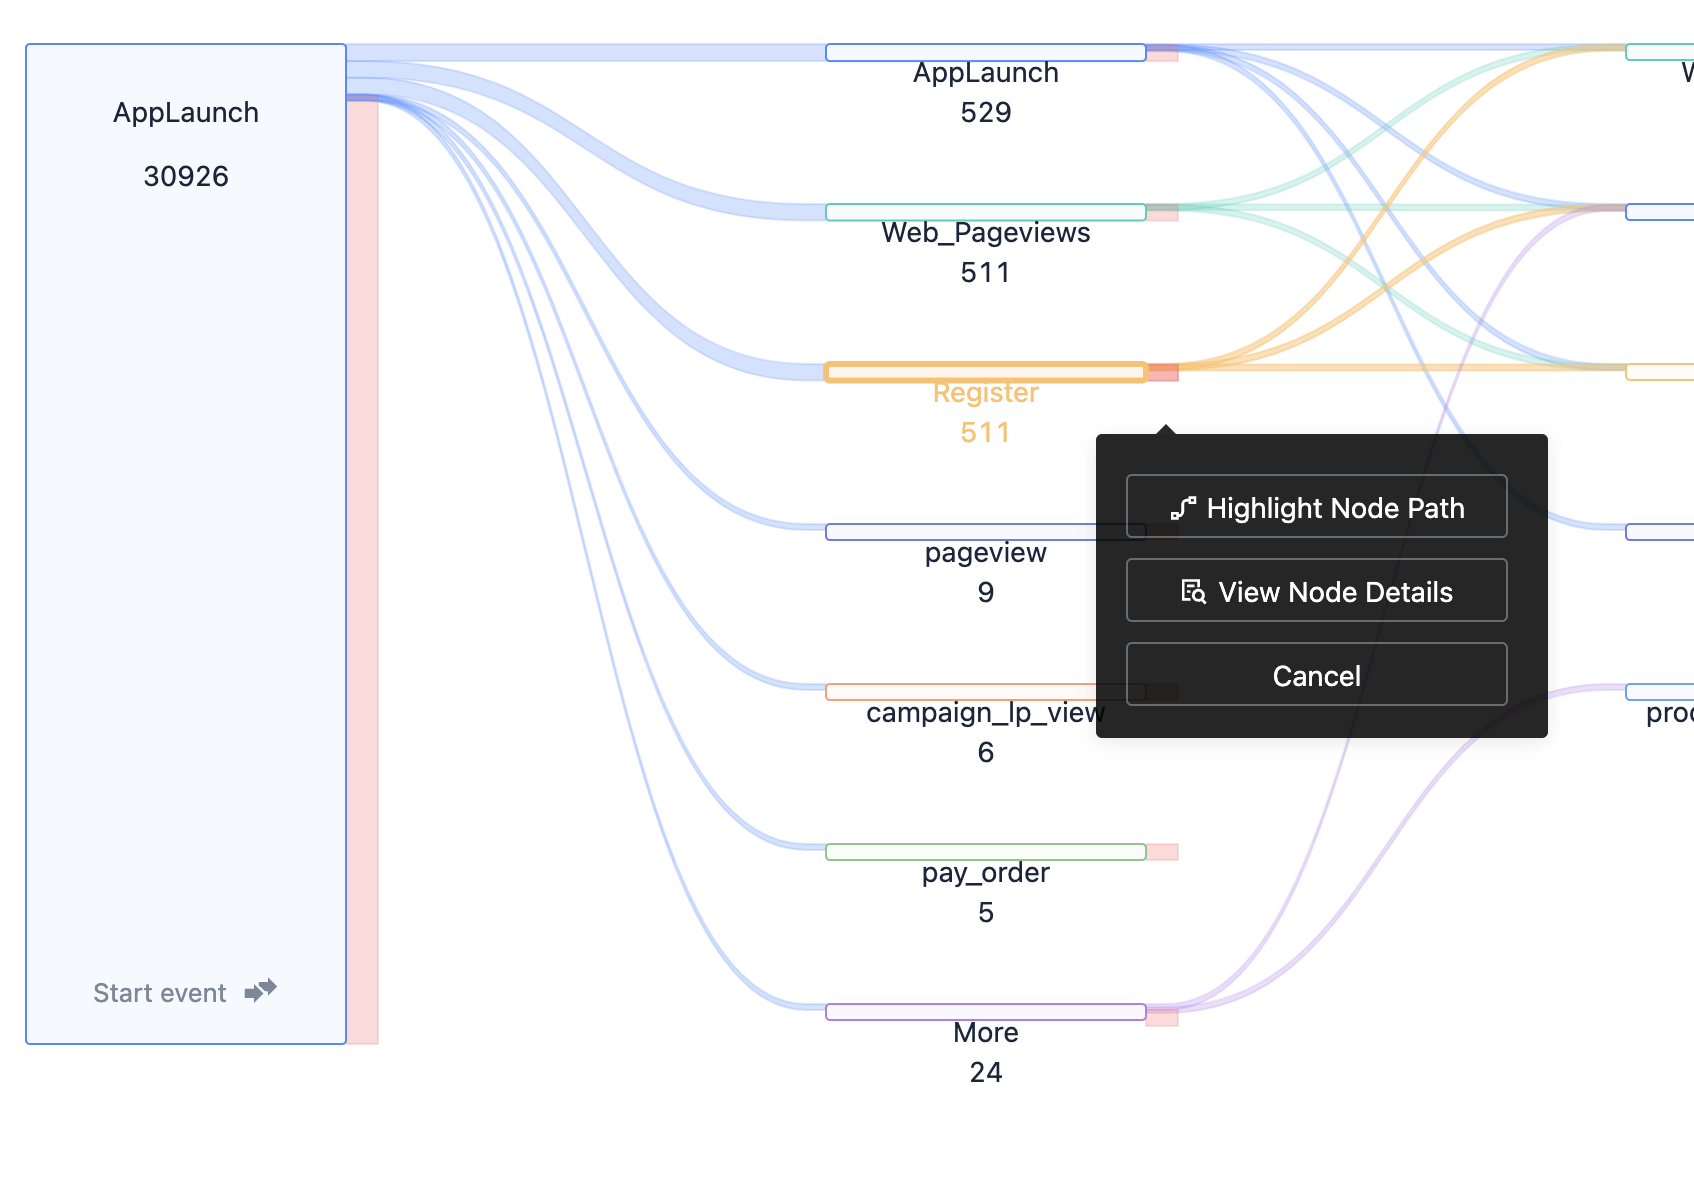
As shown above, click the node you want to view, select the "Highlight the current path" option, and you can view the session passing through the current event.
3.6. View node details
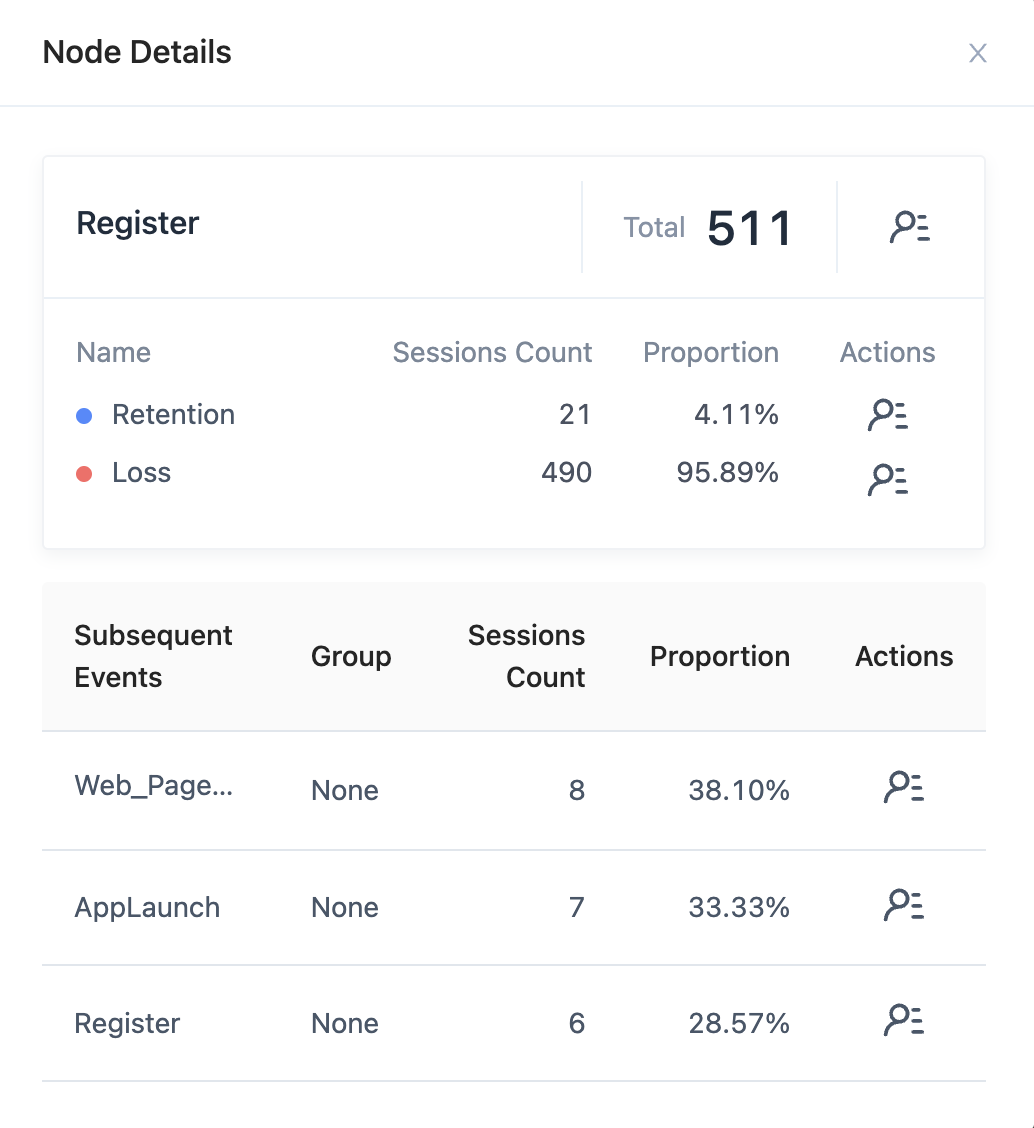
For each event node, you can click on the node, select View Node Details to view the relevant information of the current node event, including Event Name, Grouping Attribute Value (if any), Total, Subsequent Event Statistics, Loss, and Subsequent Event List. Among them, Subsequent Event List will list the session number and grouping value of the current event in detail (if any). More importantly, it should be noted that the detailed information shows the session number, not the number of users, so the session number and the number of users in the user list may not necessarily be consistent.
3.7. Support grouping display of start/end events
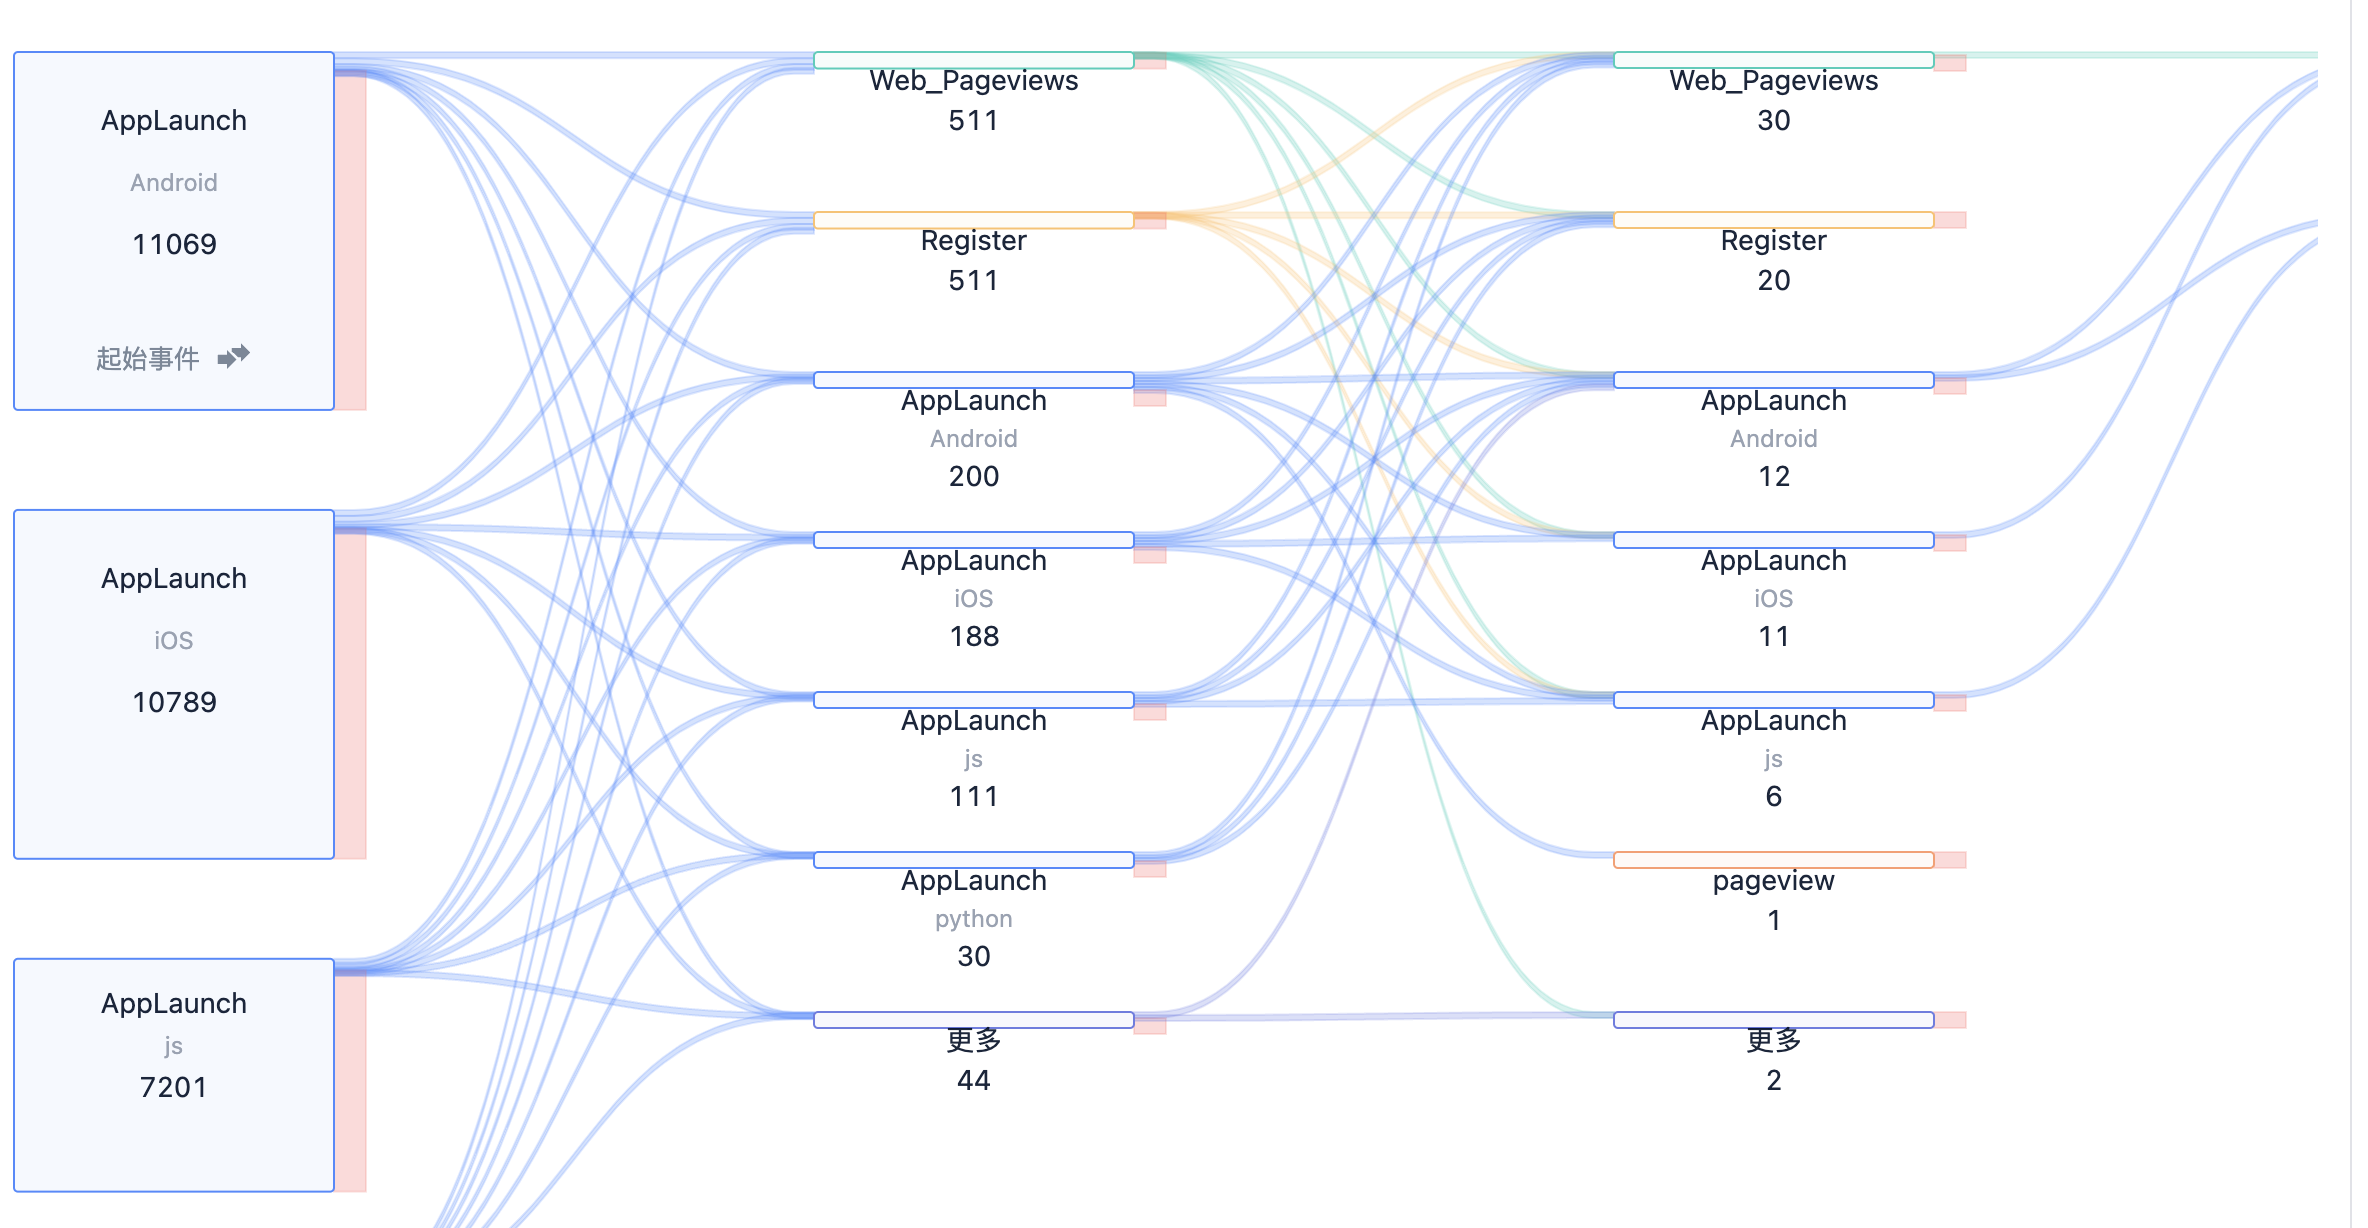
Here, separate grouping settings for start/end events are not provided, but added uniformly when setting query conditions.
4. FAQ
4.1. Why does the result differ when different session intervals are selected?
A: Choosing different session intervals will split and process events according to different times, so the result will be different.
Note: The content of this document is a technical document that provides details on how to use the Sensors product and does not include sales terms; the specific content of enterprise procurement products and technical services shall be subject to the commercial procurement contract.
 Popular Searches