Intelligent Alert Analysis
|
Collect
1. Overview of Intelligent Alert Analysis
Intelligent Alert Analysis has been upgraded and revamped in SA2.3. It intelligently alerts on core metrics and automatically analyzes abnormal metrics.
Intelligent Alert: Accurate targeting of abnormal data
On the basis of the original custom rule alert, it has expanded the ability to enable intelligent alerts with one click. Based on historical data, intelligent prediction algorithms accurately forecast intelligent intervals in hours and days. It can intelligently learn the overall trend and periodicity of historical data, accurately identify abnormal data, and avoid losses and risks caused by abnormal data.
Multi-channel alert notifications. Supports webhooks, emails, system messages, etc.
Intelligent Analysis: Quickly identify the causes of abnormalities
Enhanced automated analysis capabilities. After locating the abnormal data, automatically investigate the cause of the data anomaly, including multi-dimensional analysis of abnormal dimensions (diagnose abnormal dimensions) and identifying abnormal users (diagnose cheaters).
Warnings for the same period and analysis of the correlation between indicators, not only analyze indicators individually, but also explore the interrelationships between indicators and consider the abnormal fluctuations of indicators from a holistic perspective of business.
2. Create Alert
2.1. Create Alert Entrance
2.1.1. Intelligent Alert Analysis Creation Entrance
You can click on Create Alert in the upper right corner of the Intelligent Alert Analysis list page
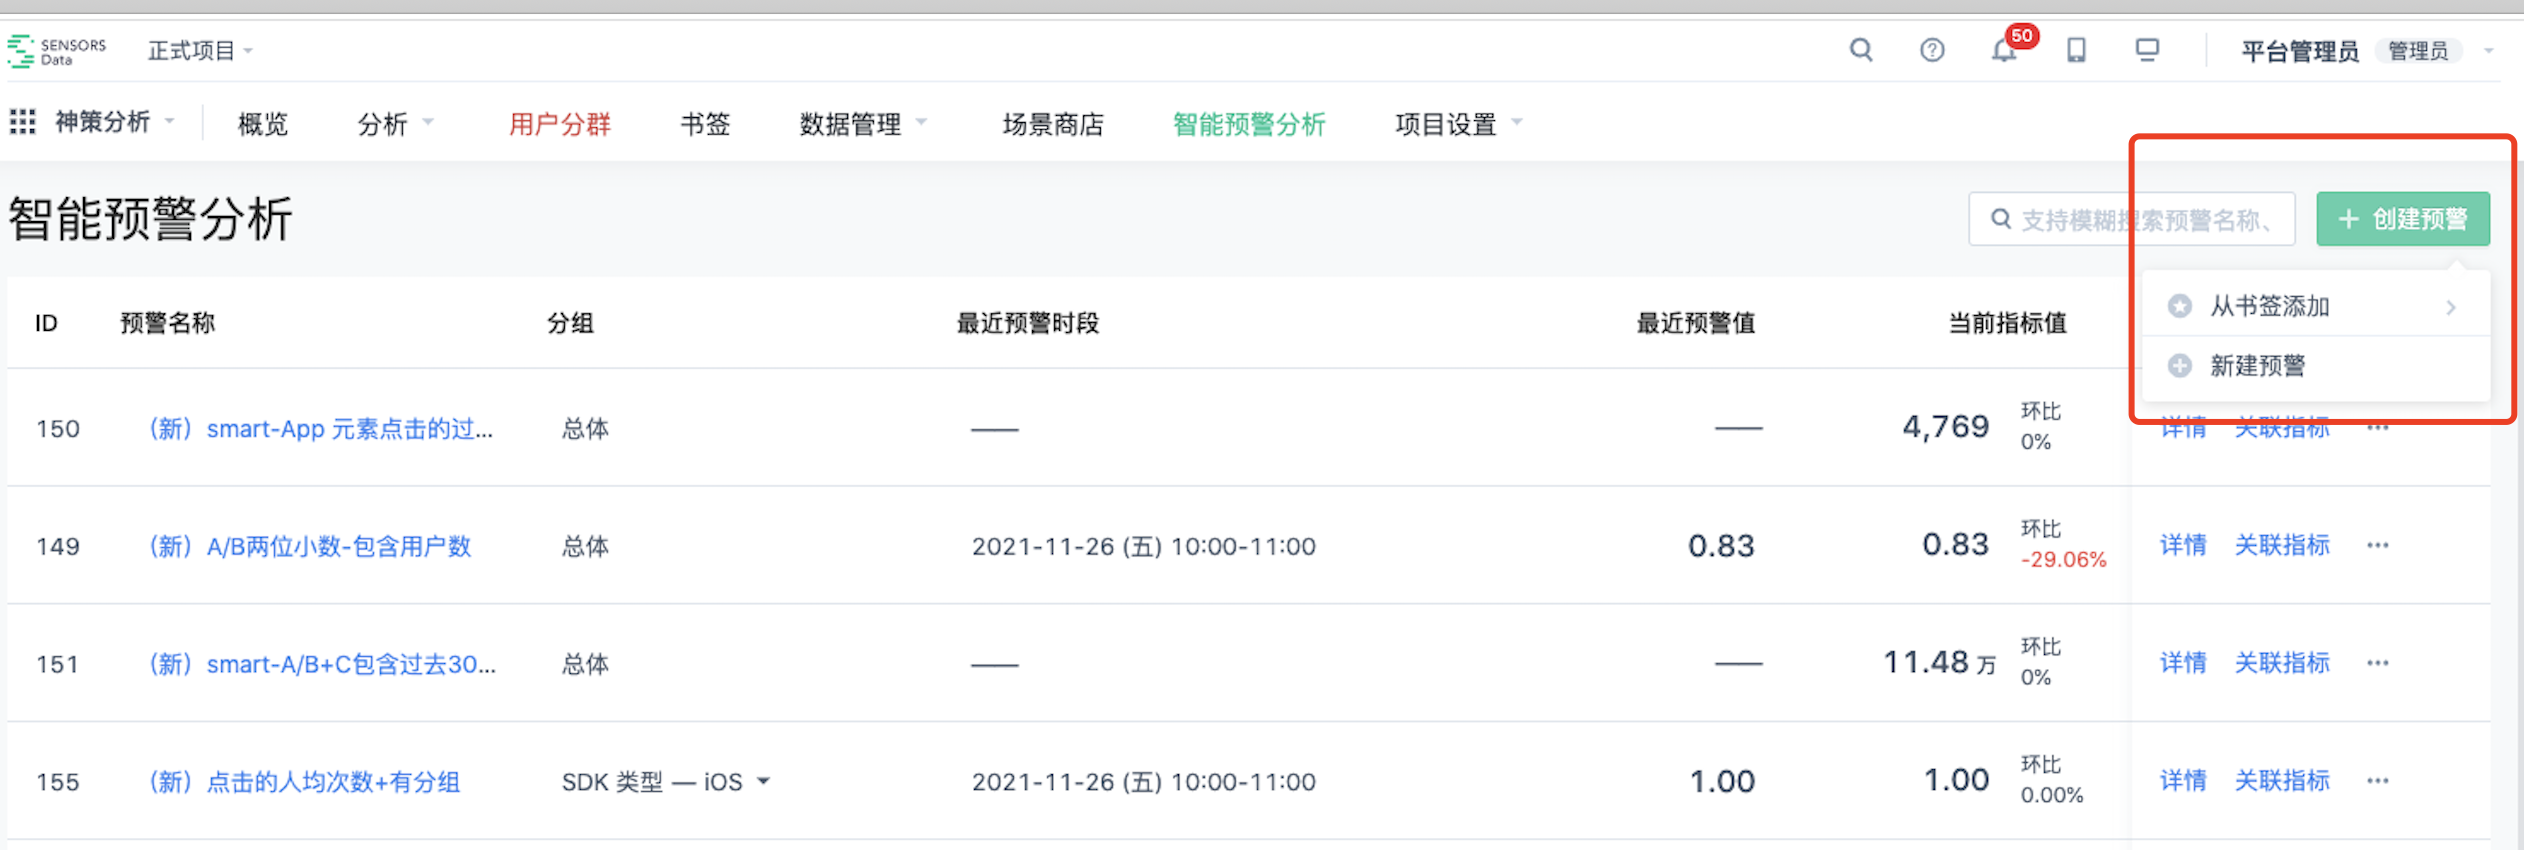
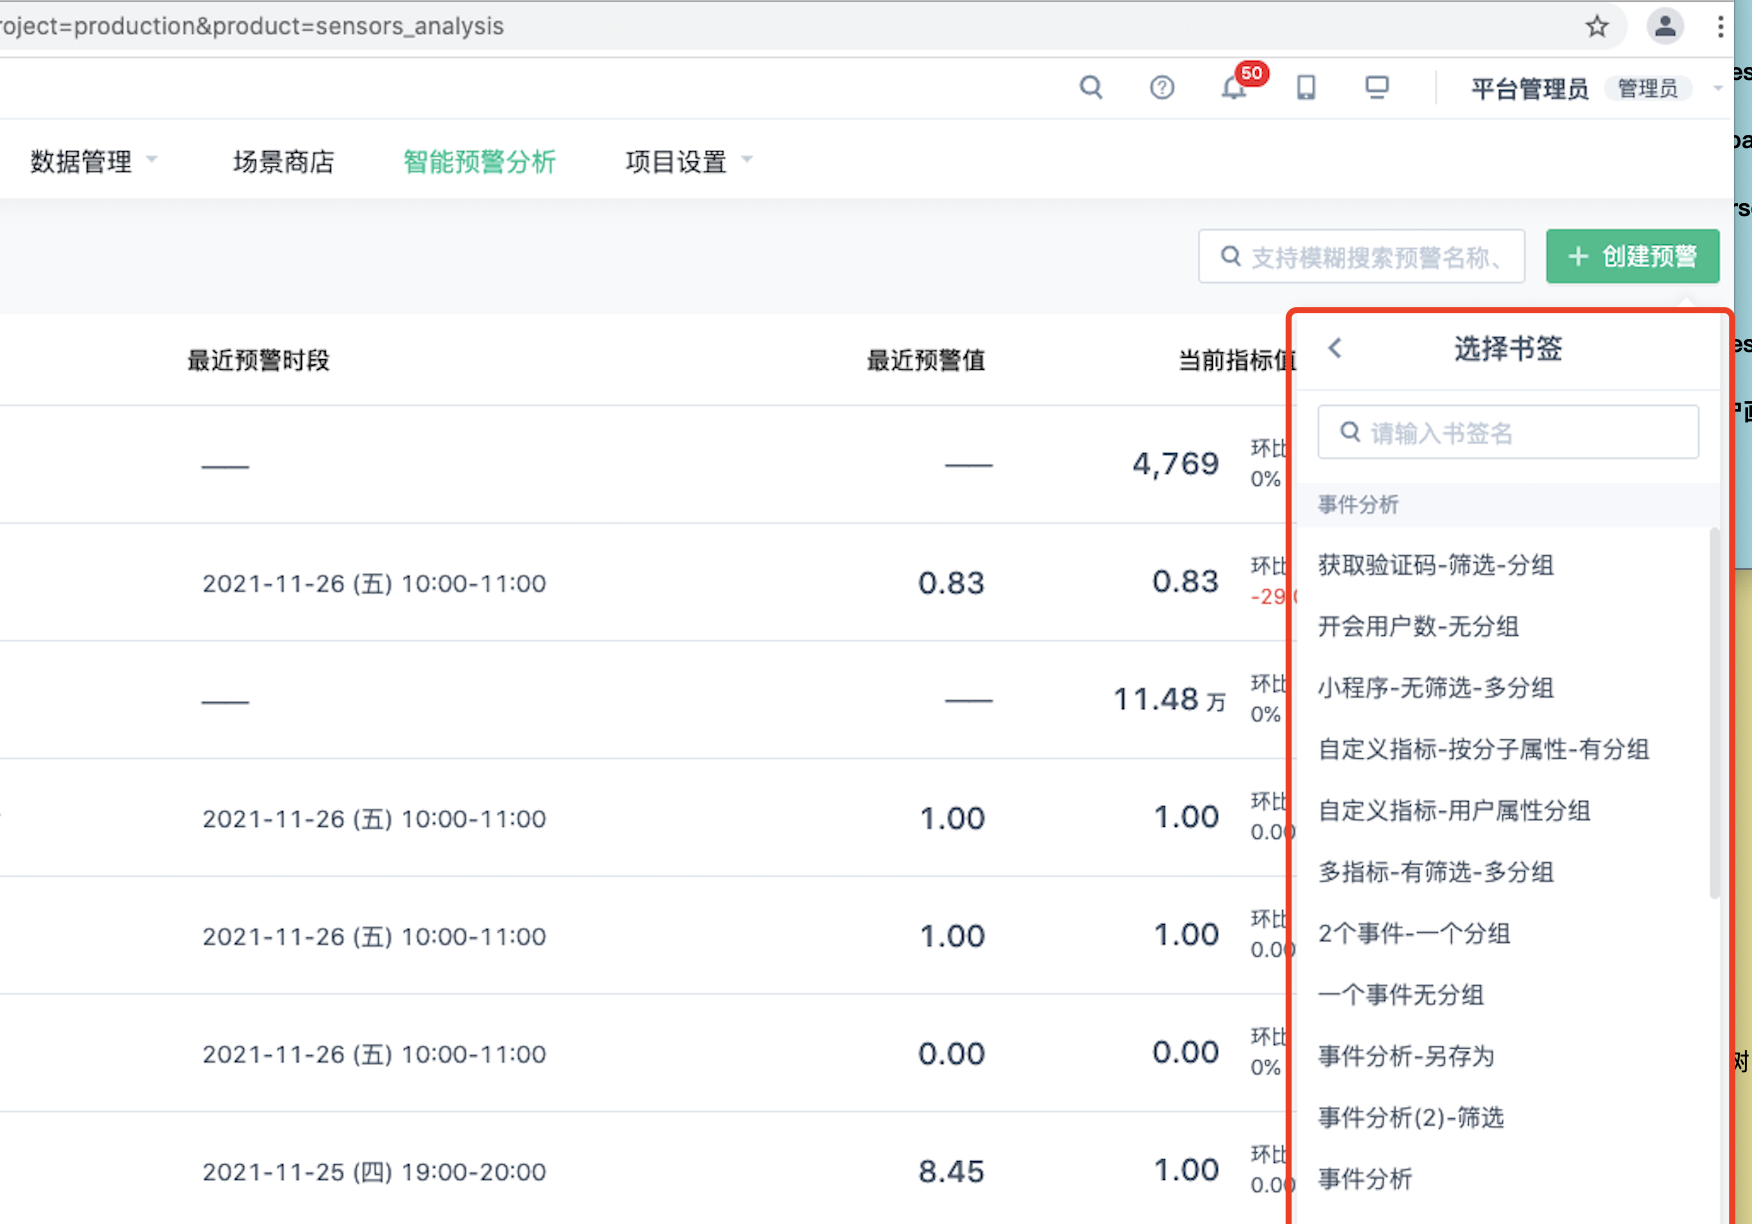
- Add from bookmarks. You can quickly create alerts based on historical event analysis bookmarks
- Create Alert. Go to the analysis model [Event Analysis] to build indicators for alert settings.
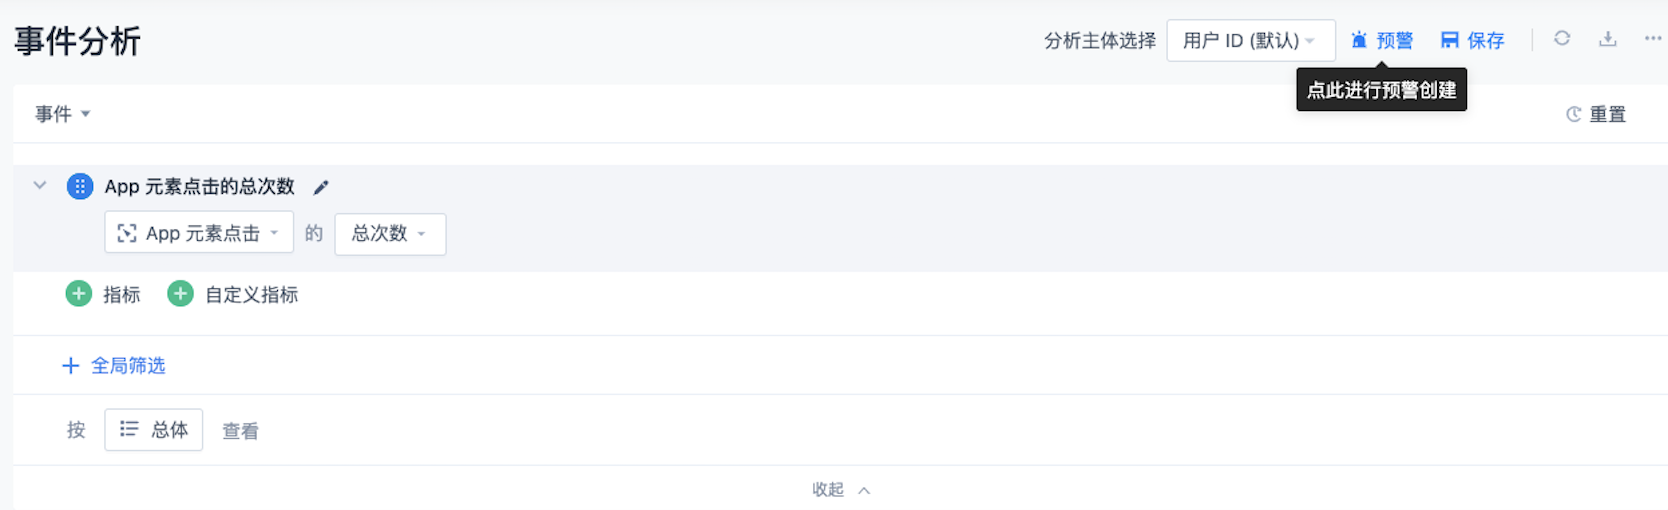
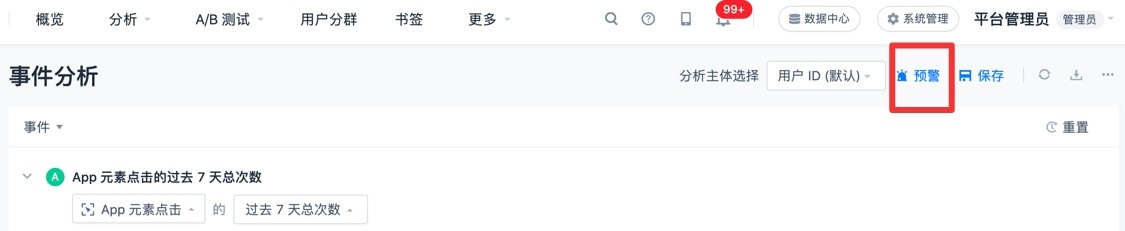
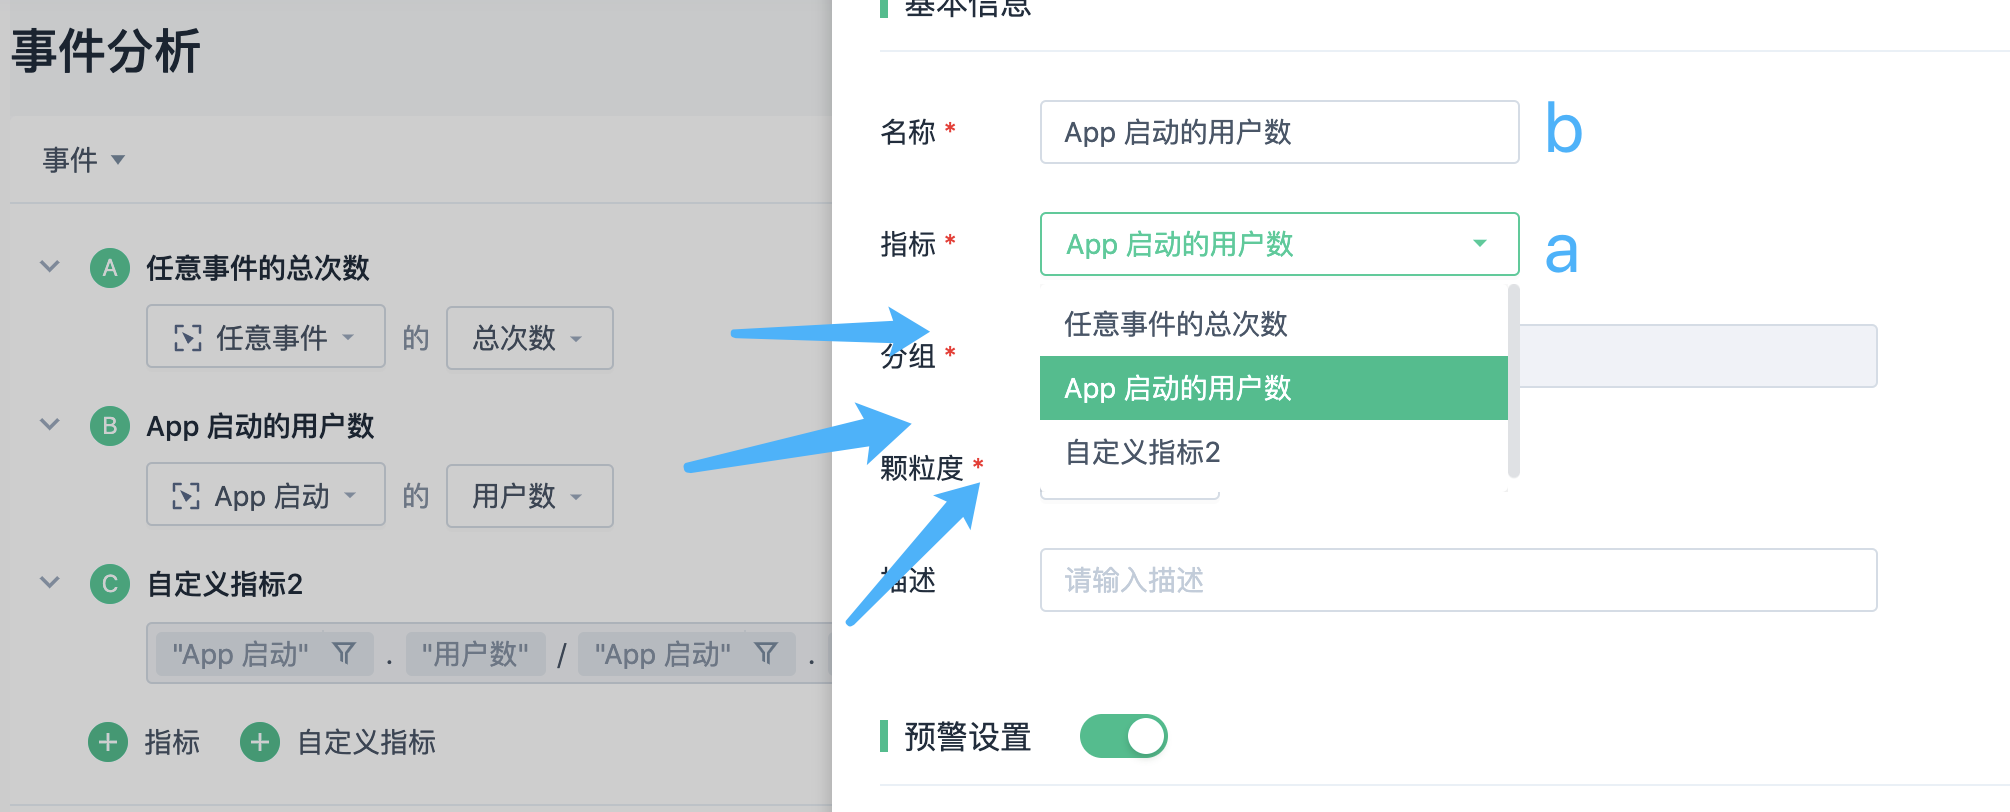
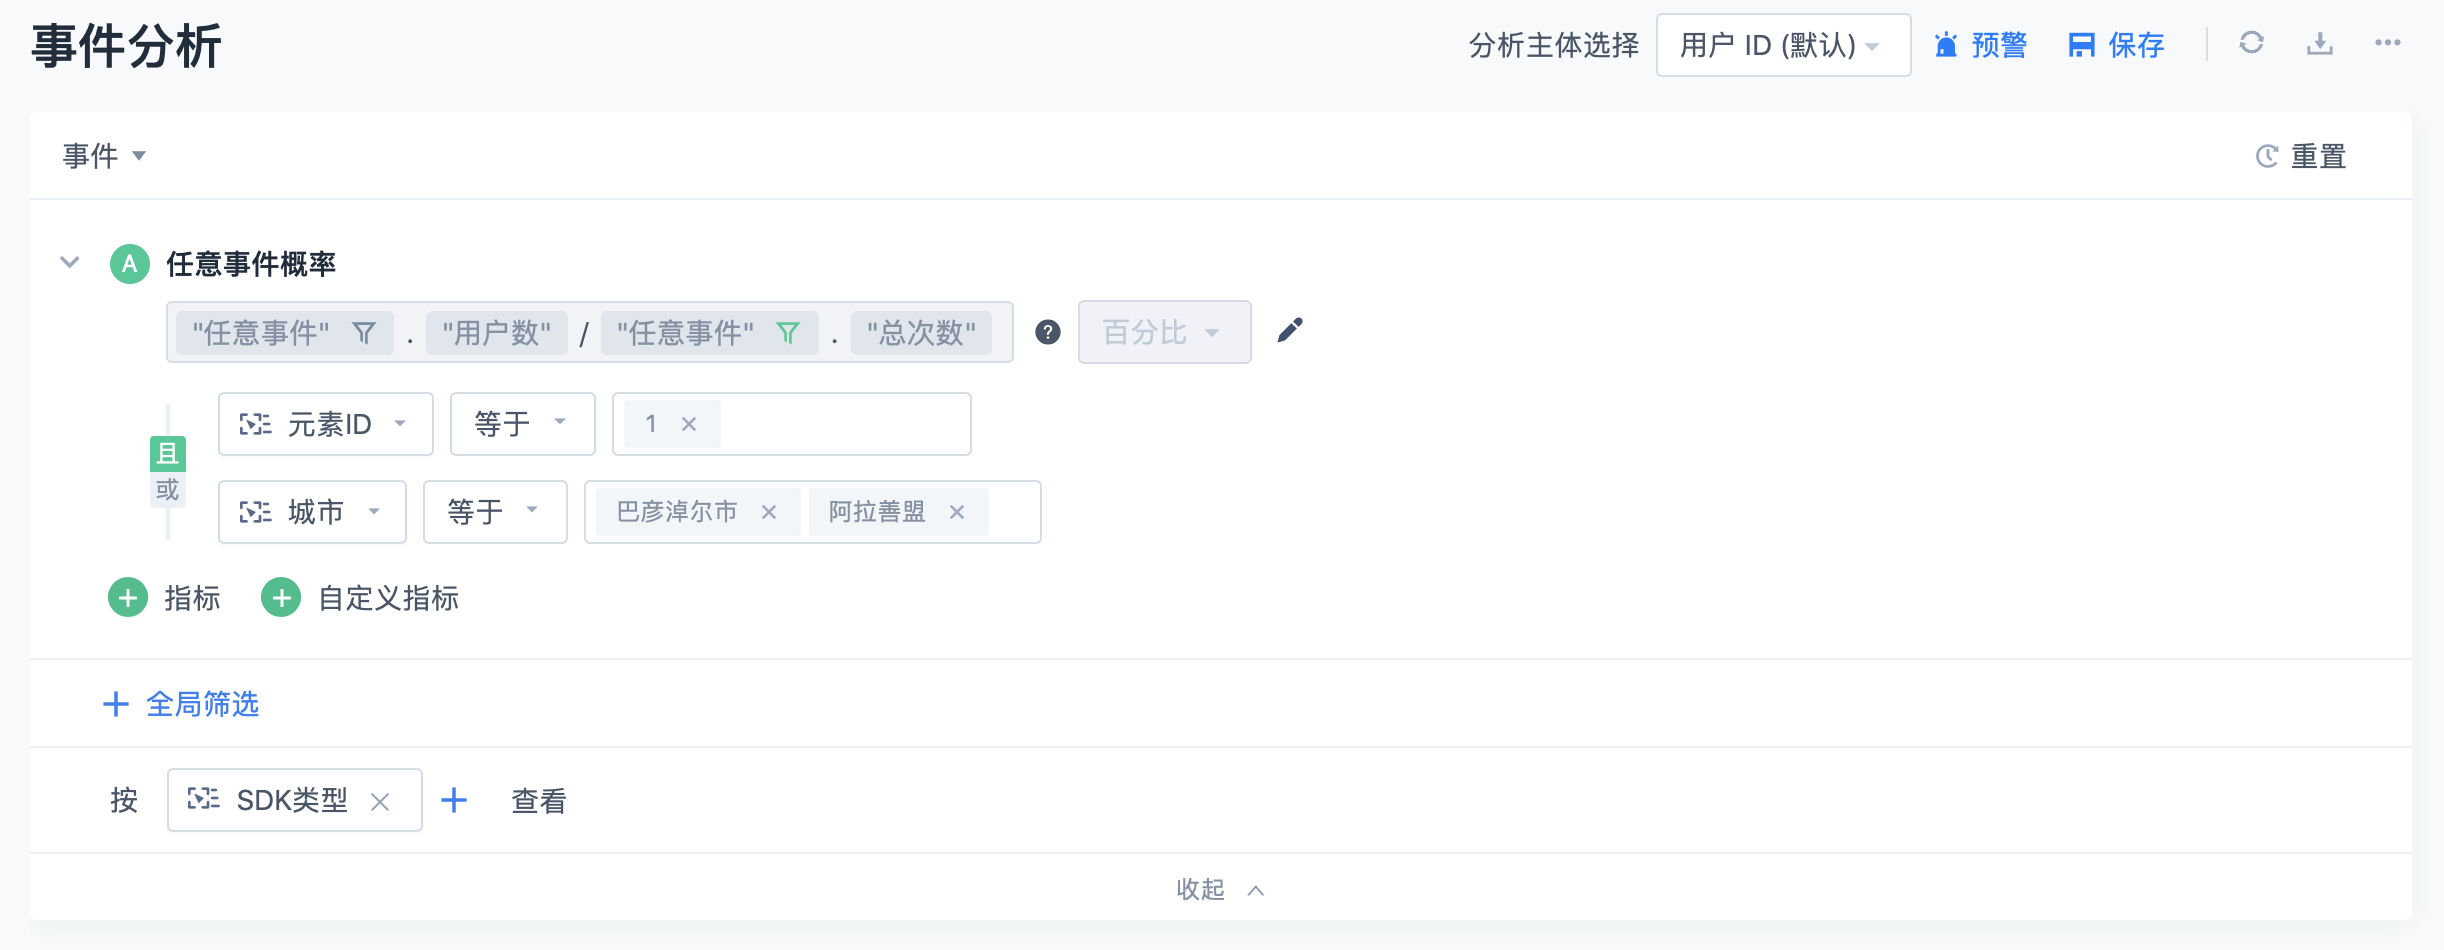
2.1.2. Event Analysis Entrance
[Event Analysis] Create the metrics you want to analyze. If you want to monitor the metrics, click the [Alert] button in the upper right corner to enter the [Create Metric Alert] interface.
Note: Alerts will include the statistical calibre of the metrics created in the event analysis (including event statistical approach, event filtering, and global filtering conditions).
2.2. Create alert configuration
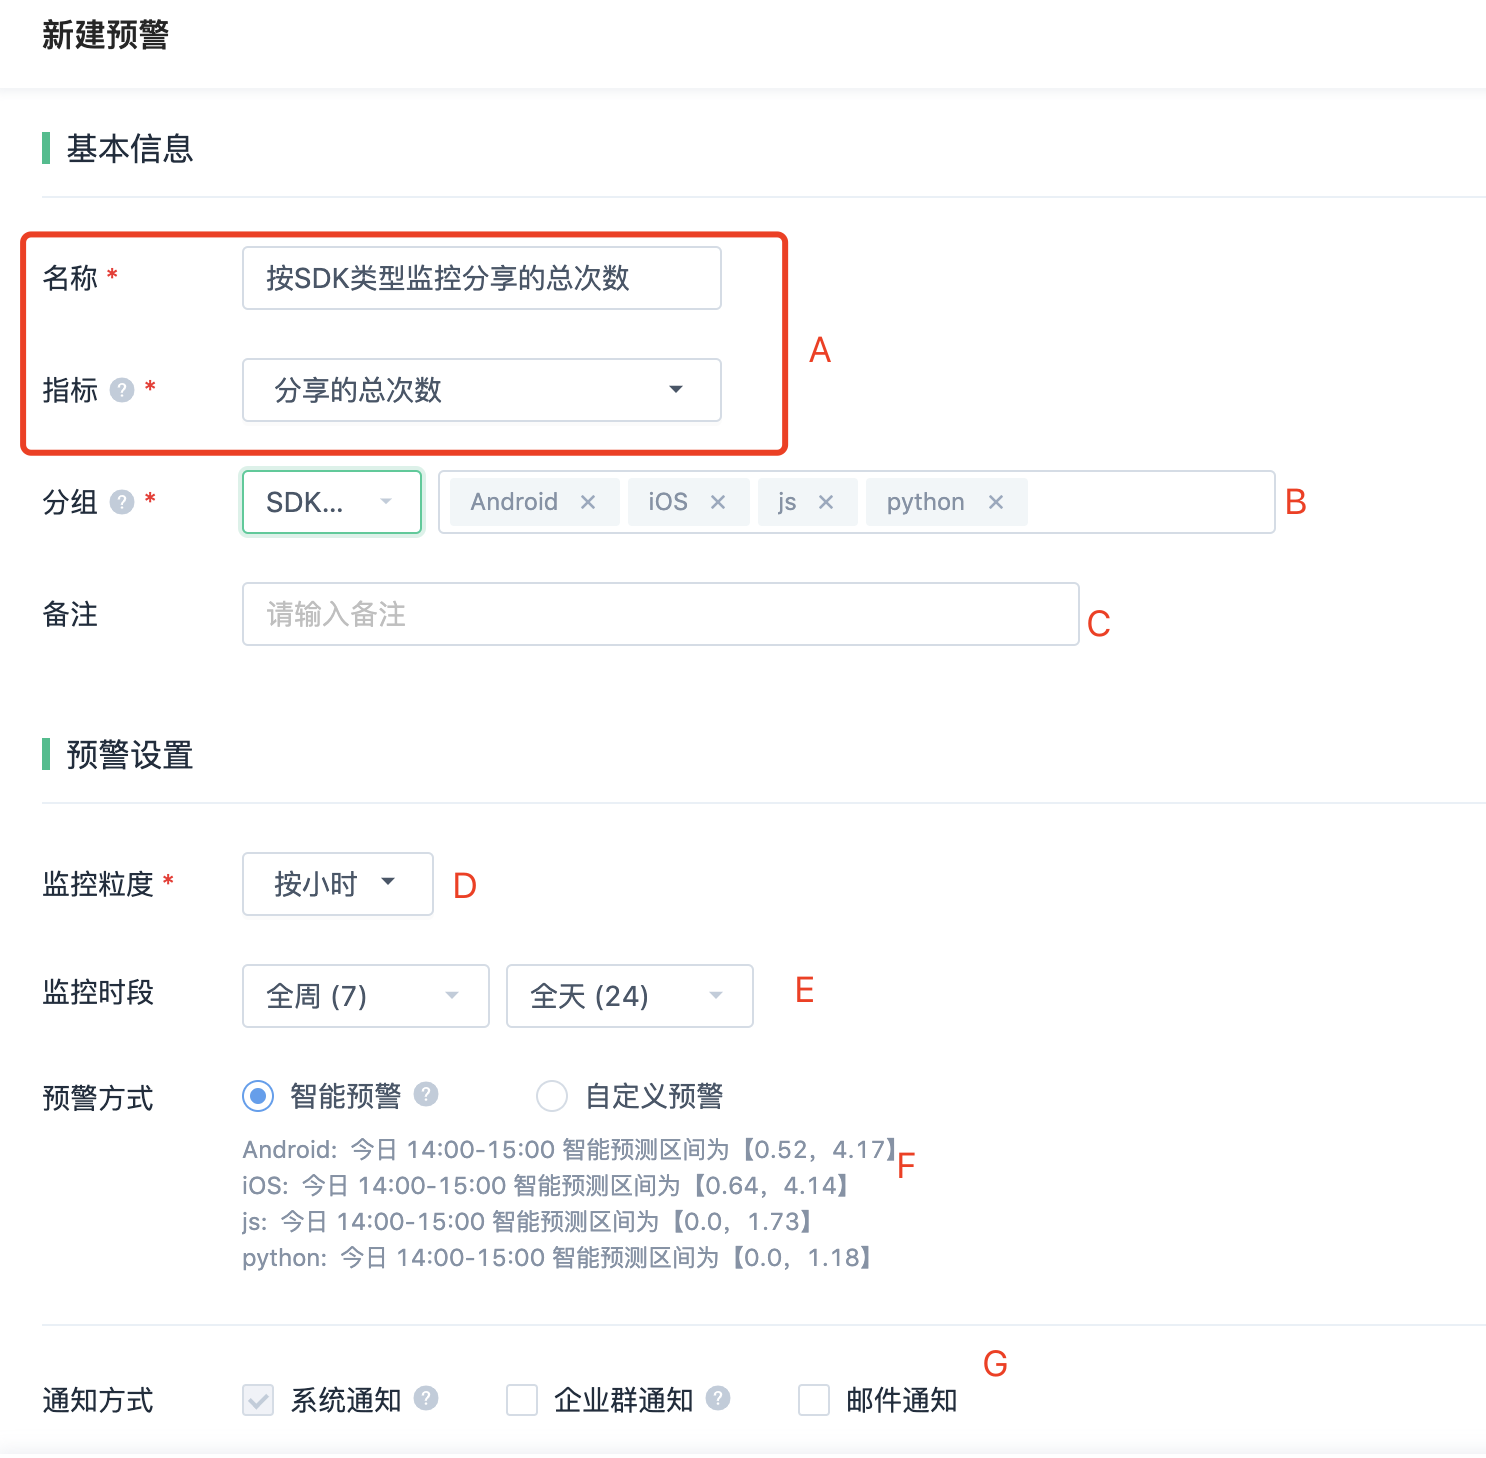
A. Set the alert name and metric
- If multiple alert metrics are created in event analysis, you can select the [Metric] name that needs to be monitored from the drop-down box (a).
- The alert [Name] defaults to the selected alert [Metric] name, and you can enter to modify it (b).
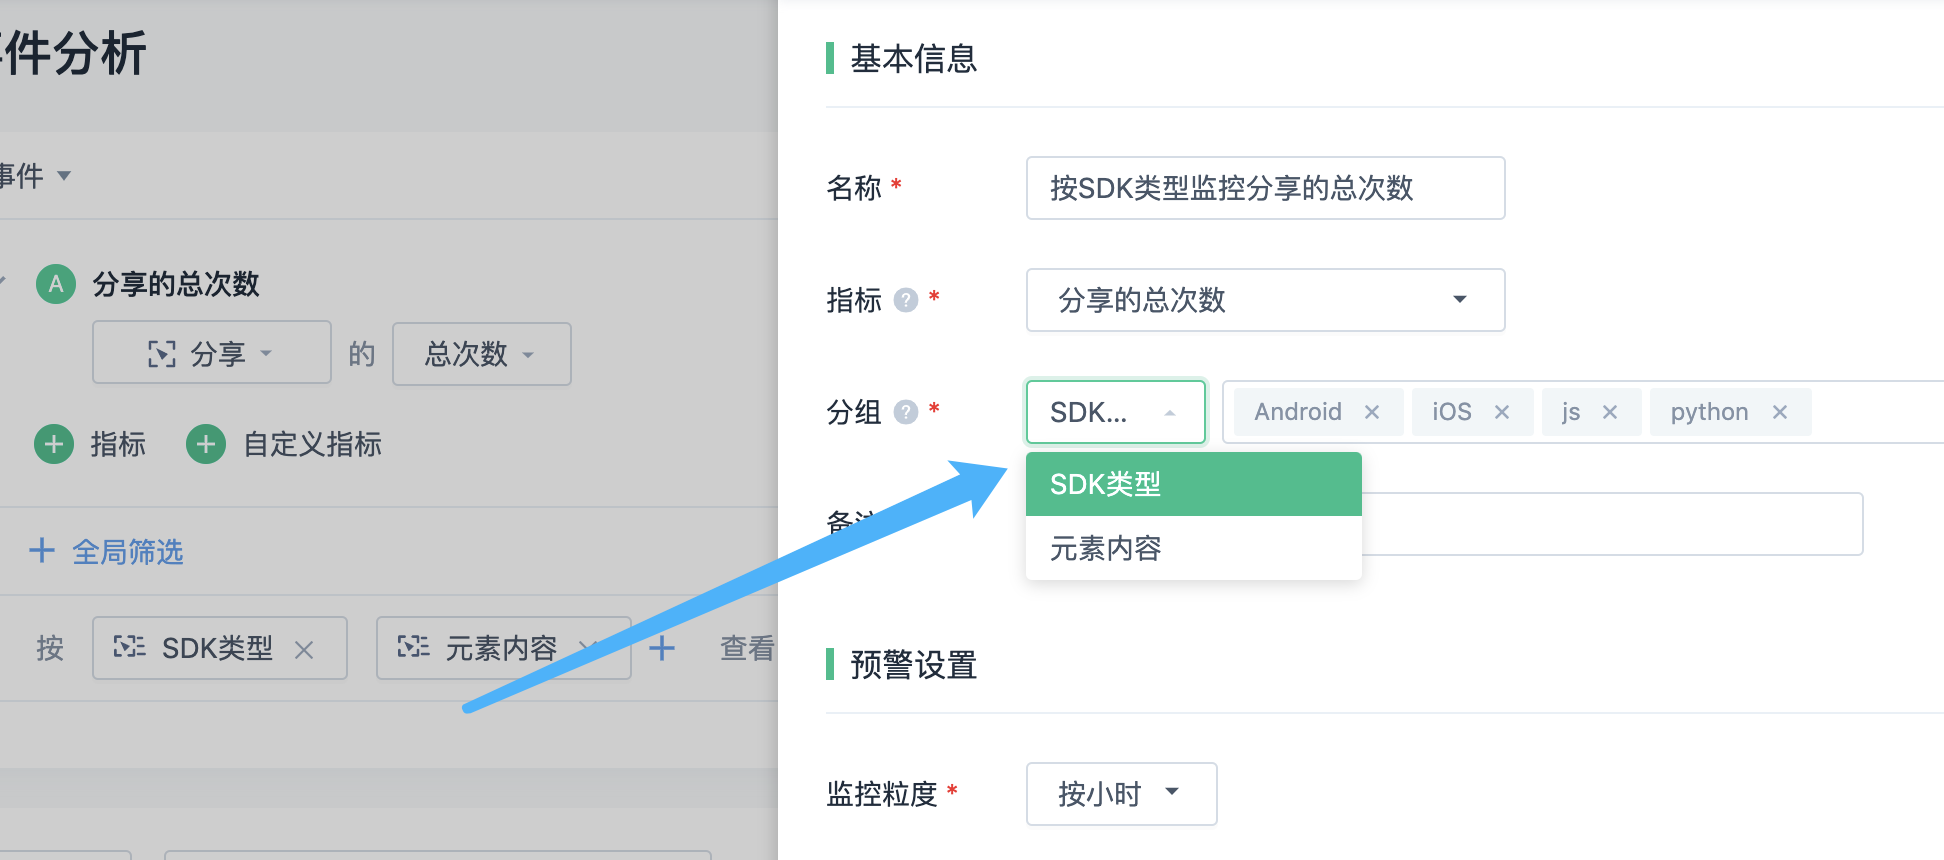
B. Set the alert grouping. The alert "Group" can be monitored based on the overall or based on the "View Dimension (such as SDK type, element content)" selected in event analysis. Up to 10 grouping values can be selected for alert monitoring.
Note: The current alert only supports grouping settings of String and Bool types in event attributes.
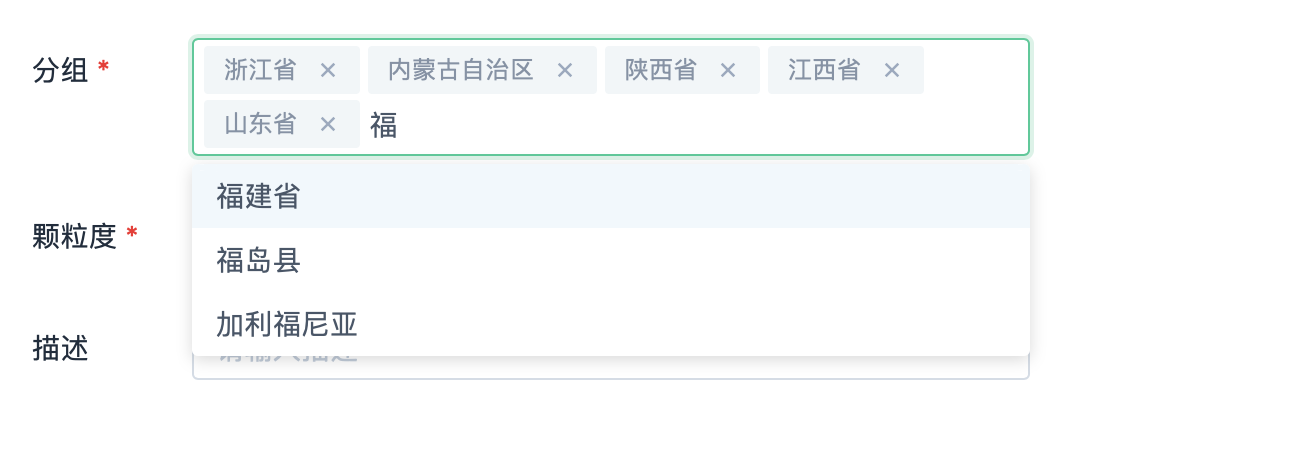
Q: How can I add a group that is not in the dropdown list?
A: The dropdown list displays up to 10 grouping values, and the grouping values support fuzzy search. As shown in the following figure:
C. Note for warning description is optional. This field is not required.
D. Set the monitoring granularity, that is, the indicator period, to By day or by hour.
E. Select the monitoring period for the warning. If the monitoring granularity is set to By Day, set the monitoring granularity to by Dayweeklyfew daysgive early warning; For the same reason, if the value is by hour, you can set the value to correctdailyfew hoursgive early warning.
F. Select early warning mode
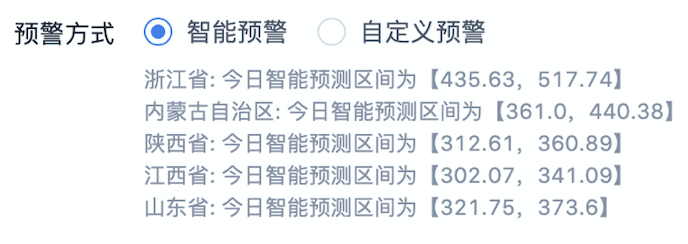
- If you choose "Intelligent warning",将Based on indicator historical data, according toProphetThe prediction model (based on general trend + periodicity + special event) calculates the [intelligent prediction interval] for each group.It can effectively improve the accuracy of early warning and reduce the false alarm rate.
注:
- If the group is "overall", the intelligent prediction interval for today/current hour is displayed; If there are several groups, the intelligent prediction interval for each group is displayed today/this hour (if there is insufficient data for a group, the prediction interval for that group is not displayed).
- When you update Metrics, Granularity, and Groupings, the above prompts are updated.
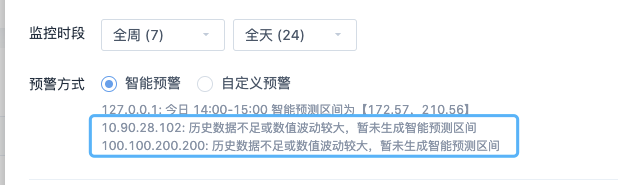
- When the data is too small or the data fluctuates greatly, the intelligent interval prediction cannot be carried out.
- If you choose daily monitoring, perform intelligent forecast based on 90-day historical data. If the 90-day historical data is less than 30 days old, the intelligent forecast interval cannot be generated.
- Monitoring by the hour, based on 30 days *24 hours of historical data intelligent forecast, such as 30 days *24 hours of historical data less than 3 days *24 hours, can not generate intelligent forecast interval.
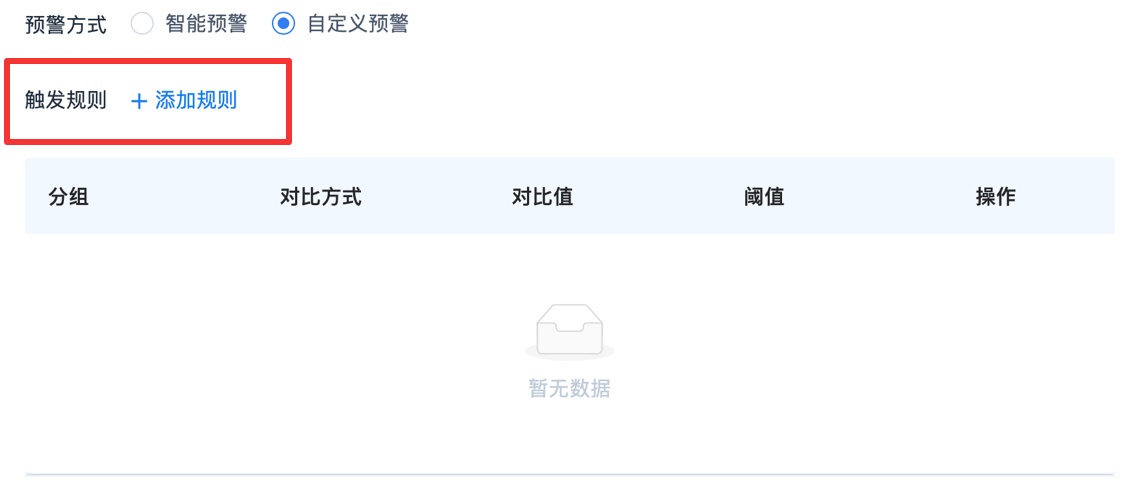
- If you select "Custom warning", click "+ Add rule" as shown in the figure to manually add "trigger rule".
- Open the Add Trigger Rule box as follows:
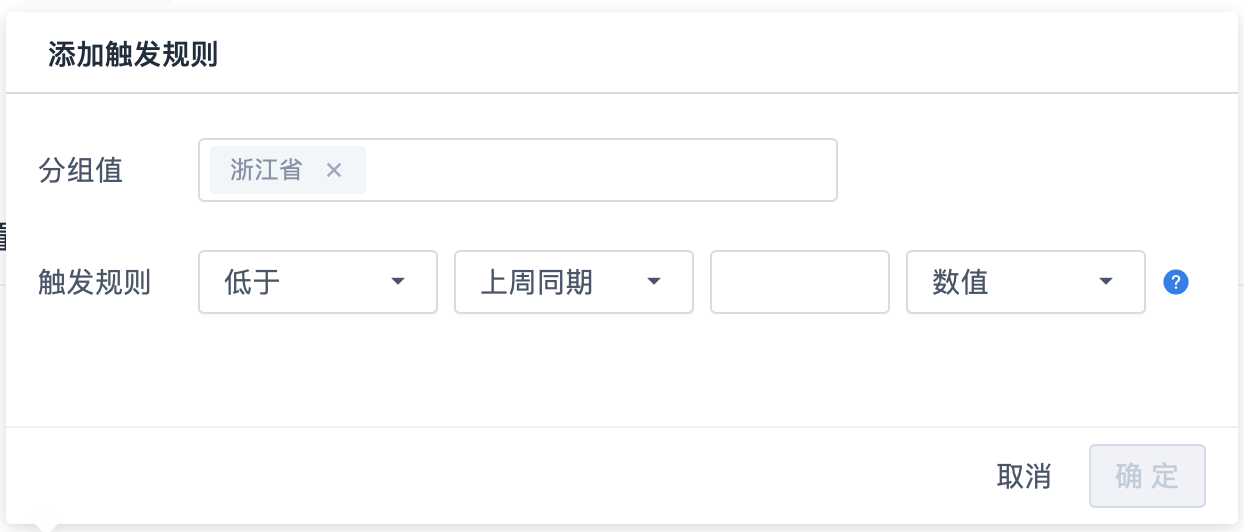
- When warning by hour or day, you can choose to compare with the predicted value or specific value, and you can also choose between the interval and the interval. When warning by hour, you can choose to compare with the last hour and the same period yesterday; When warning by day, you can choose to compare with yesterday and the same period last week.
- Among them, when selecting the same time yesterday, the index value will be compared with the same hour yesterday; When the forecast value is selected, it is compared with the indicator value predicted based on historical trends; When a specific value is selected, it is compared with a fixed value; When the selection interval is in, the indicator value will trigger the early warning when it is in a fixed interval; When the selection range is not available, the indicator will trigger an early warning when it exceeds the range.
- The predictive value warning function is provided in the strategy analysis after 2.0. Users who enable the predicted value warning function can configure the predicted value warning rule in the trigger rule.
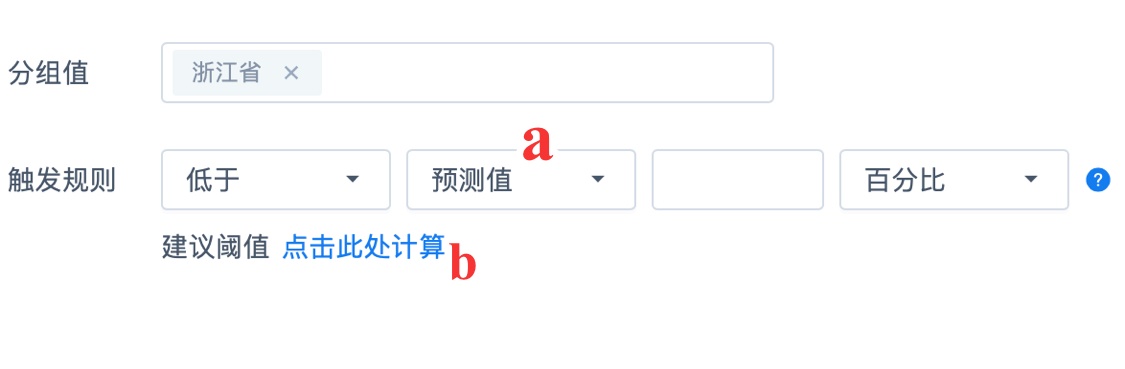
a. In the ratio drop-down list, select Predicted Value as the ratio.
b. Click the "Click here to calculate" link below, the "Recommended threshold" is calculated and automatically filled into the threshold input box.
- A maximum of 20 warning triggering rules can be configured for one warning.
G. Select a notification mode.
- System Notification This parameter is selected by default. Send system messages to the system creator.
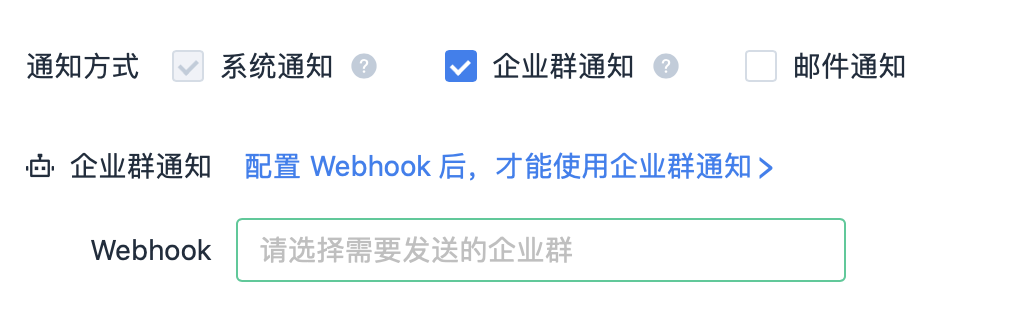
- [Enterprise Group Notification] Set the enterprise group that accepts the notification, and send the notification to Feishu, Dingding, enterprise wechat and other enterprise groups through webhook. See how to set up enterprise cluster notifications.How to configure enterprise group notification
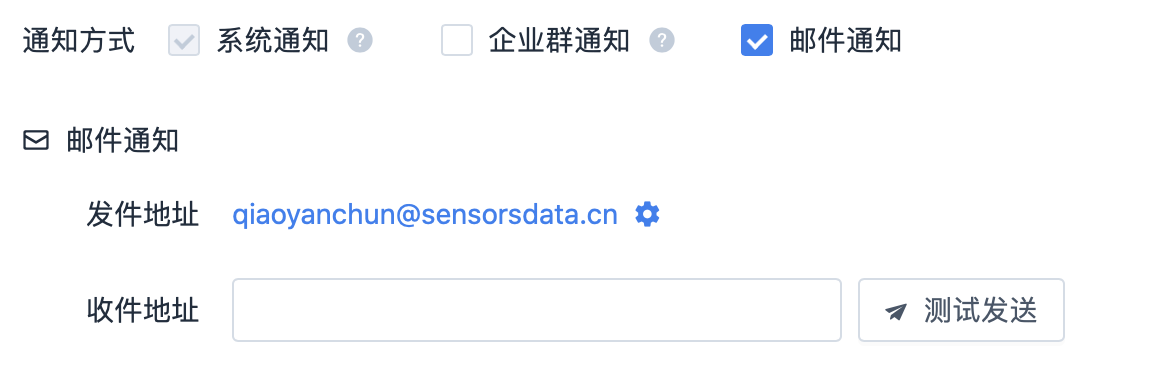
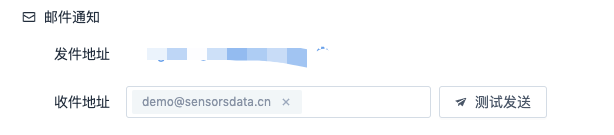
- [Email notification] Set the email address to receive the notification. Click "Test Send" to test whether you can normally receive the warning email notification.
3. Warning message notification
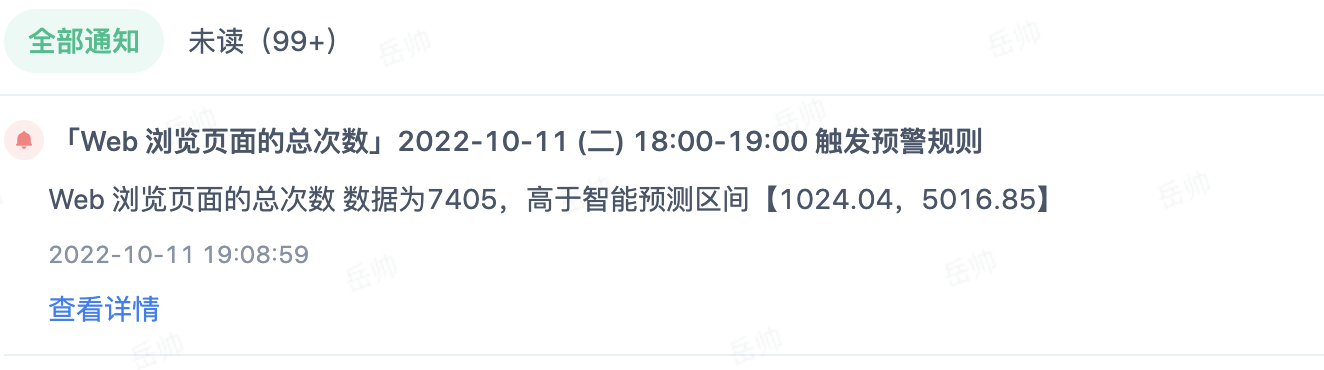
System notifications, mail notifications, and webhook notifications are currently supported, and the title and format of the notifications are consistent.
Title: Contains warning name and warning period
Contents: Warning indicator name "Group", indicator value, triggered warning rule. Supports quick jump to the warning details page.
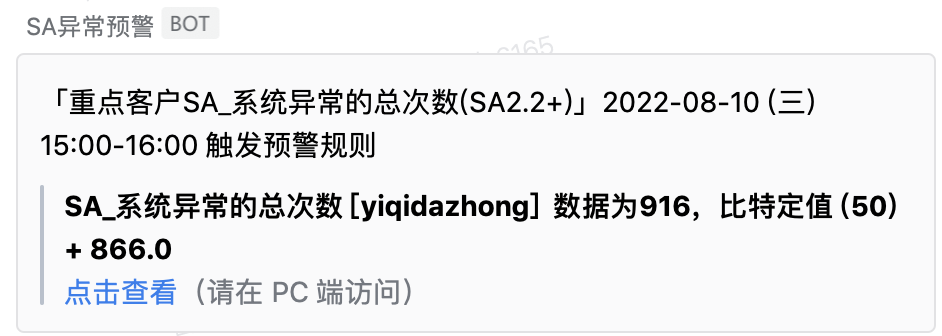
- System Notification Example
- webhook(Enterprise wechat example)
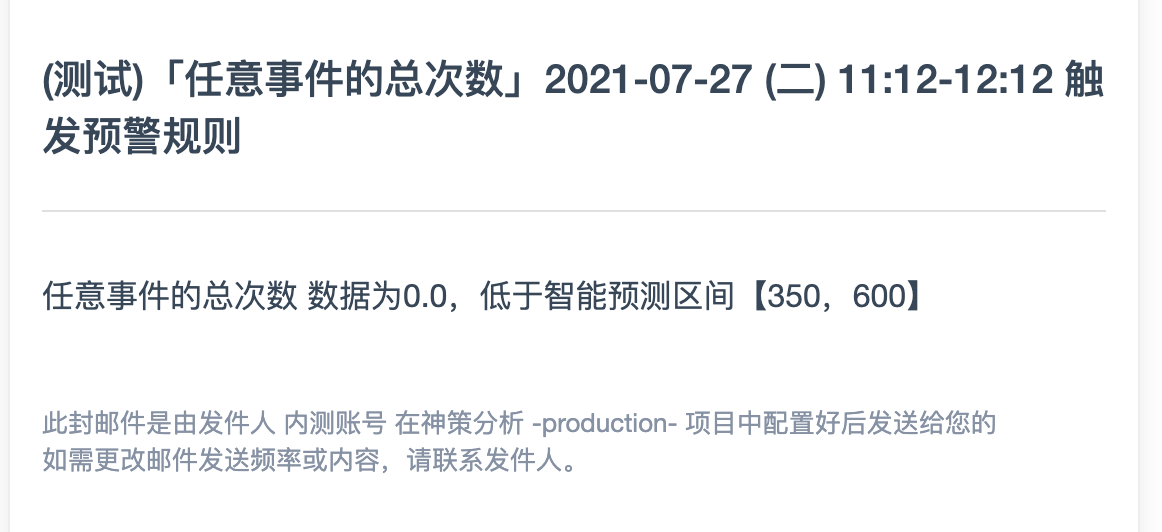
- Mail sample
4. Intelligent Analysis
4.1. Analysis Overview
Enter the alert details to view intelligent alert analysis.
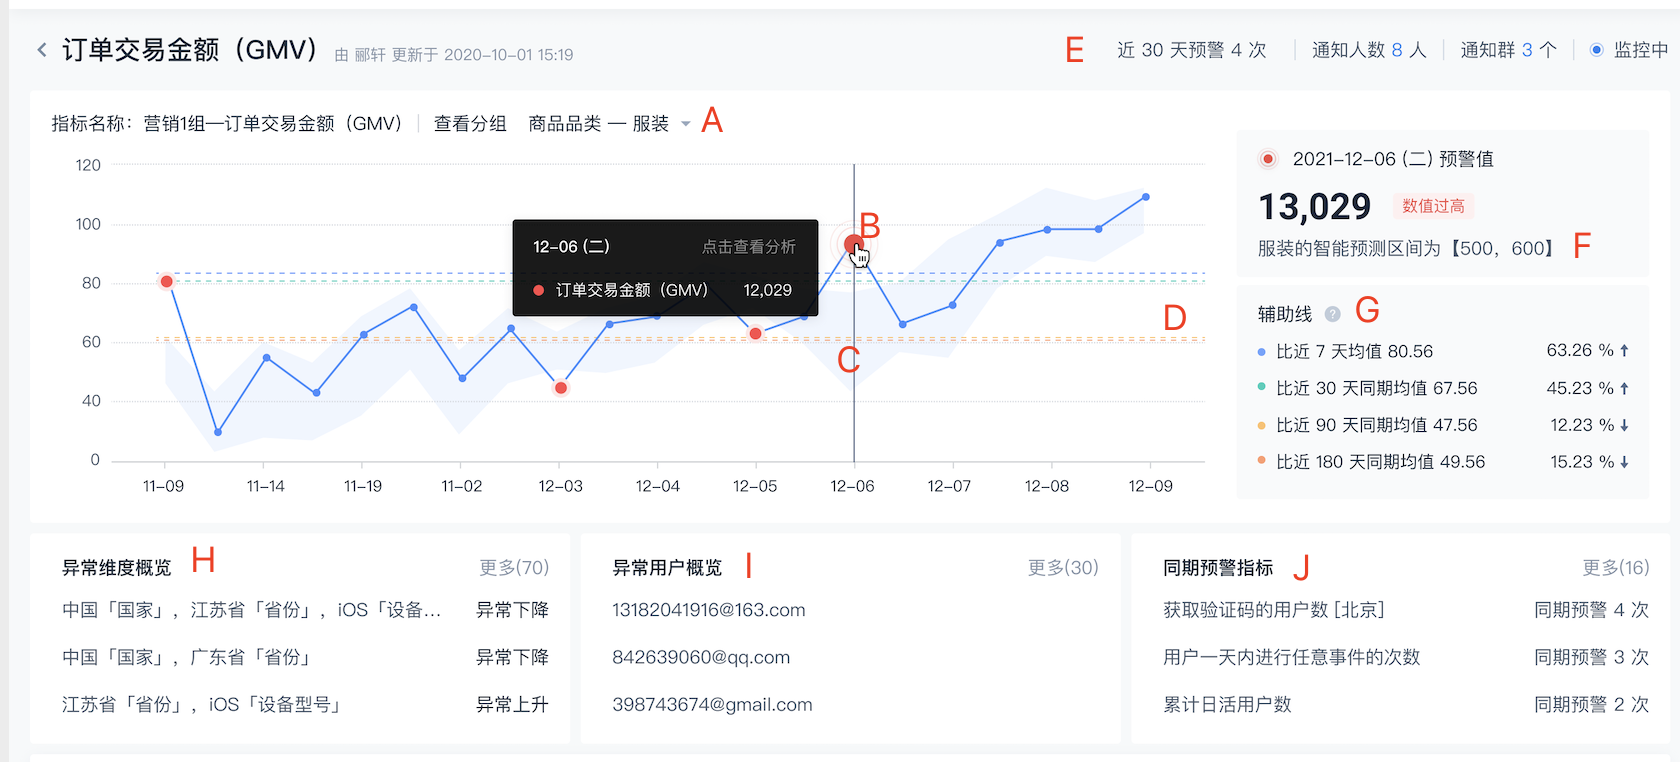
A: Alert indicators and groups; if the group setting is not for the overall, you can switch different groups by pulling down.
B: In the trend chart of indicators, the blue dot represents the normal value of the indicator, and the red dot represents the alert value of the indicator. Clicking on the red alert value and the blue normal value both support analysis.
C: When the alert mode is intelligent alert, in the trend chart, under each monitoring time point, it can produce the predicted data range for that time point based on historical data, and mark the data range with shadows. The alert points are abnormal values that are not within the predicted range.
D: If an alert occurs, in order to better explain the data anomalies of the alert point, the average of the past N days/the same period average is provided.
- Same period average: For daily alerts, the same period average is the average of the same day of the week in the past N days; for hourly alerts, it is the average of the same hour of the day in the past N days.
- The probability that the indicator value falls within the range of mean ± 2 standard deviations is about 95%. If the alert point exceeds the mean/period average ± two standard deviations of the past N days, the mean/period average auxiliary line will be displayed in the trend chart. If it does not exceed, the auxiliary line will not be displayed in the trend chart.
E: Relevant information of the indicator
- The number of times the indicator triggered an alert in the past 30 days
- Recipients, if an email address is set, the email addresses of the notified recipients are displayed
- Notification group, if a webhook is set, the names of the notified groups are displayed
- Remarks: Remarks information for the newly created alert
- Monitoring status: Monitoring, not monitored
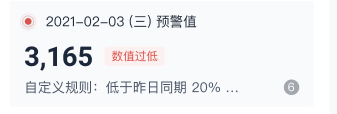
F: Alert reasons: Information about the triggered alert rules
- If intelligent alert is selected, the intelligent prediction interval for the current alert point is displayed
- If Custom warning is selected, the triggered warning rule is displayed.
G: Warning cause: auxiliary line information. Show the comparison between the mean of the last N days/the mean of the same period.
- By day: the average value of the last 7 days, the average value of the last 30 days, the average value of the last 90 days, and the average value of the last 180 days
- By hour: the average value of the last 3 days, the average value of the last 7 days, the average value of the last 14 days, and the average value of the last 30 days
H: Abnormal dimension analysis Overview: By default, compared with the same time last week, drill down the dimensions to show the top 3 abnormal dimensions that affect indicator volatility. An introduction to anomaly dimension analysis methods,See 3.2 for details
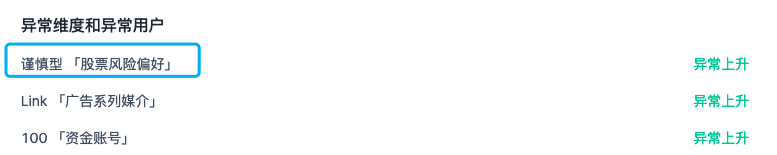
- As the chart above shows: cautious "equity risk appetite". Stock risk preference is the abnormal dimension, and caution is the abnormal dimension.
- For the early warning indicators, when the stock risk appetite is cautious, the abnormal influencing factors on the indicators are large.
I: Abnormal User overview: Displays information about the abnormal users whose performance counters are among the Top3 volatility factors at the current point in time. The user information can be the user's unique ID, IP and other user subjects, which can be customized by the user. An introduction to abnormal user analysis methods,See 3.3 for details
J: Concurrent warning indicator: the coincidence degree of warning points is matched with the current warning indicator. The matching method is as follows according to different warning monitoring granularity
- If the early warning monitoring granularity is: by hour, the early warning anomaly within 72 hours before the early warning point is matched.
- If the alarm monitoring granularity is set to by Day, the alarm anomalies within 30 days are matched before the alarm point.
Rank according to the number of warnings in the same period. Displays the top6 warning indicators for the same period. Details of the corresponding warning indicators,详情请见3.4
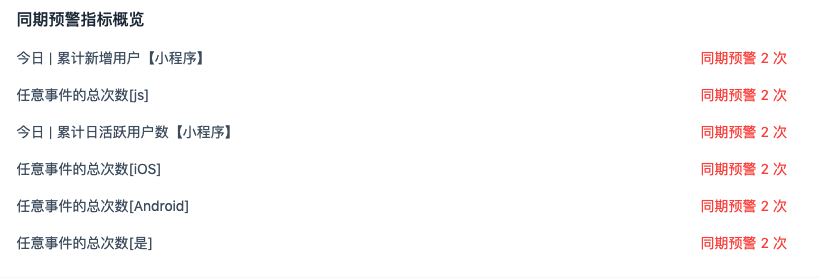
Note: The total number of times at any time [js], representing the meaning of: index value [group value]. If no group is set for warning indicators, only the indicator name is displayed.
4.2. Anomaly dimension analysis
4.2.1. Dimensional layering
Click Abnormal Dimension Analysis [Dimension Settings] to view all dimension layers of the current warning indicator. Dimension support: User attributes & Event attribute.
Q1: What is Dimensional Layering?
A1: Analyzing multiple dimensions in combination. For example, when analyzing screen width & screen height, it will explore the dimension values under the combination of these two dimensions. If there are n dimension values for screen width and m dimension values for screen height, it will iterate through n*m dimension combinations.
Q2: How to set up Dimensional Layering?
A2: 1. Dimensional layering can be generated automatically based on the dimensional analysis methods set in all the analysis models in the bookmark.
2. Users can customize the settings by adding layers in the "Dimension Settings". Layers support adding multiple user attributes and event attributes, and the order of multiple dimensional layers can be adjusted.
4.2.2. Normal Metric Dimensional Analysis
Q: What is a normal metric?
A: It calculates the statistics of a certain event and is classified as a normal metric.
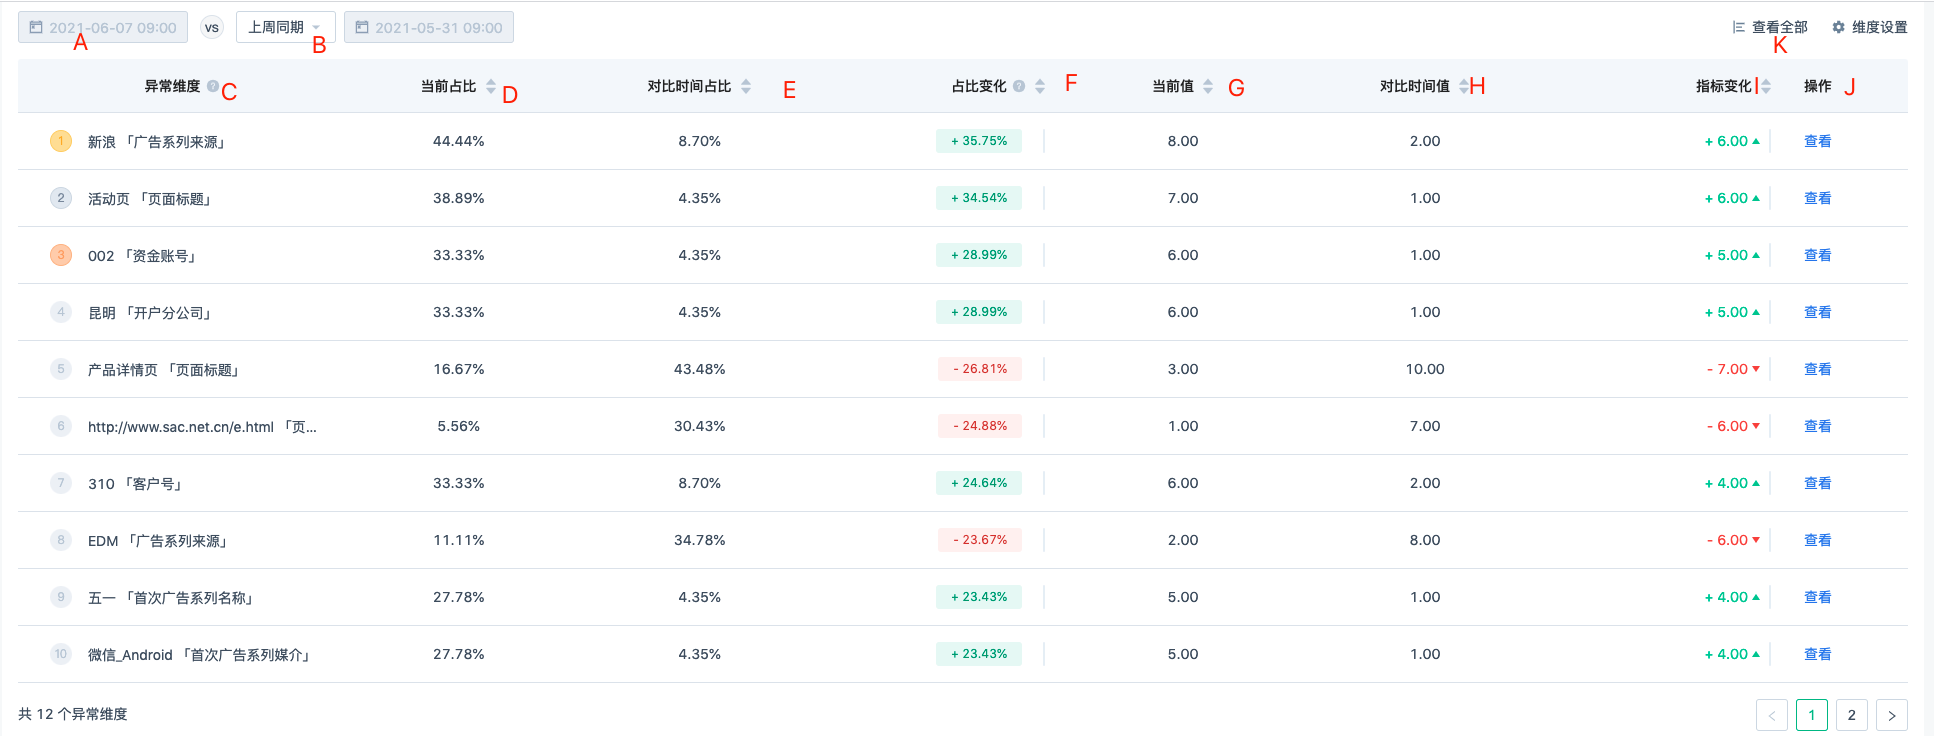
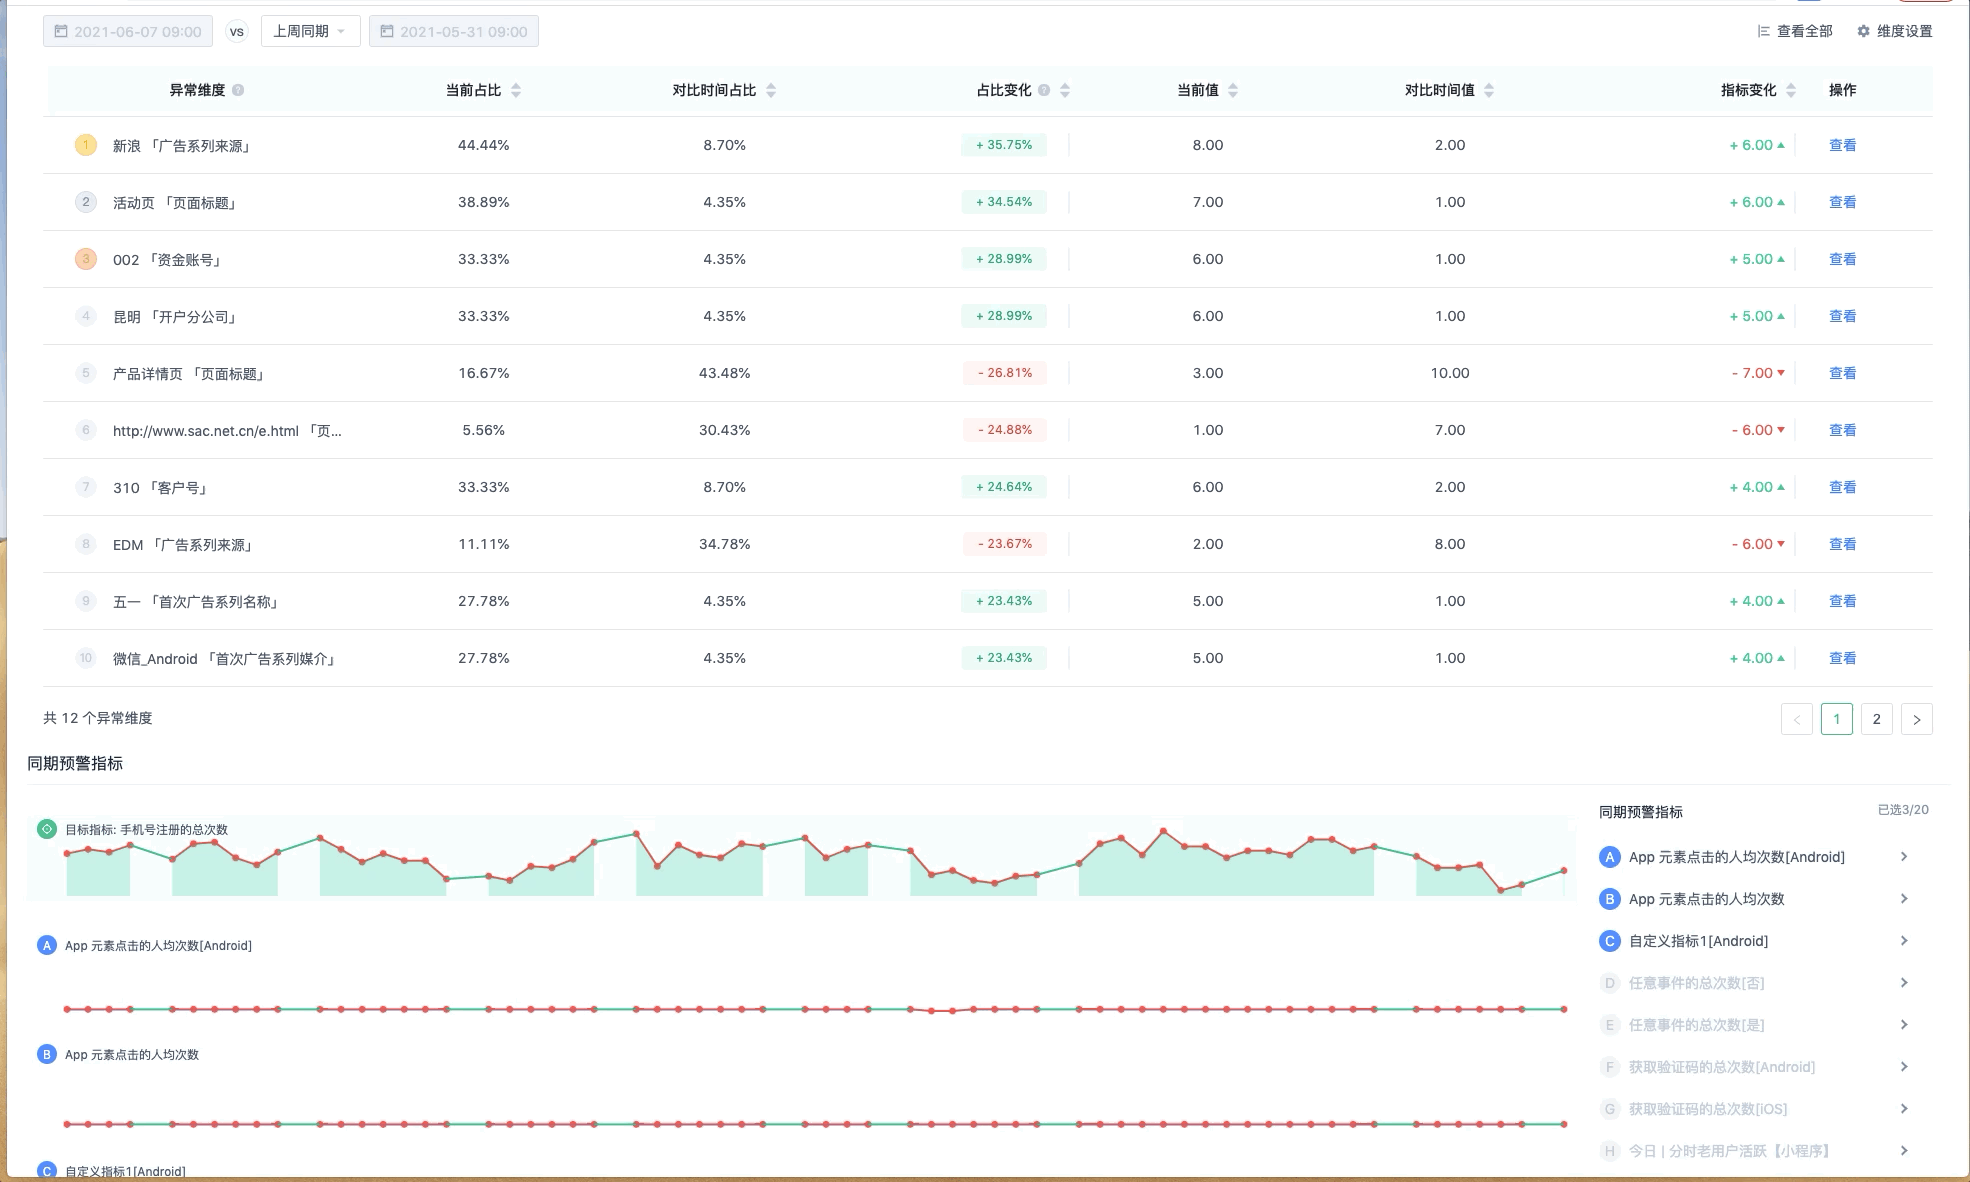
As shown in the above figure, it is the result of abnormal dimensional analysis of a certain warning metric.
A: Current alert point time: The monitoring granularity is hourly monitoring, and the selected alert point in the trend chart is 9:00 on June 7, 2021.
B: Comparison time: Default to the same period of the alert point in the previous week, which is 9:00 on May 31, 2021. Hourly monitoring supports comparing the previous hour and the same period of the previous day. Daily monitoring granularity supports comparing yesterday and the same period of the previous month.
C: Abnormal Dimension: Refers to the dimensions that have a significant impact on the overall metric change. For example, if "Advertising Campaign Source" is identified as an abnormal dimension of a Sina Weibo channel, it means that the channel with the advertising campaign source of Sina has a significant impact on the fluctuation of the warning metric.
D: Current Percentage: Represents the proportion of drilled-down abnormal dimension values at the current alert time point (as shown in the figure: 9:00 on June 7, 2021) to the "Warning Metric Value" at the "Current Time Point". As shown in the figure, when the "Advertising Campaign Source" is Sina, it accounts for 44.44% of the warning metric value.
E: Comparison Percentage: Represents the proportion of drilled-down abnormal dimension values at the selected comparison time point (as shown in the figure: 9:00 on May 31, 2021) to the "Warning Metric Value" at the "Comparison Time Point". As shown in the figure, when the "Advertising Campaign Source" is Sina, it accounts for 8.70% of the warning metric value.
F: Percentage Change: Current Percentage - Comparison Percentage. It is the change value of the proportion of abnormal dimensions.
G: Current Value: The metric value of the current abnormal dimension at the current alert time point (as shown in the figure: 9:00 on June 7, 2021).
H: Comparison Value: The metric value of the current abnormal dimension at the selected comparison time point (as shown in the figure: 9:00 on May 31, 2021).
I: Metric Change: Current Value - Comparison Value, representing the change value of the abnormal dimension.
J: Operation: Click to view, will jump to the warning indicator, drill down the dimension after the analysis page. As shown in the following figure, you can see the analysis under the current exception dimension.
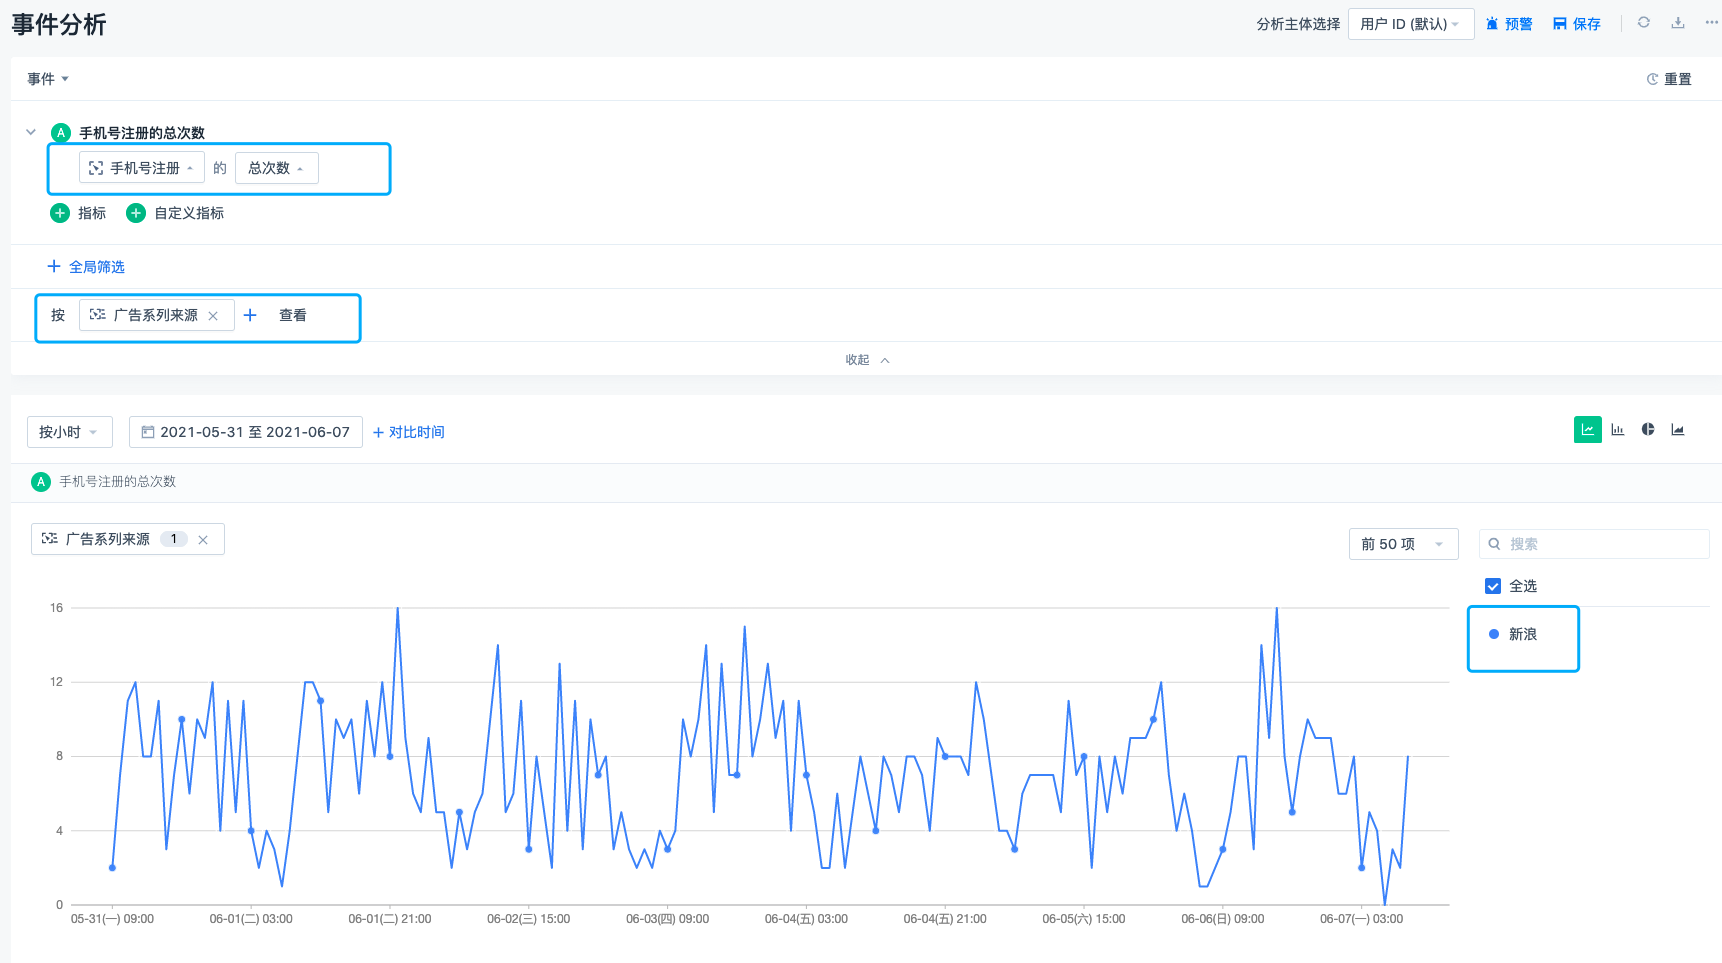
K: View all. Contains dimension analysis under the dimension hierarchy of all Settings. It includes the dimensions that are judged to be abnormal and all dimensions that are not found by dimensional analysis.
4.2.3. Abnormal dimension analysis of ratio index
Q: What is a ratio indicator?
A: Type A/B metrics, such as click-through rate, conversion rate, etc. If the indicators are classified as ratio indicators, the abnormal dimension analysis is carried out according to the ordinary indicators except the A/B indicators.
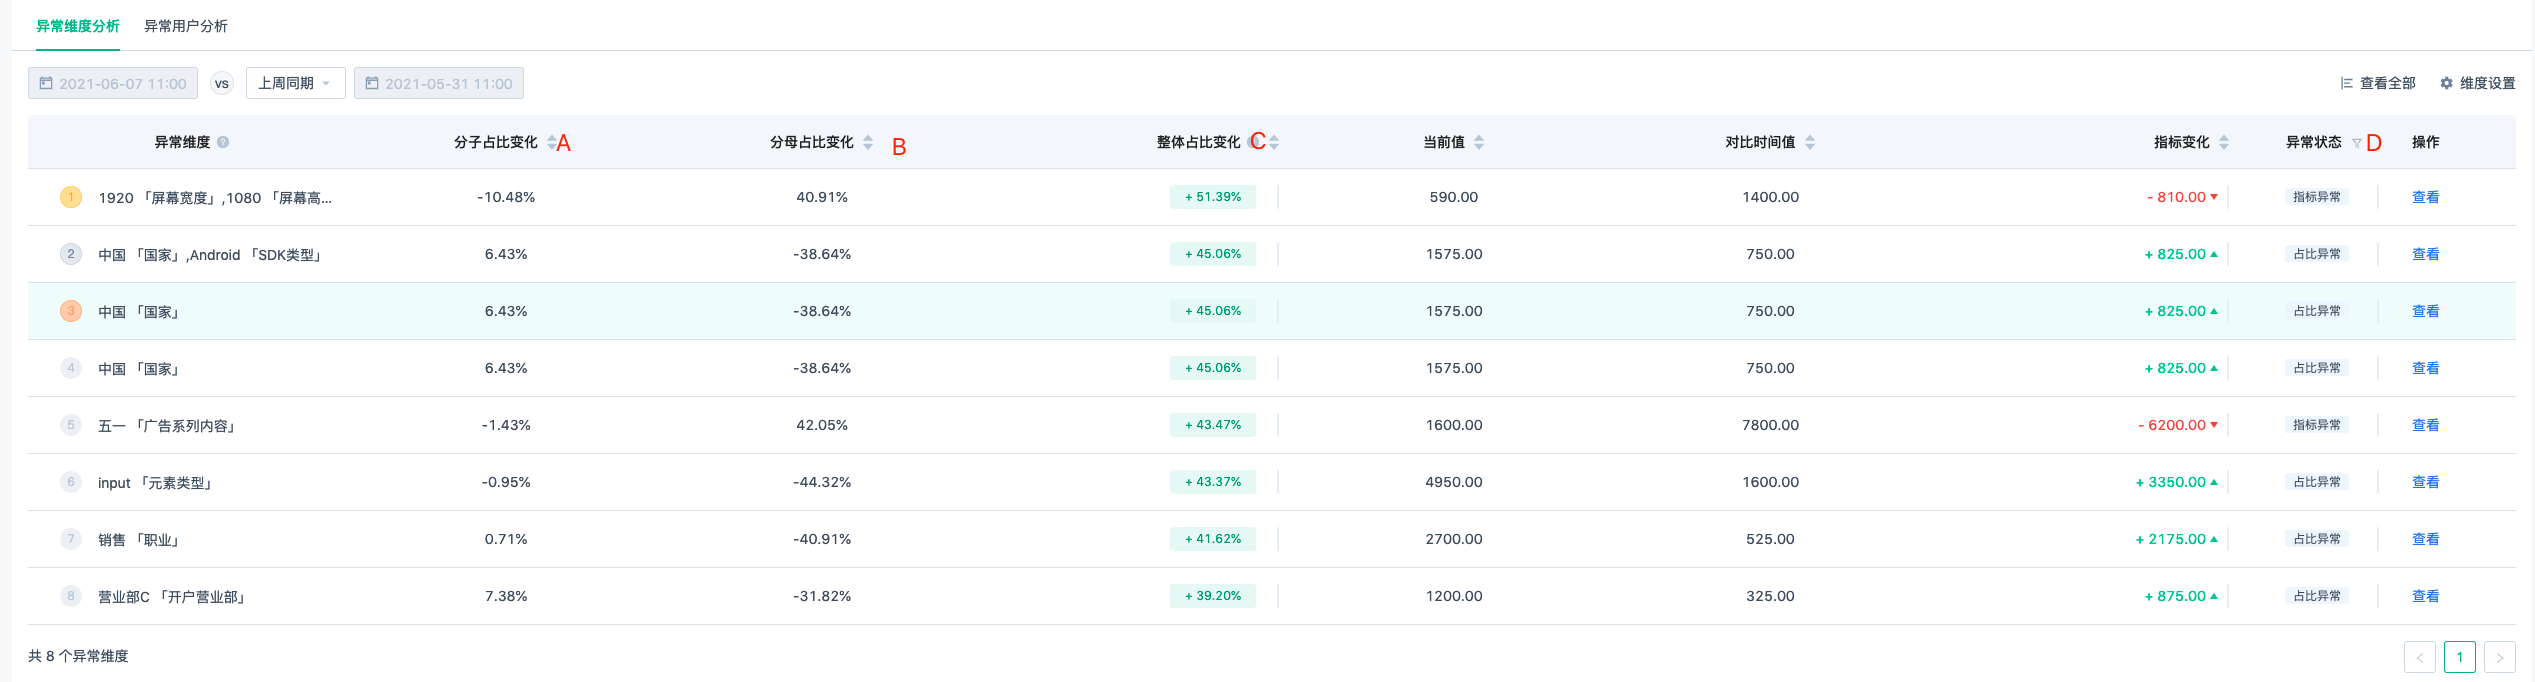
A: Molecular proportion change: for ratio type indicator A/B, the molecular proportion change is: the proportion change of the value of molecular A in the abnormal dimension to the overall indicator molecular A.
For example, at the current point in time, molecule A in the exception dimension1the proportion of warning index molecule A is A1/A, at comparison time, the abnormal dimension molecule A2the proportion of early-warning index molecule A 'is A2/A’. Then the proportion of the molecules changes to A1/A-A2/A’
B: Change in denominator proportion: For ratio indicator A/B, the change in denominator proportion is the change in the proportion of the value of denominator B in the anomaly dimension to the overall indicator.
For example, at the current point in time, the denominator of the exception dimension is B1The proportion of the denominator B of the early warning index is B1/B,In comparison time, the denominator of the anomaly dimension B2The proportion of the denominator B 'of the early warning index is B2/B’. Then the proportion of molecules changes toB1/B-B2/B’
C: Overall proportion change: proportional index A/B, the proportion change is the absolute value of the change in the numerator proportion minus the change in the denominator proportion
D: Abnormal status: Indicators are abnormal or the ratio is abnormal.
- Indicator abnormal: If the indicator value after the current drilling down dimension, the indicator change (refers to the change of the current value and the comparison time value) exceeds the overall indicator change value, it is judged as an indicator abnormal.
- Abnormal proportion: If the index value after the current drilling down dimension has no significant change in the index change (refers to the change of the current value and the comparison time value), but the overall proportion change fluctuates greatly, it is judged to be abnormal proportion.
For example, ratio indicators such as click-through rate, the click-through rate with the down-drilling dimension of "Beijing" has no change in the index value under the current value and the comparison time value, but the proportion of numerator and denominator has a large fluctuation overall, and it is judged to be an abnormal proportion.
4.3. Abnormal user analysis
The user behavior of brushing, cheating and pulling wool is endless. The behavior of a large number of abnormal users leads to abnormal data fluctuations.
In the advertising industry, abnormal users bring a lot of cheating traffic, which makes the advertising enterprises suffer losses.
Operation and promotion activities, there are sheep wool users, through abnormal methods, to obtain a large number of non-compliant income.
Enterprise product functionality is incomplete, which can also cause abnormal user operations and abnormal data problems.
Anomalous user analysis, through the user behavior [g122]distribution analysis method[/g122], locates anomalous user subjects.
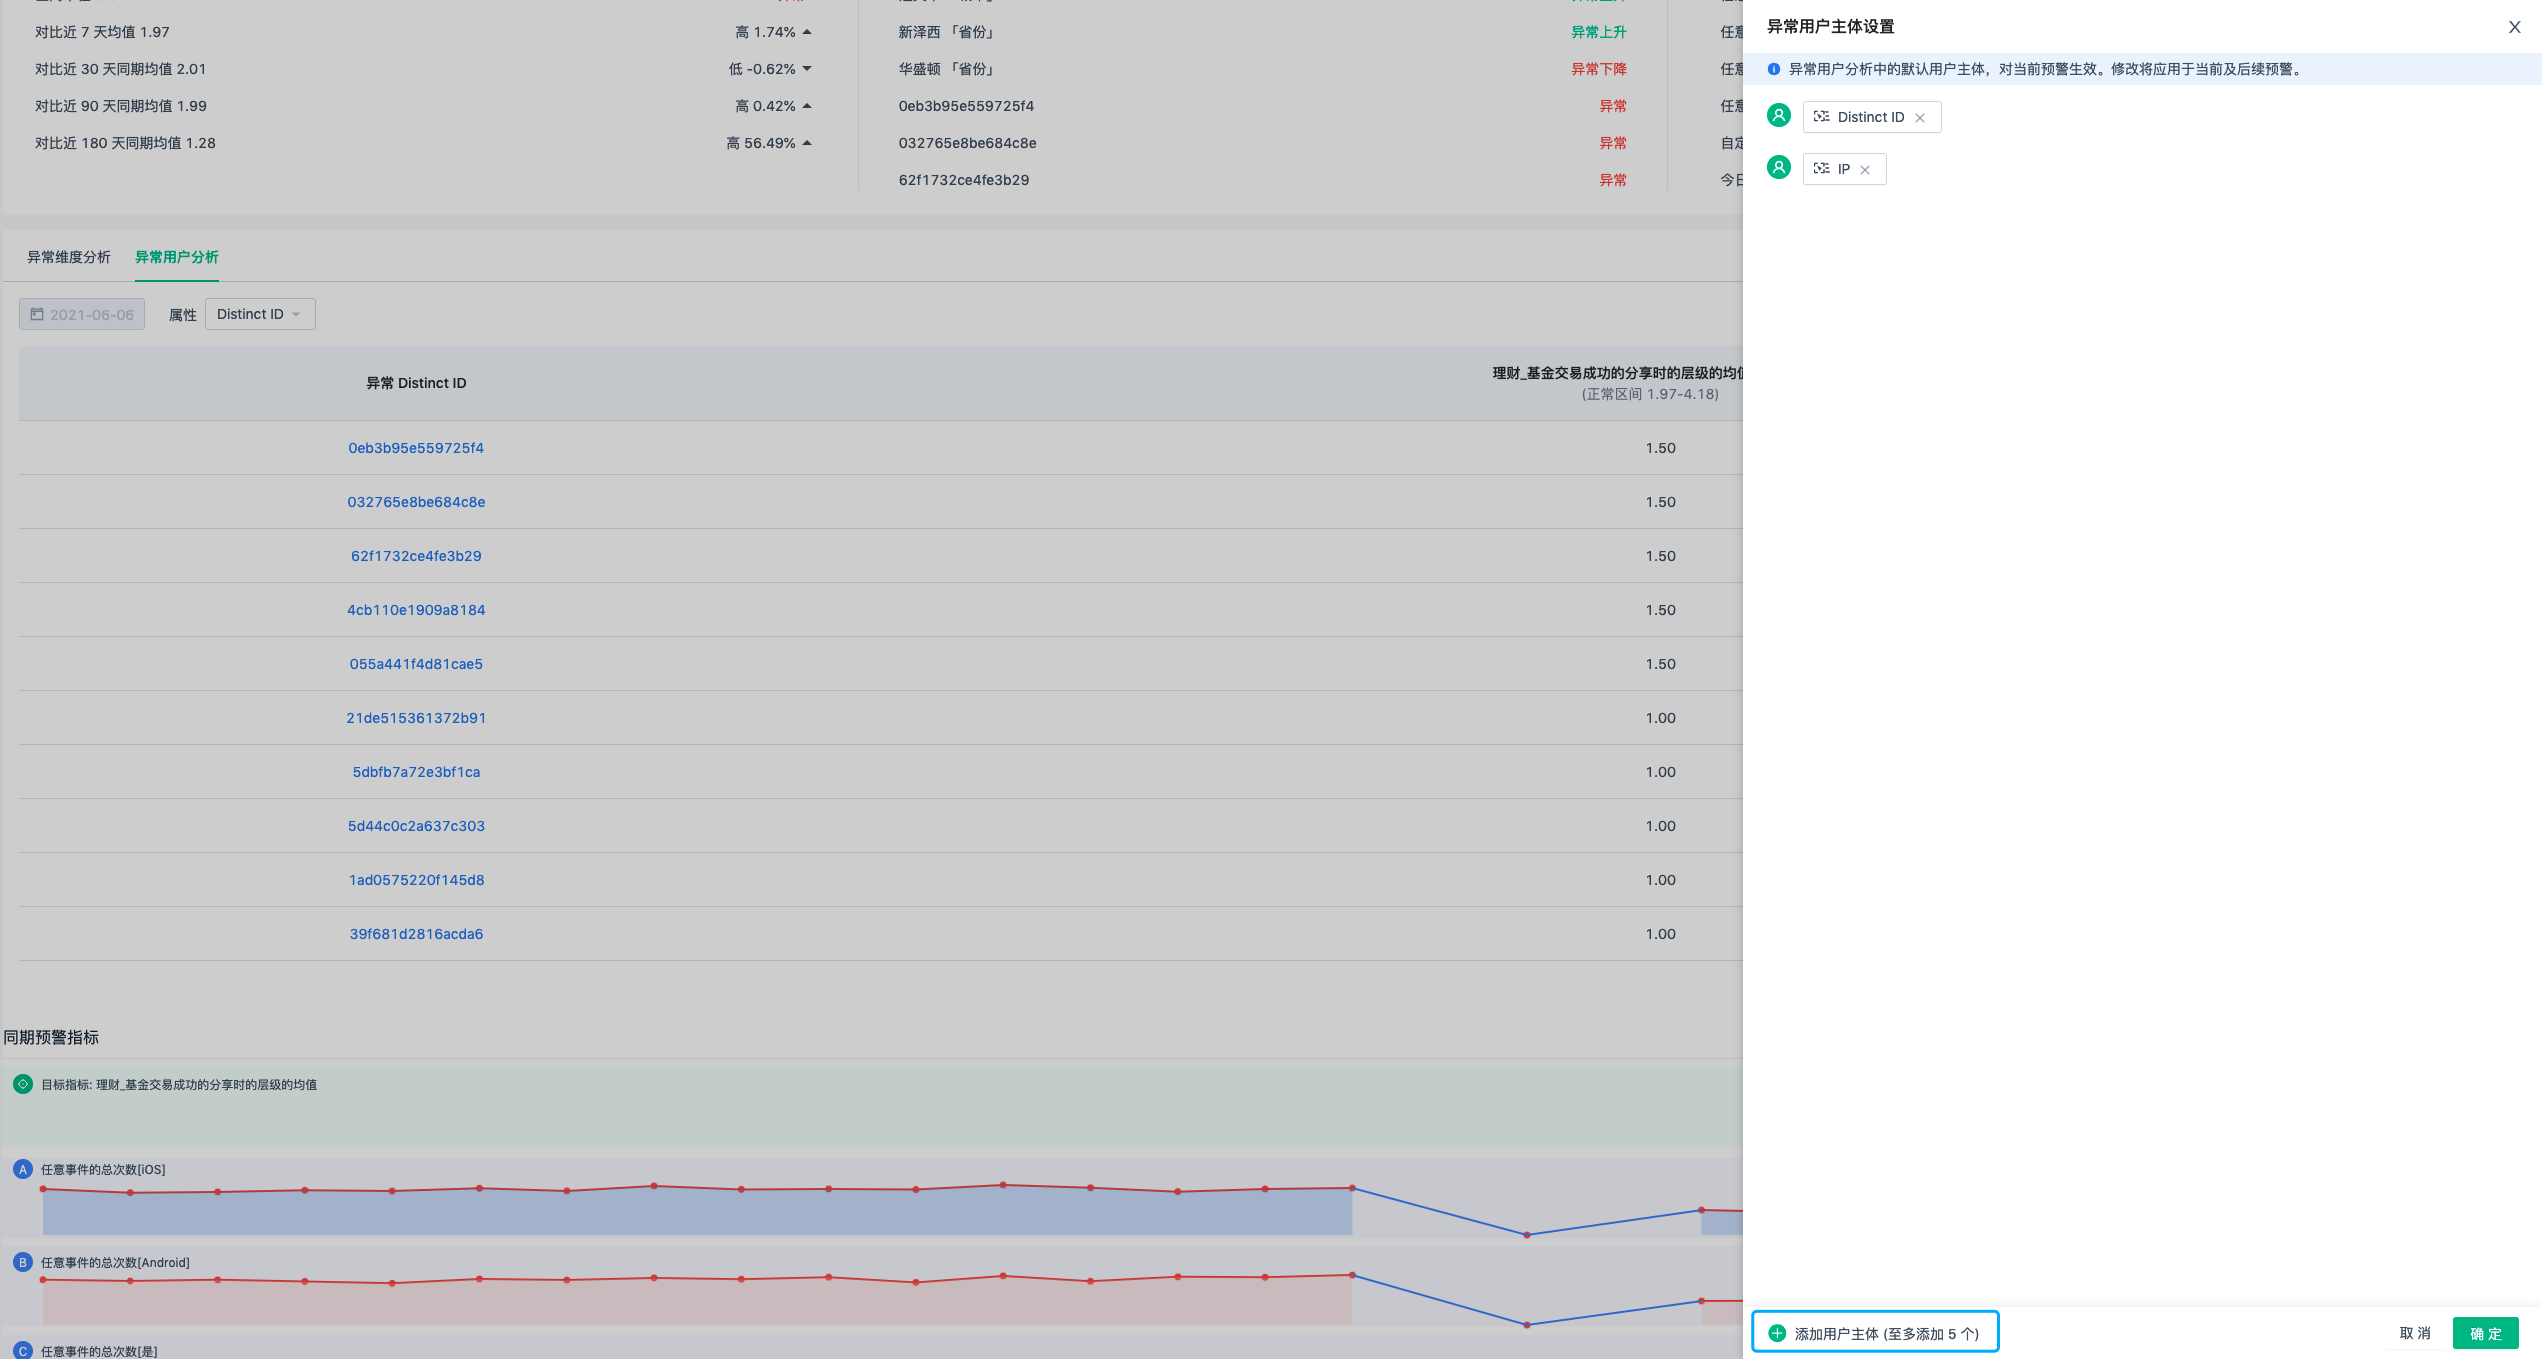
4.3.1. Subject settings
By default, Distinct ID and IP are added as user subjects, and up to 5 event attributes can be added. Custom user subjects can be defined based on user behavior analysis.
4.3.2. Anomalous user analysis for ordinary metrics
Q: What are ordinary metrics?
A: The statistical method of calculating a certain event, classified as an ordinary metric.
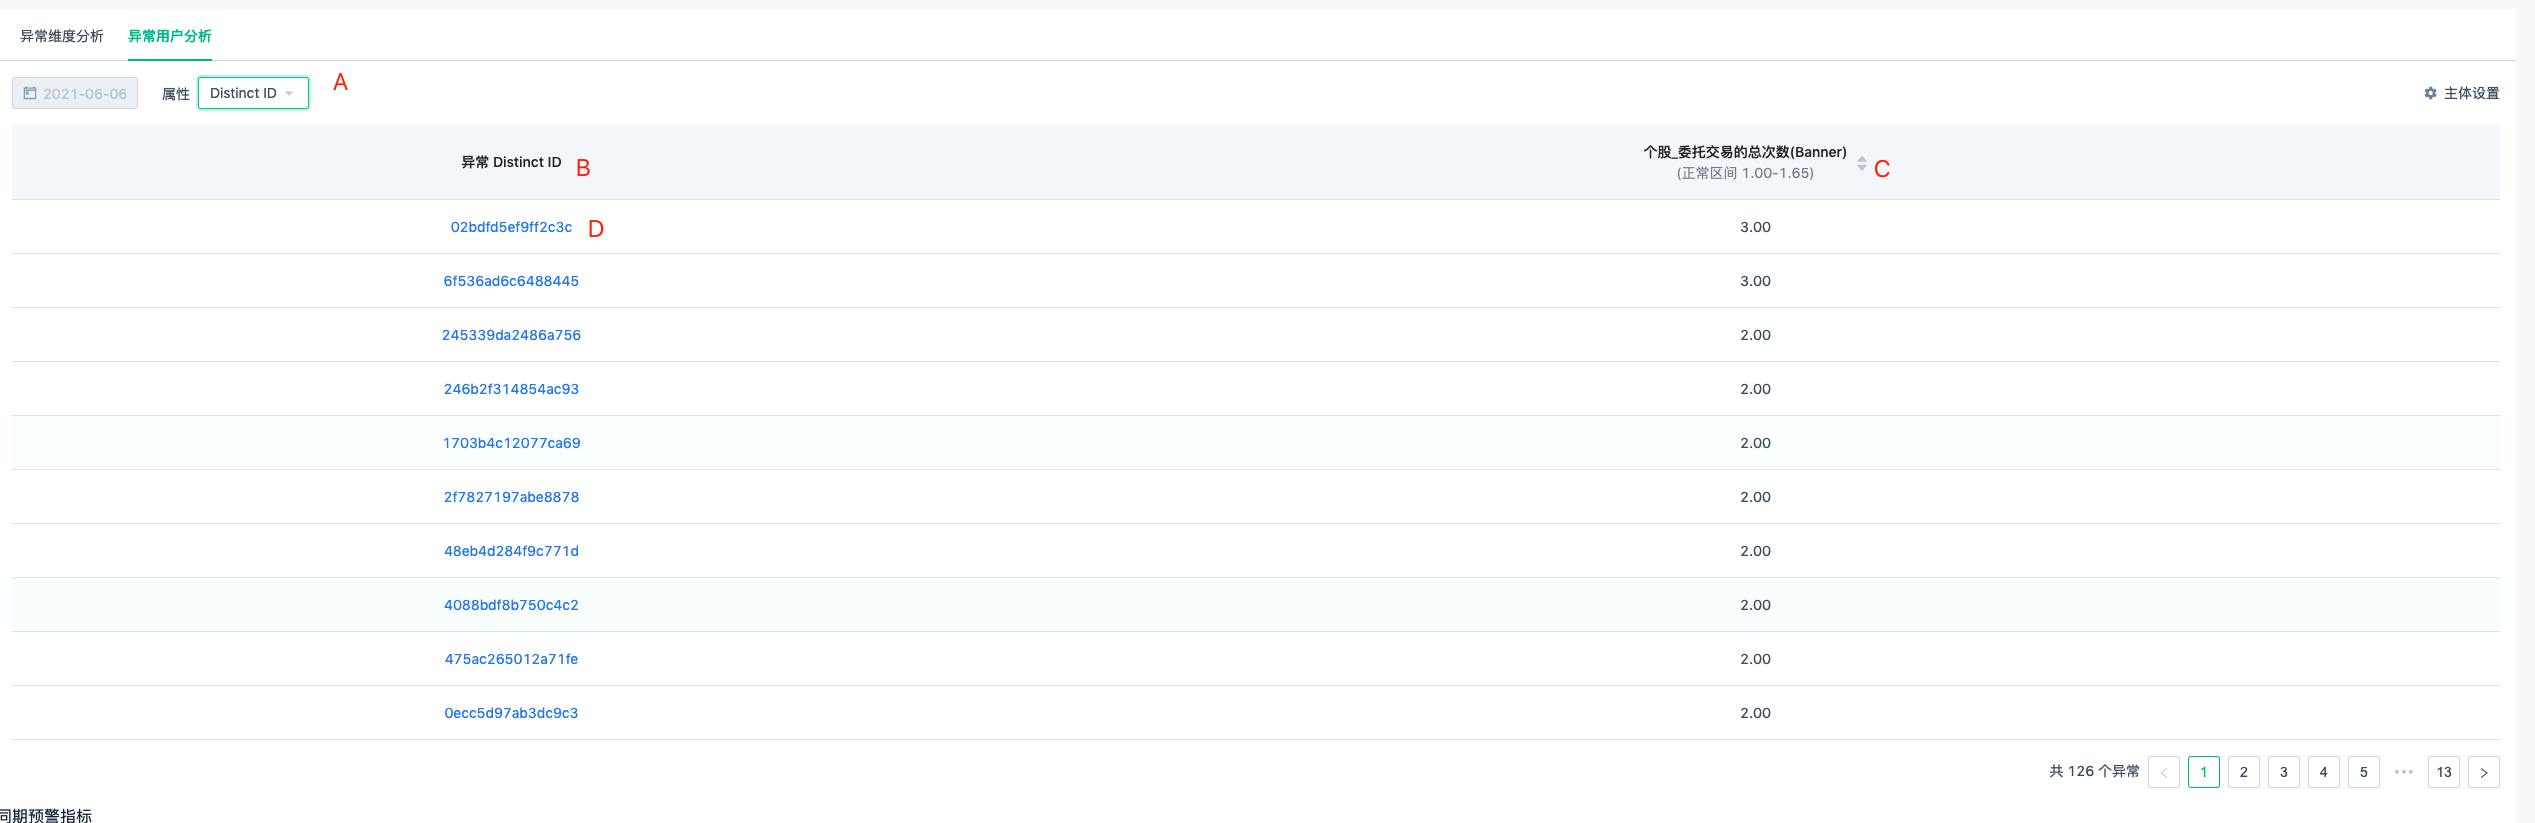
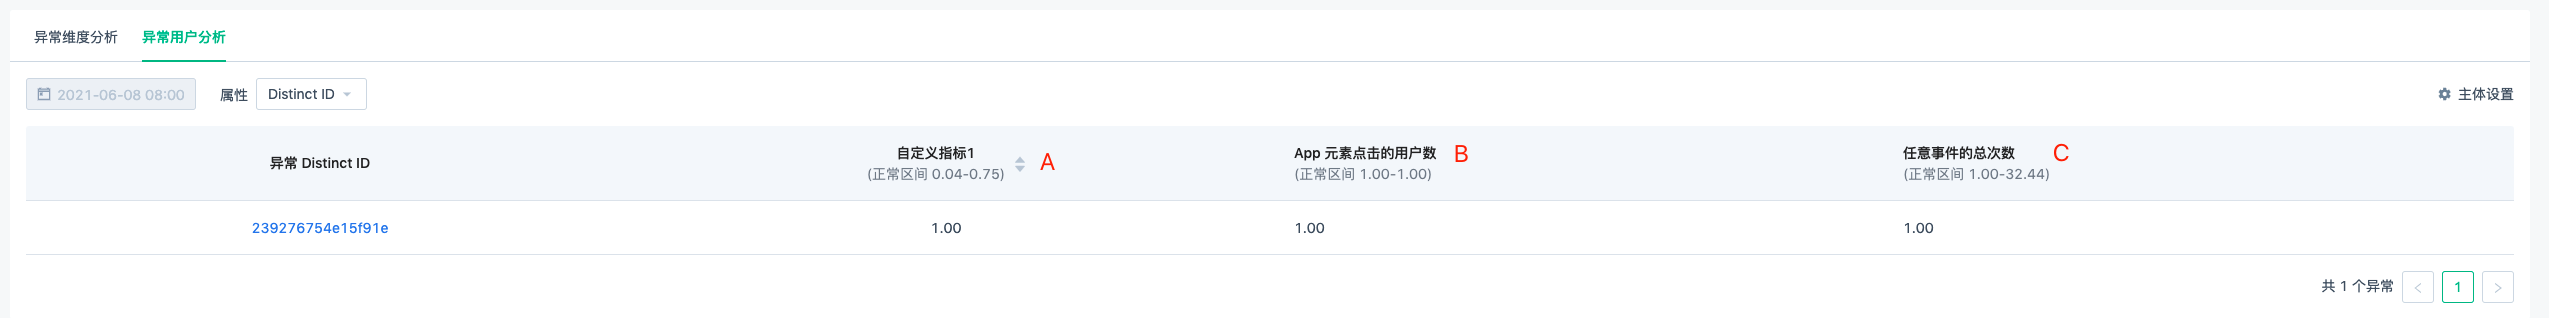
A: Switch different user subjects from the dropdown to view anomalous user information.
B: Anomalous user list
C: The normal range of warning metrics, and the metric values of each anomalous user in the current event statistical analysis. Note: Anomalous user analysis assumes that the user behavior distribution follows the distribution analysis. If the user's behavior is more than 3 times the standard deviation above the mean, it is considered an anomalous user.
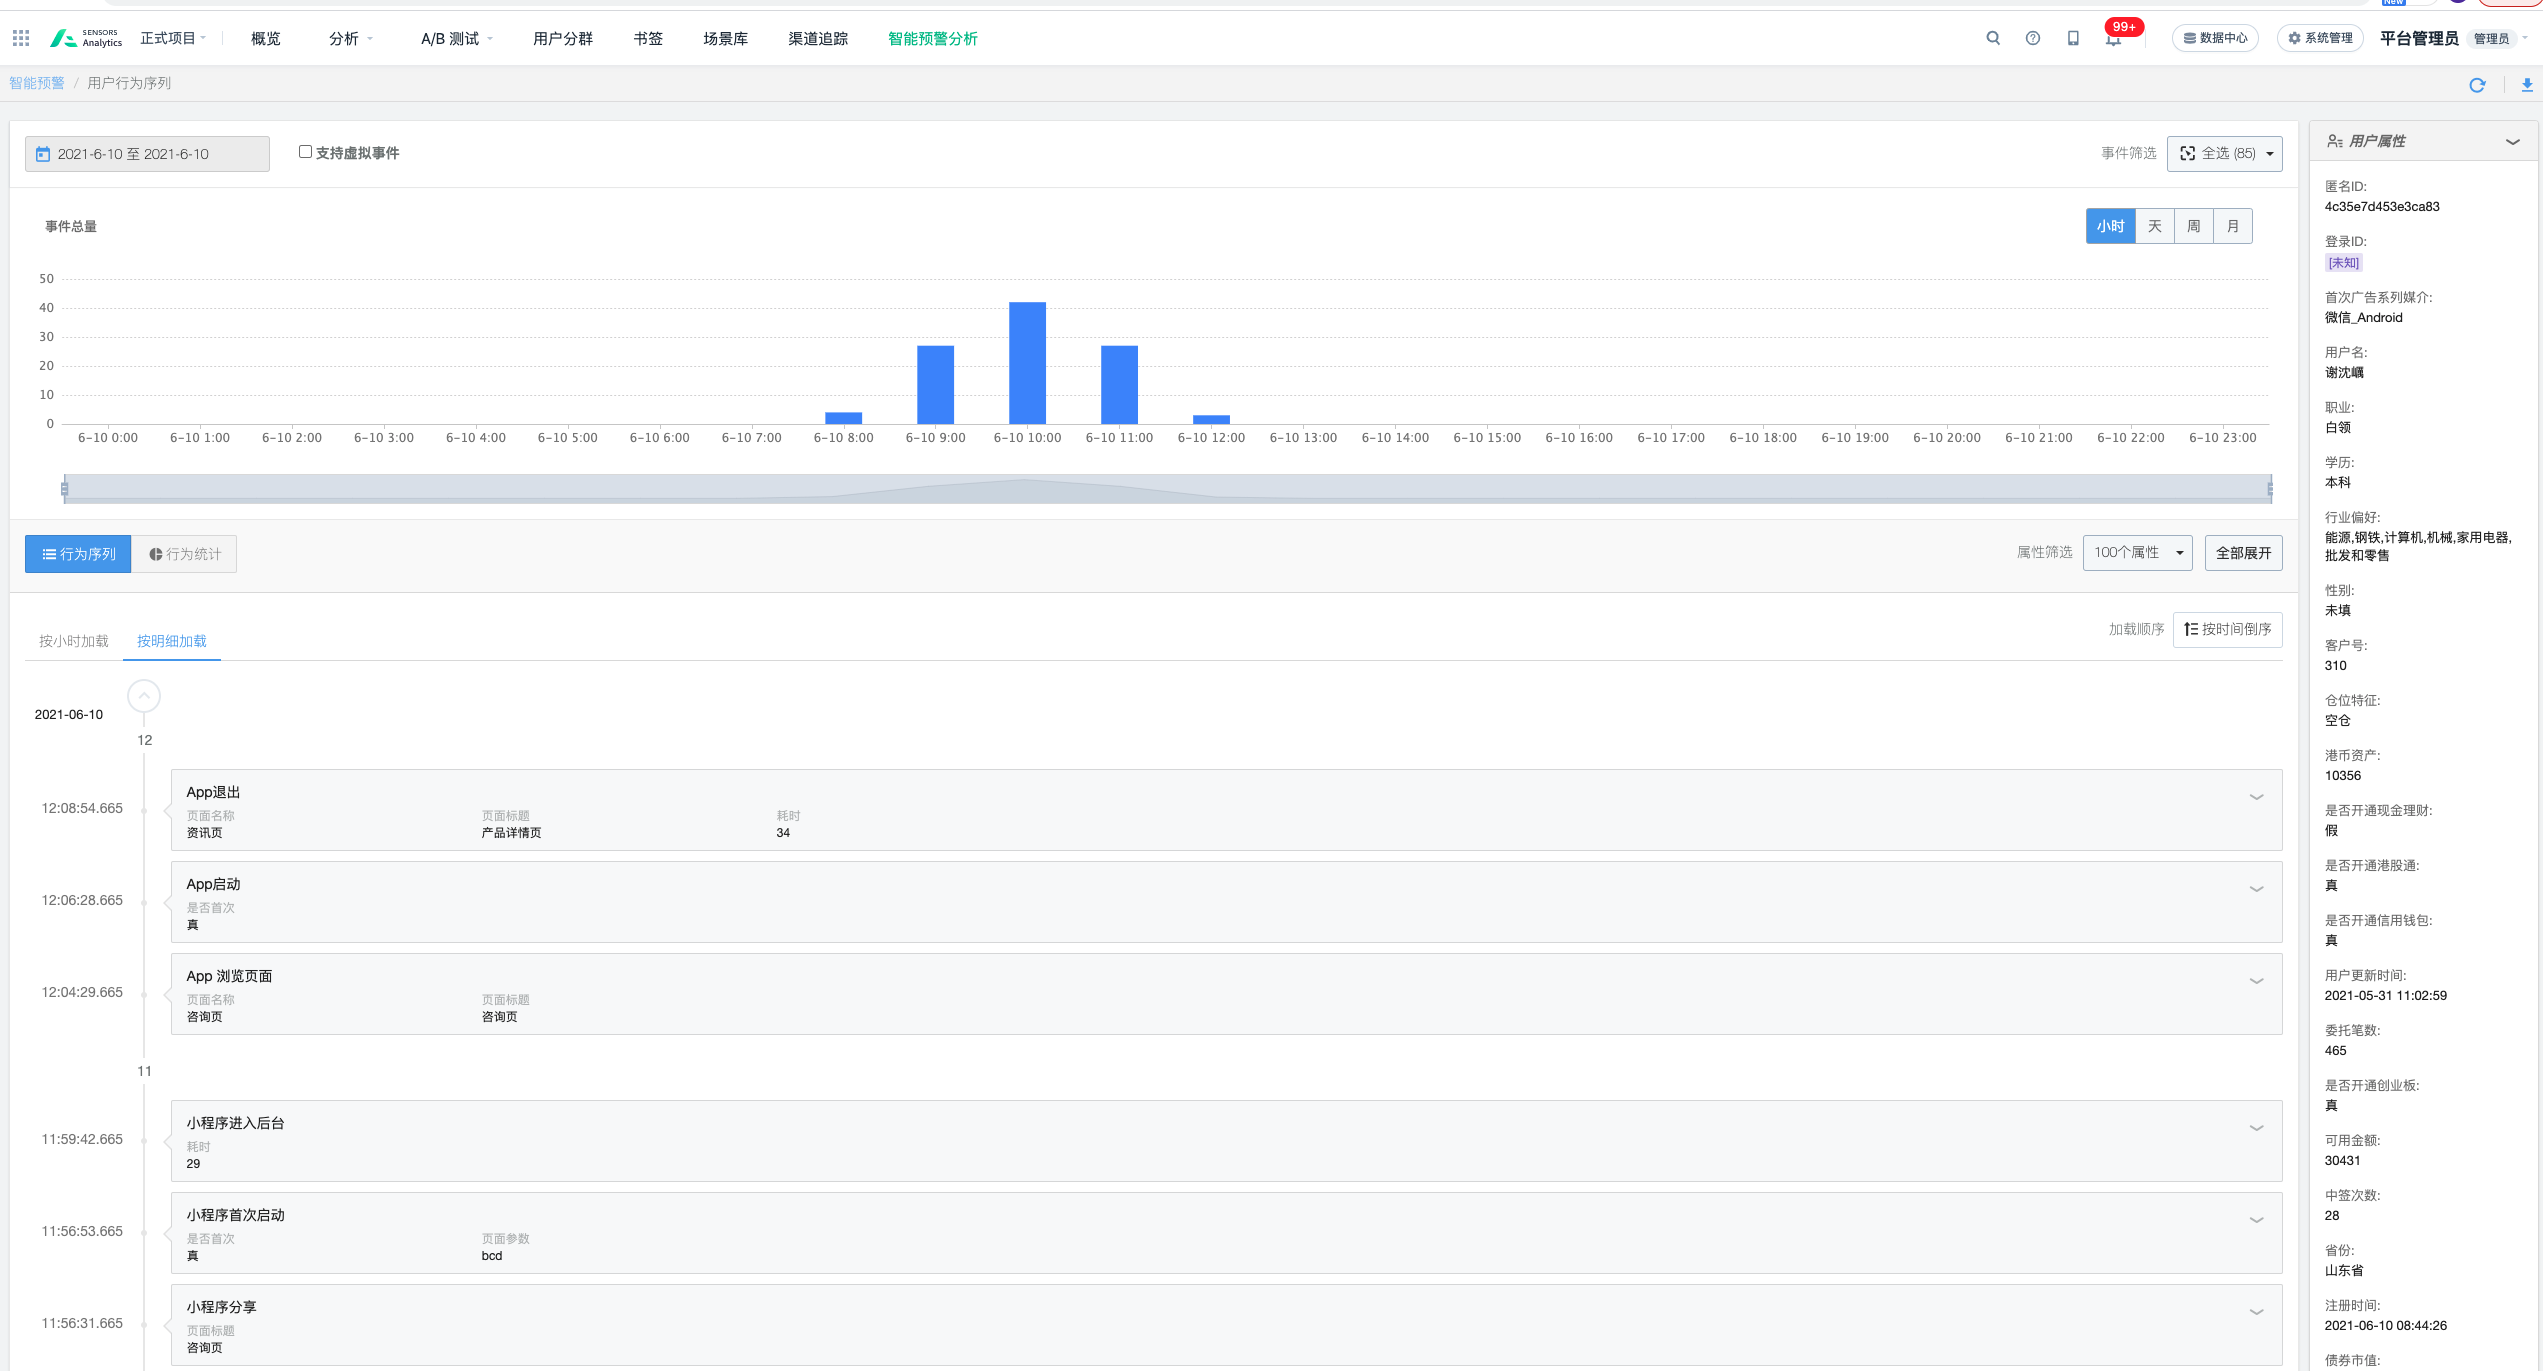
D: User ID, blue supports clicking to jump to user behavior sequence. The user's anomalous behavior can be further located.
4.3.3. Abnormal user analysis for ratio metrics
Q: What are ratio metrics?
A: A/B type metrics, such as click-through rate, conversion rate, etc., are classified as ratio metrics. Other metrics except A/B types are analyzed as ordinary metrics.
A: The normal range of A/B metrics, and the values under the current anomalous user.
B: The numerator in the A/B metric, the normal range, and the value of the numerator for the current abnormal users.
C: The denominator in the A/B metric, the normal range, and the value of the denominator for the current abnormal users.
Through the range of A/B, A, and B metrics, based on the Multivariate Gaussian distribution, abnormal users can be identified.
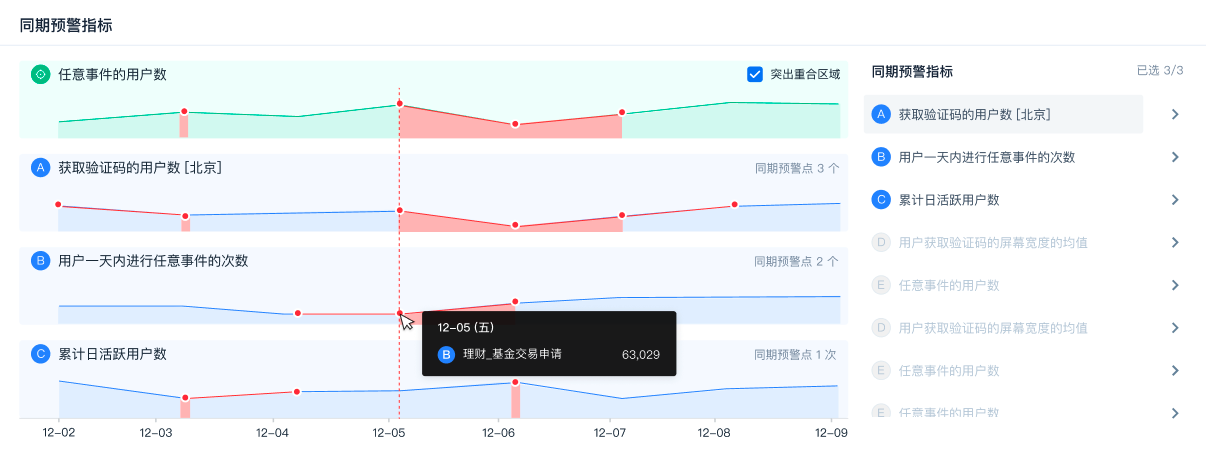
4.4. Periodic warning indicators.
As shown in the figure below: you can see which warning indicators are also in the warning period with other warning indicators (vs. the current warning indicators). The overlap of the warning time between other warning indicators and the current warning indicators is displayed, and they are sorted by the degree of overlap.
You can view warning indicators with high overlap, click the list of periodic warning indicators, and jump to the warning analysis page.
If the overlap between different indicators in the warning period is high, it means that the two indicators have an impact on each other in the business. This can help troubleshooting and problem identification.
4.5. Indicator correlation analysis.
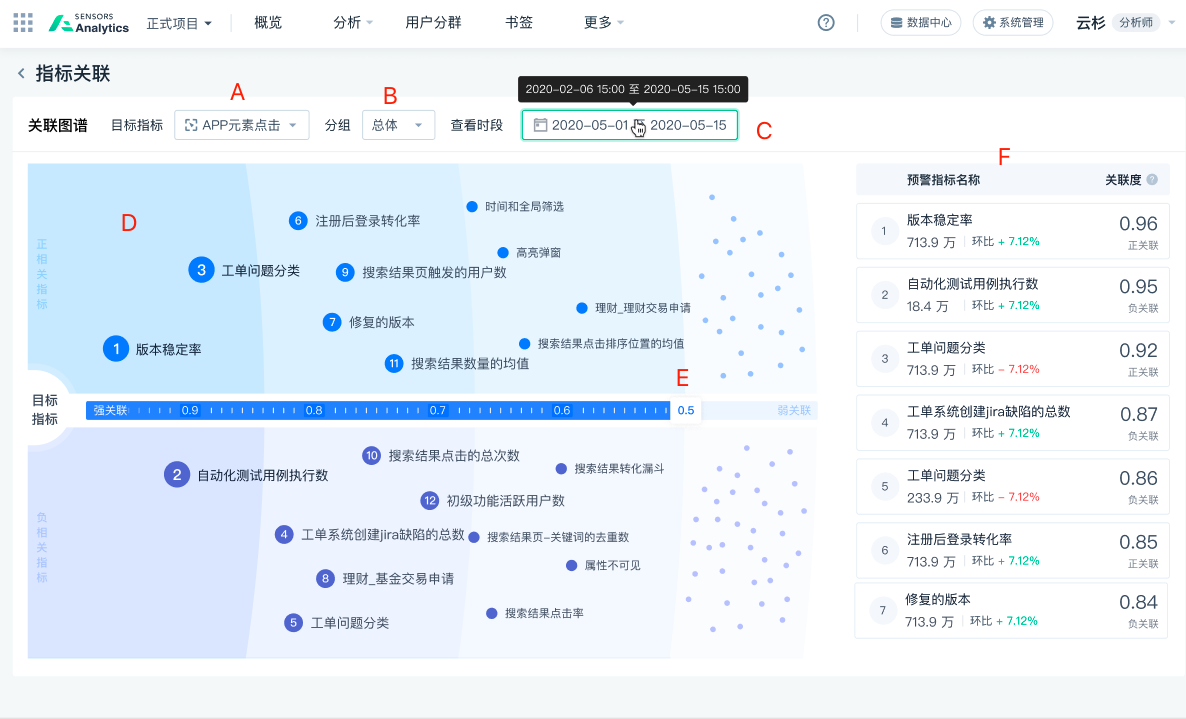
A: Select the "Target Indicator" from the dropdown list.
B: Select the "Group" for correlation analysis from the dropdown list.
C: Select the "Period" for correlation analysis from the dropdown list.
D: Display of correlation analysis.
- Vertically, indicators that are positively correlated with the "Target Indicator" are in the blue area above the correlation scale; indicators that are negatively correlated with the "Target Indicator" are in the purple area below.
- Horizontally, the distance from the indicator to the target indicator represents the strength of the correlation between the indicator and the target indicator. The closer the distance, the stronger the correlation, and the number represents the sorting of the correlation strength.
E: The length of the correlation scale can be adjusted to control the range of correlated indicators displayed.
F: The specific "Value", "MoM" (month-on-month change), and "Correlation" of each correlated indicator are displayed in detail in the right column. Clicking on the correlated indicator will jump to the "Intelligent Alert Analysis" page of that indicator.
5. Alert management.
5.1. Alert list.
Note: On this page, you can view the monitoring status of the alert, the last alert triggered time and the creator information. Members with warning rights can view alerts created by others. Regarding authority management,See 5 for details
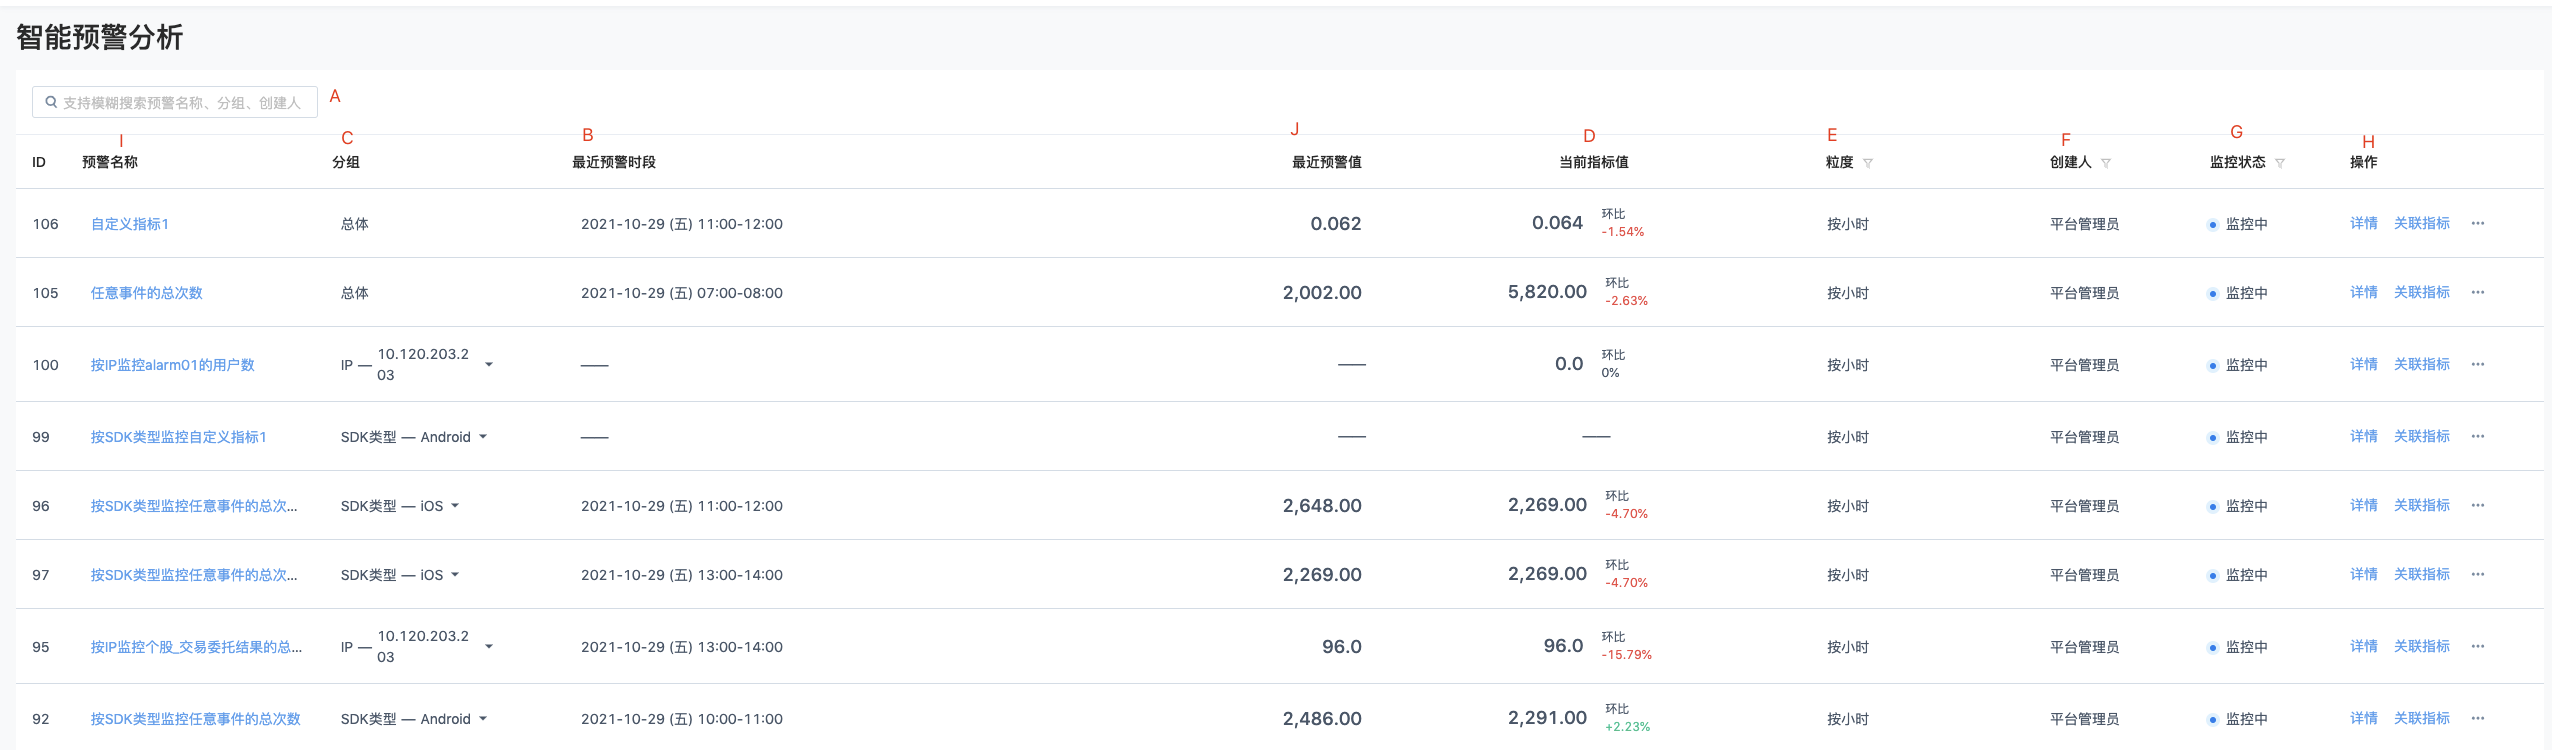
A: Support fuzzy search warning name, group, creator.
C: Warning group. You can select a group from the drop-down list. After the group is switched, the latest warning period, latest warning value, and current indicator value of the corresponding group are displayed.
B: Displays the period of the latest warning.
J: Latest warning value: indicates the warning value of the latest warning period.
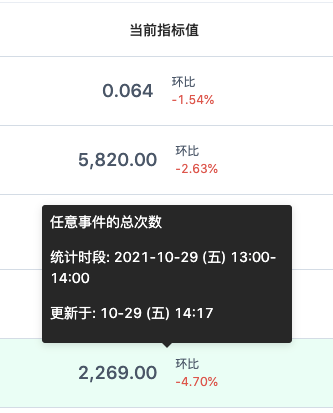
D: Indicator value, showing the indicator value of the group and the chain. hover displays [indicator name], [statistical period] and the last [update time].
- By hour, the indicator value is the data of the last hour. For example, if the current point in time is 14:20, the indicator value is 13:00-14:00
- By day monitoring, the index value is yesterday's data, such as the current 06-08 (2), the index value is the value of 06-07 (1)
E: Granularity, which can be set to by hour or by day.
F: Founder, you can filter the founder.
G: Monitoring status. You can select Monitoring or Not Monitoring.
H: Operate, Includes view smart alerts[Details] Analyze , view[Associated index] Analytics and use[View search conditions] Jump to the warning indicator event analysis, and[Edit warning].
I:Click on the warning name to jump directly to【 Details 】 Analysis page.
5.2. View search conditions
Click [View query conditions] in [Warning Management] to jump to the [Event analysis] interface of the warning.
5.3. Editorial warning
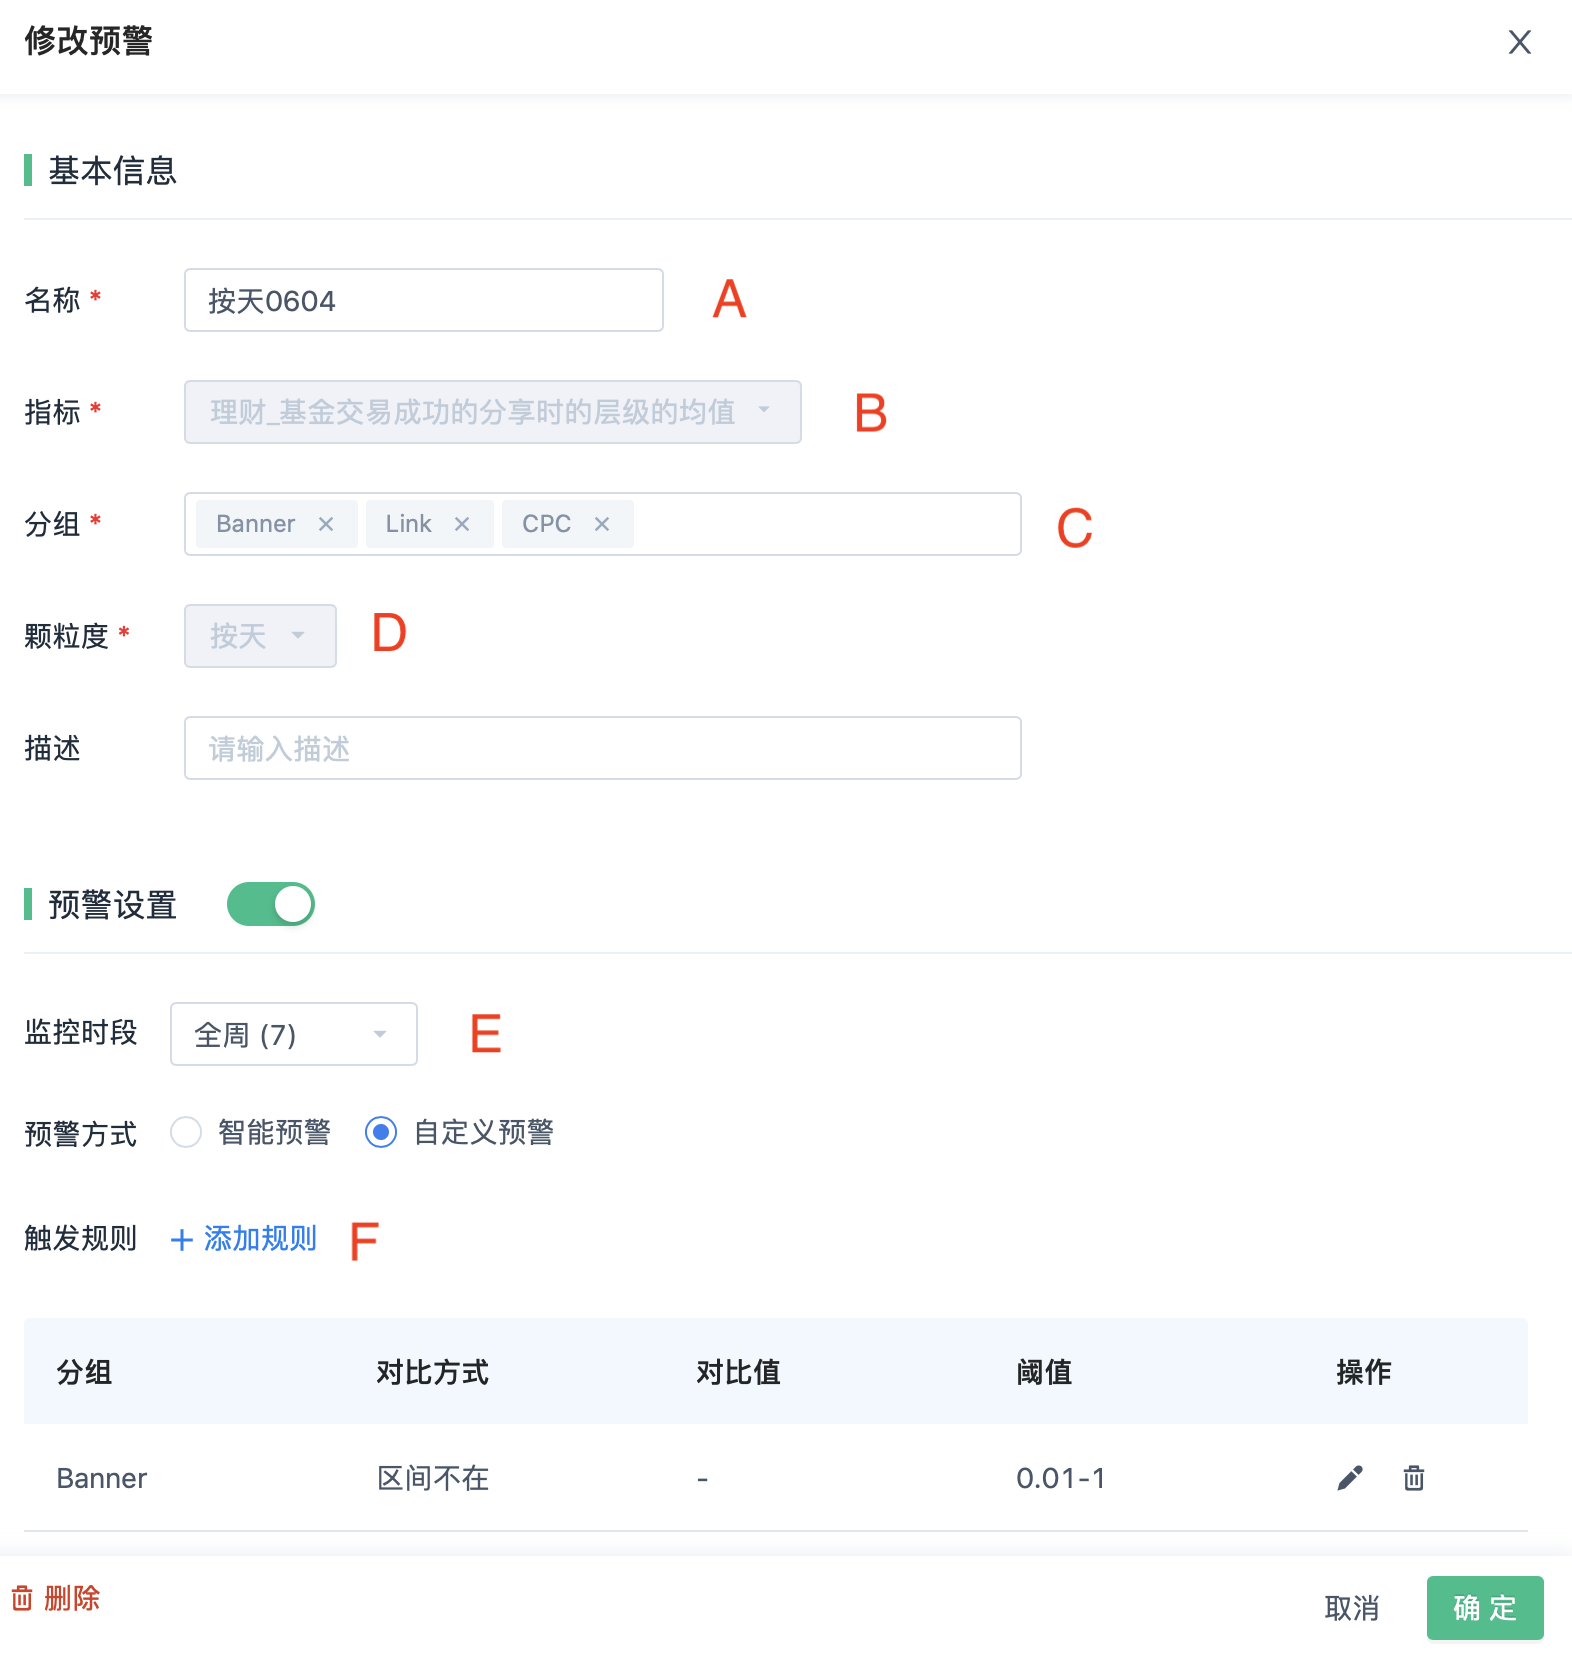
A: The [*] name can be modified.
B: The [*] cannot be modified.
C: If the grouping is "all", it cannot be changed; if the grouping is not "all", you can add or delete groups, but modifying the group value will clear the alert records of the warning metrics.
D: If the warning method is "intelligent alert", you can change the [*] granularity; if the warning method is "custom alert", you need to clear all the custom [*] trigger rules before you can change the granuality. Changing the [*] granularity will clear the alert records of the warning metrics.
E: The monitoring period can be modified.
F: Modifying the [*] trigger rules will clear the alert records of the warning metrics.
Note: Changing C, D, or F will clear the alert records of the warning metrics (including historical alert points and intelligent analysis conclusions), and will prompt and confirm whether to change after clicking confirm.
5.4. Enable/Disable Alert

A: Click to enable/disable the alert on the [*] page.
5.5. Delete Alert
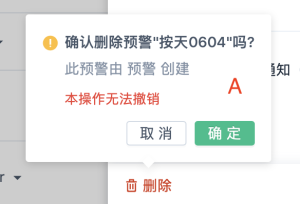
A: Click "Delete" at the bottom left of the [*] page and click "Confirm" in the pop-up window to delete the alert.
6. Permission Management
The intelligent alert analysis includes viewing, adding, and global management permissions.
| Functionality | Operation | Data Range |
|---|---|---|
| Intelligent Alert Analysis | View Alerts | View "self-created" alerts and "acceptable email notification" alerts. |
| Create Alert | Can create new alerts and edit, delete self-created alerts | |
| Global Manage Alerts | Can "view, edit, delete" all alerts within the available scope |
Note: The user whose email address is included in the "acceptable email notification" recipient address can view the intelligent alert analysis.
The default permissions for the four roles are as follows:
Role | Intelligent Alert - View | Create | Manage |
|---|---|---|---|
| Administrator | |||
| User Analyst | |||
| Developer | |||
| Normal User |
Note: The content of this document is a technical document that provides details on how to use the Sensors product and does not include sales terms; the specific content of enterprise procurement products and technical services shall be subject to the commercial procurement contract.
 Popular Searches