Dashboards
|
Collect
To better meet the needs of enterprise data management and personal data analysis scenarios, the dashboards is divided into "team dashboards" and "my dashboards". Both types of dashboards have the same usage and function, and different operations are provided only for management due to different permissions. The following will be explained one by one.
1. Video Explanation
Dashboards Management Video Explanation
Dashboards Creation Video Explanation
Preset dashboards Video Explanation
2. My Dashboards
My Dashboards is mainly used by members to save frequently used analysis results and form a data dashboards that is easy to view. At the same time, users can share their dashboards with other members of the team to share analysis results. It should be noted that the data result will be displayed according to the data permission range of the other members.
3. Team Dashboards
Team Dashboards is mainly used for managing important dashboards that need to be shared by the enterprise, creating a public space for enterprise data, and jointly maintaining by members with "manage team dashboards" permission. (The "preset dashboards" in the original version 1.13-1.15 has been renamed to "basic data dashboards", which can only be viewed in "team dashboards".)
In the team dashboards, you can perform basic operations such as creating, copying, and sorting. In order to ensure smooth use, all functional operation methods are consistent with "My Dashboards". Please refer to the detailed introduction in "How to use Dashboards".
4. How to use Dashboards
This module will use "My Dashboards" as an example to introduce the basic operation usage.
- Create a new dashboards group and dashboards
- Dashboards sorting management: support changing dashboards sorting, modifying dashboards and group names, hiding dashboards
- Management entrance for batch sharing settings and deletion of dashboards
- Modify the current dashboards name
- Global filtering time window
- Global filtering event attributes and user attributes
- Refresh the current calculated data (only refresh invalid data or refresh full data)
- Dashboards sending settings
- Sharing settings
- More operations: performance settings, full-screen mode, stop updating, copy dashboards, delete dashboards, export to PDF
- Add data information in the dashboards: add existing content from bookmarks, create components, create descriptions
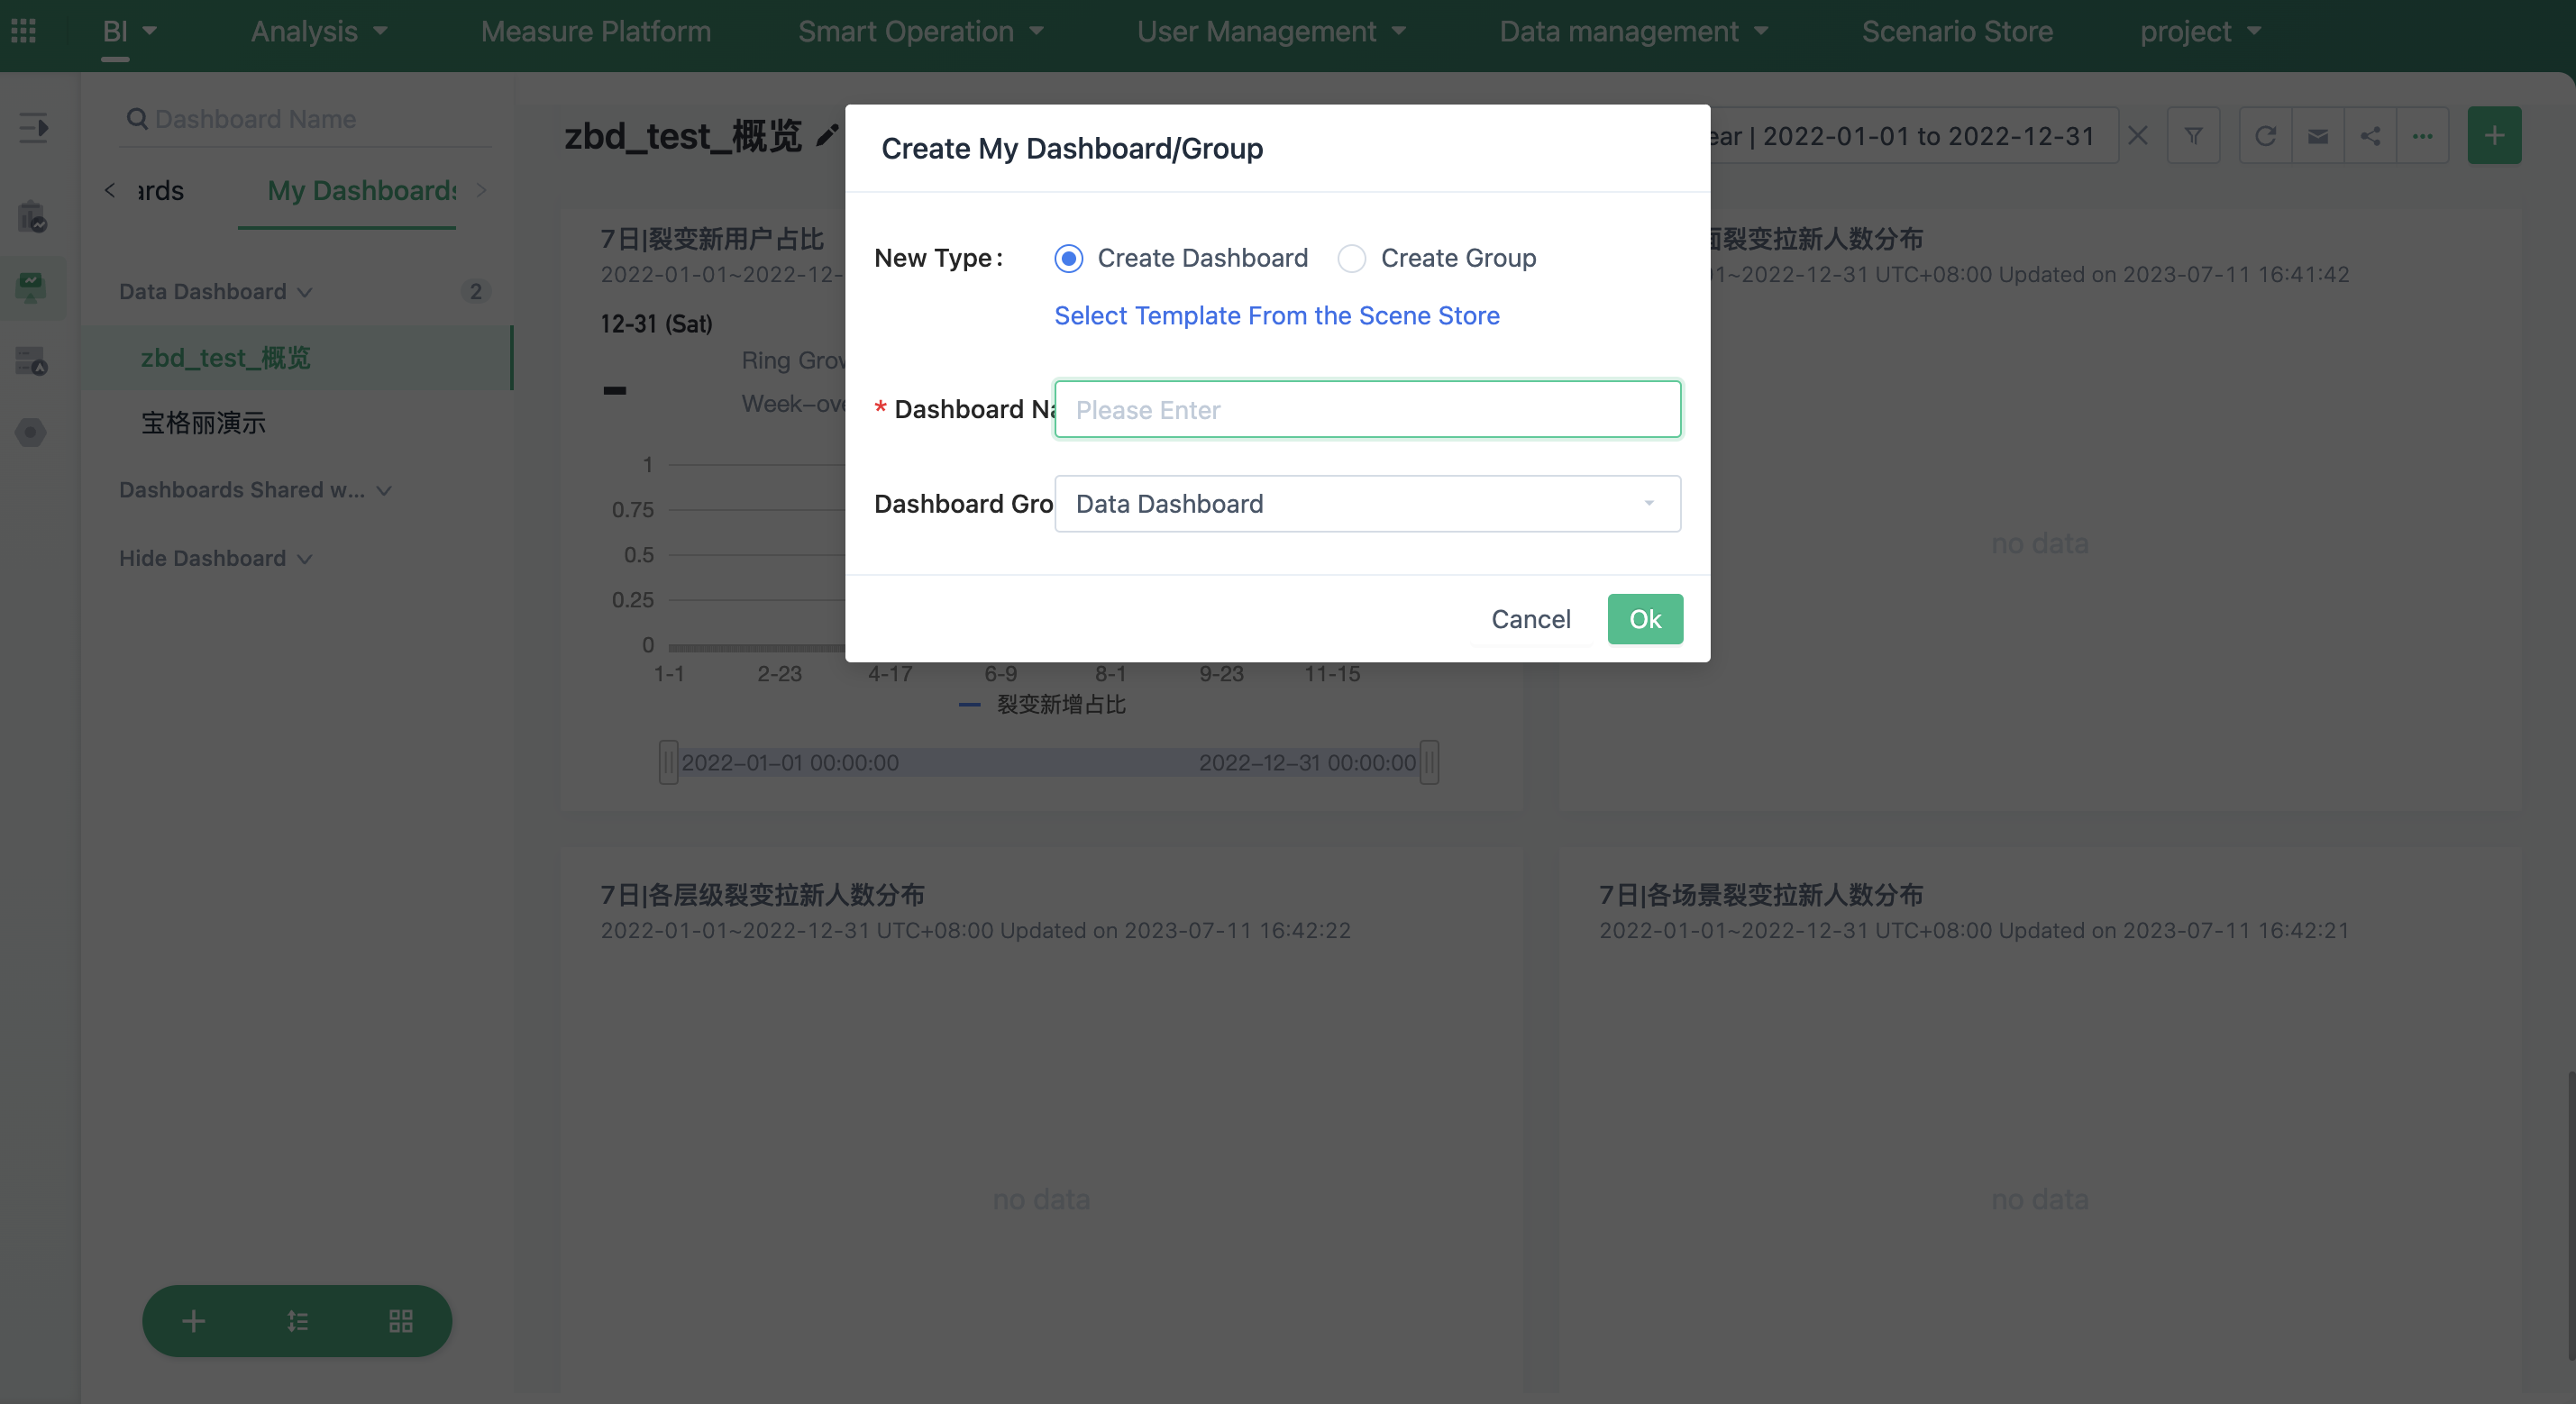
4.1. Create "dashboards Group" and "Dashboards"
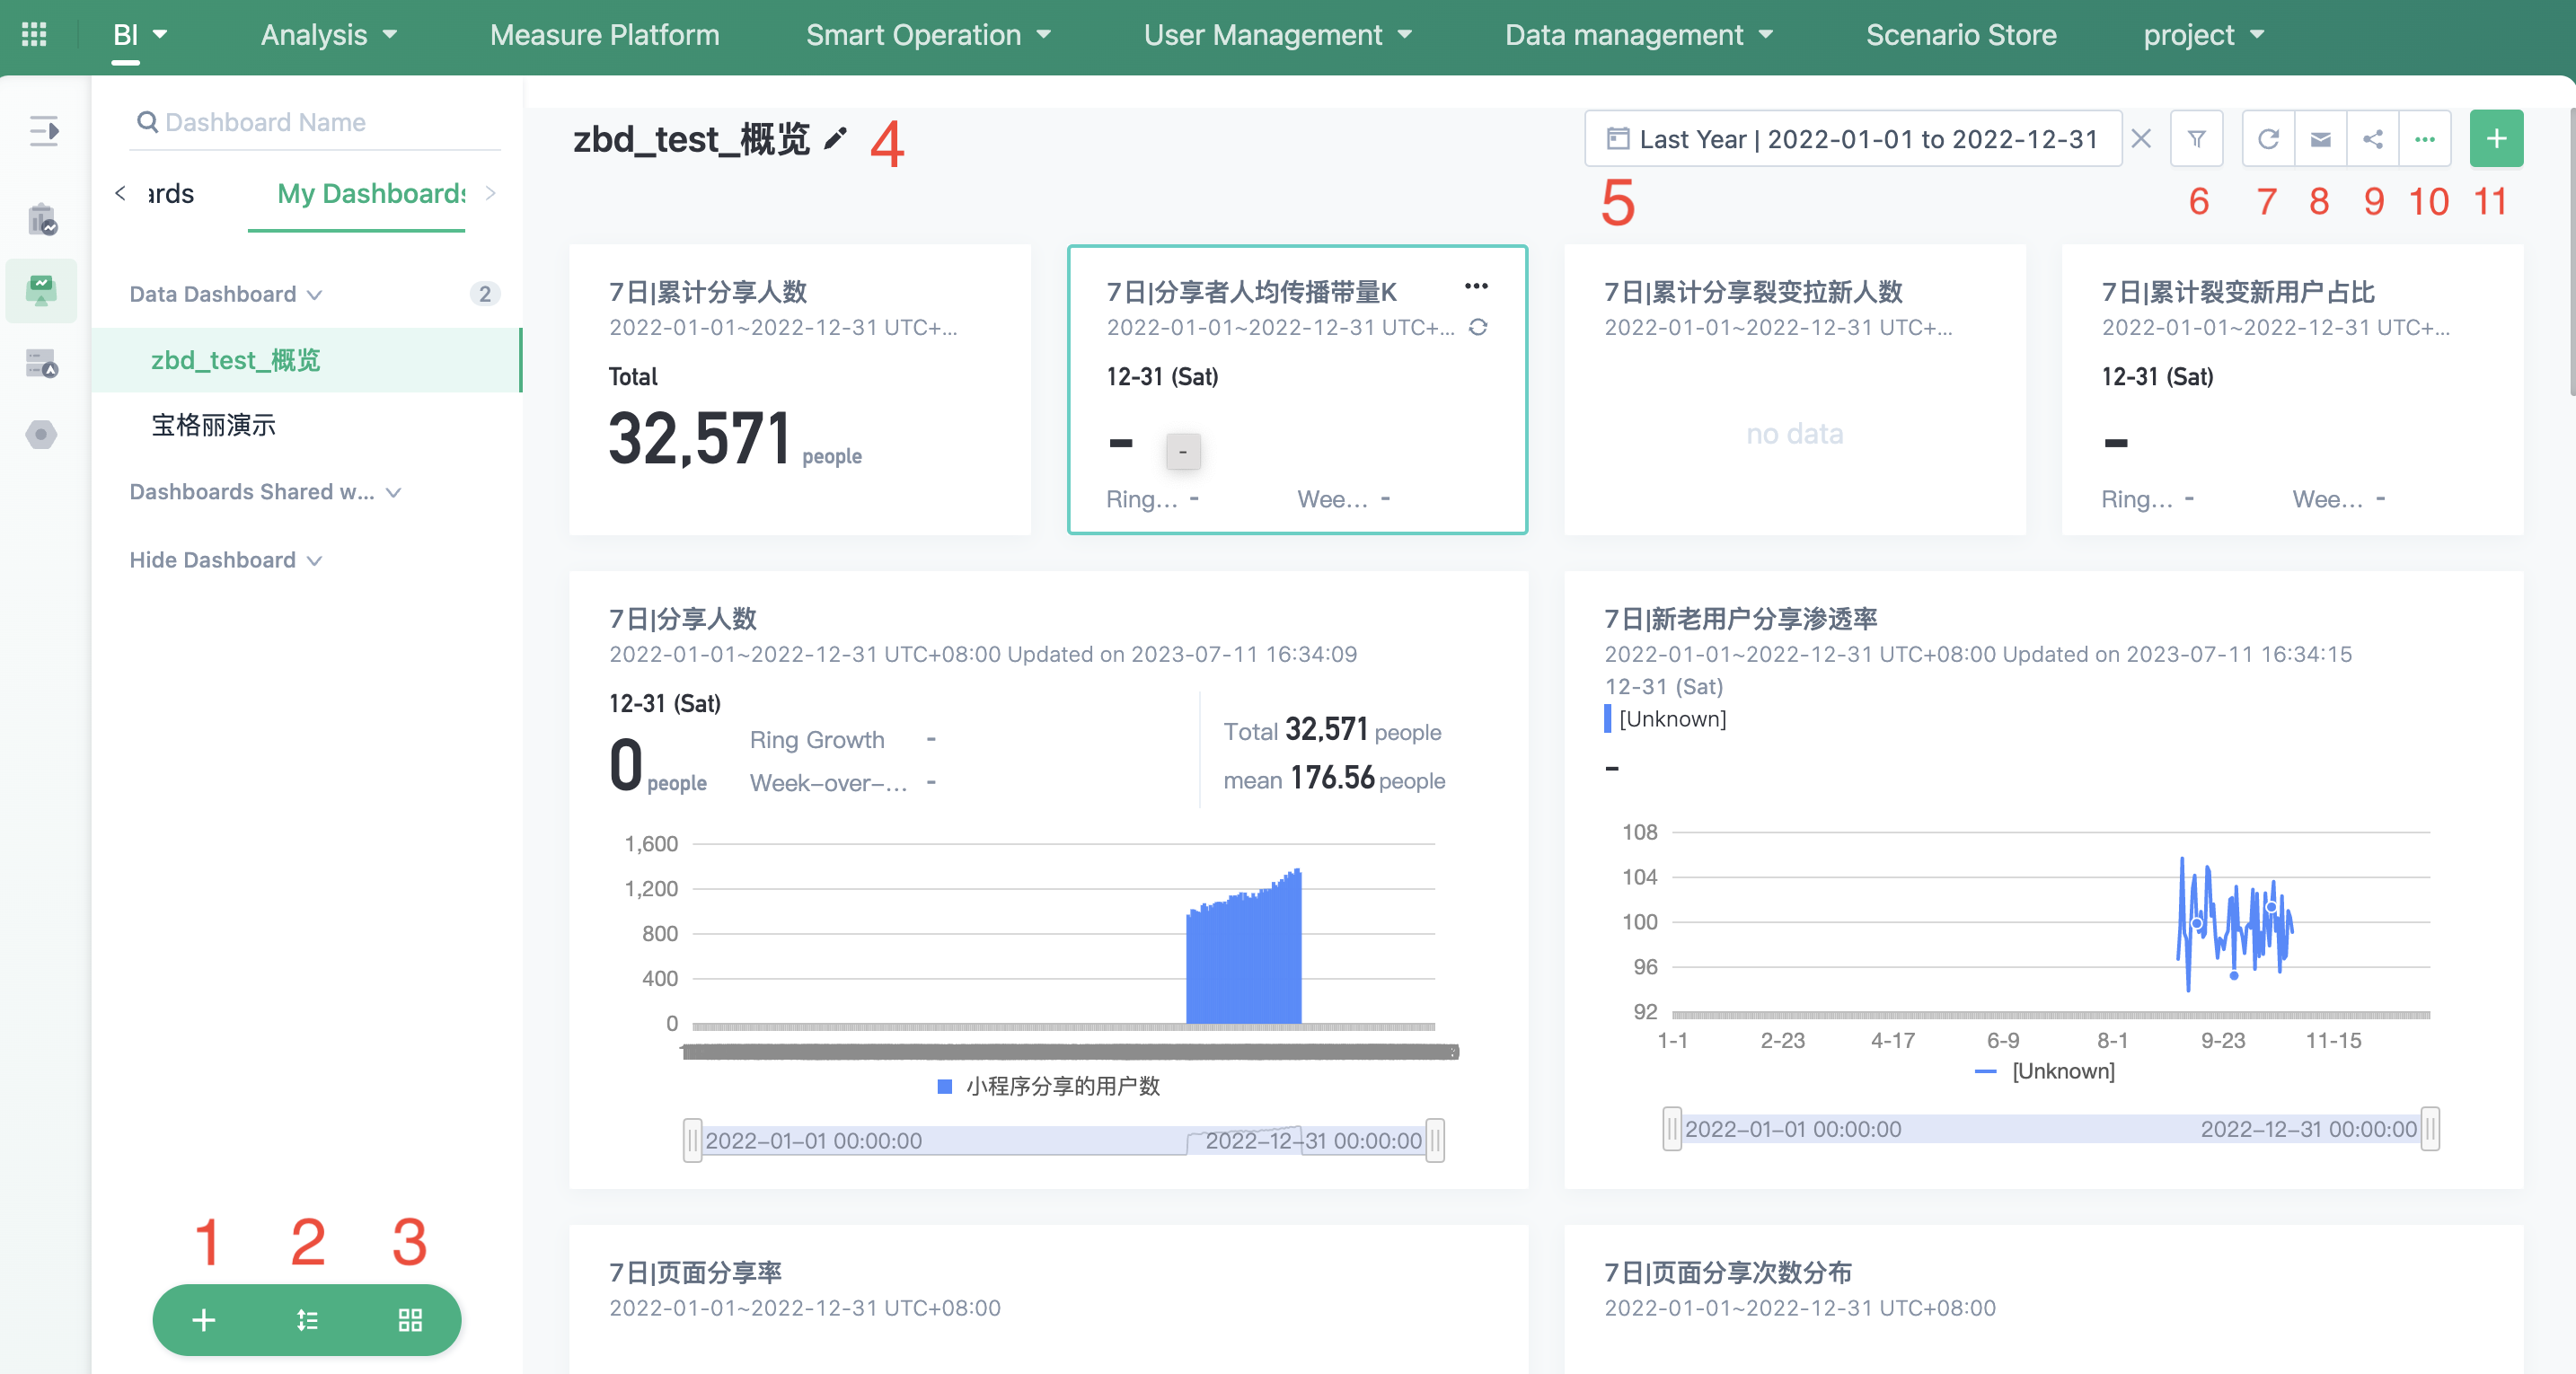
At the bottom of Public Dashboards and My Dashboards, click on "+" to create a new dashboards or group under the current category.
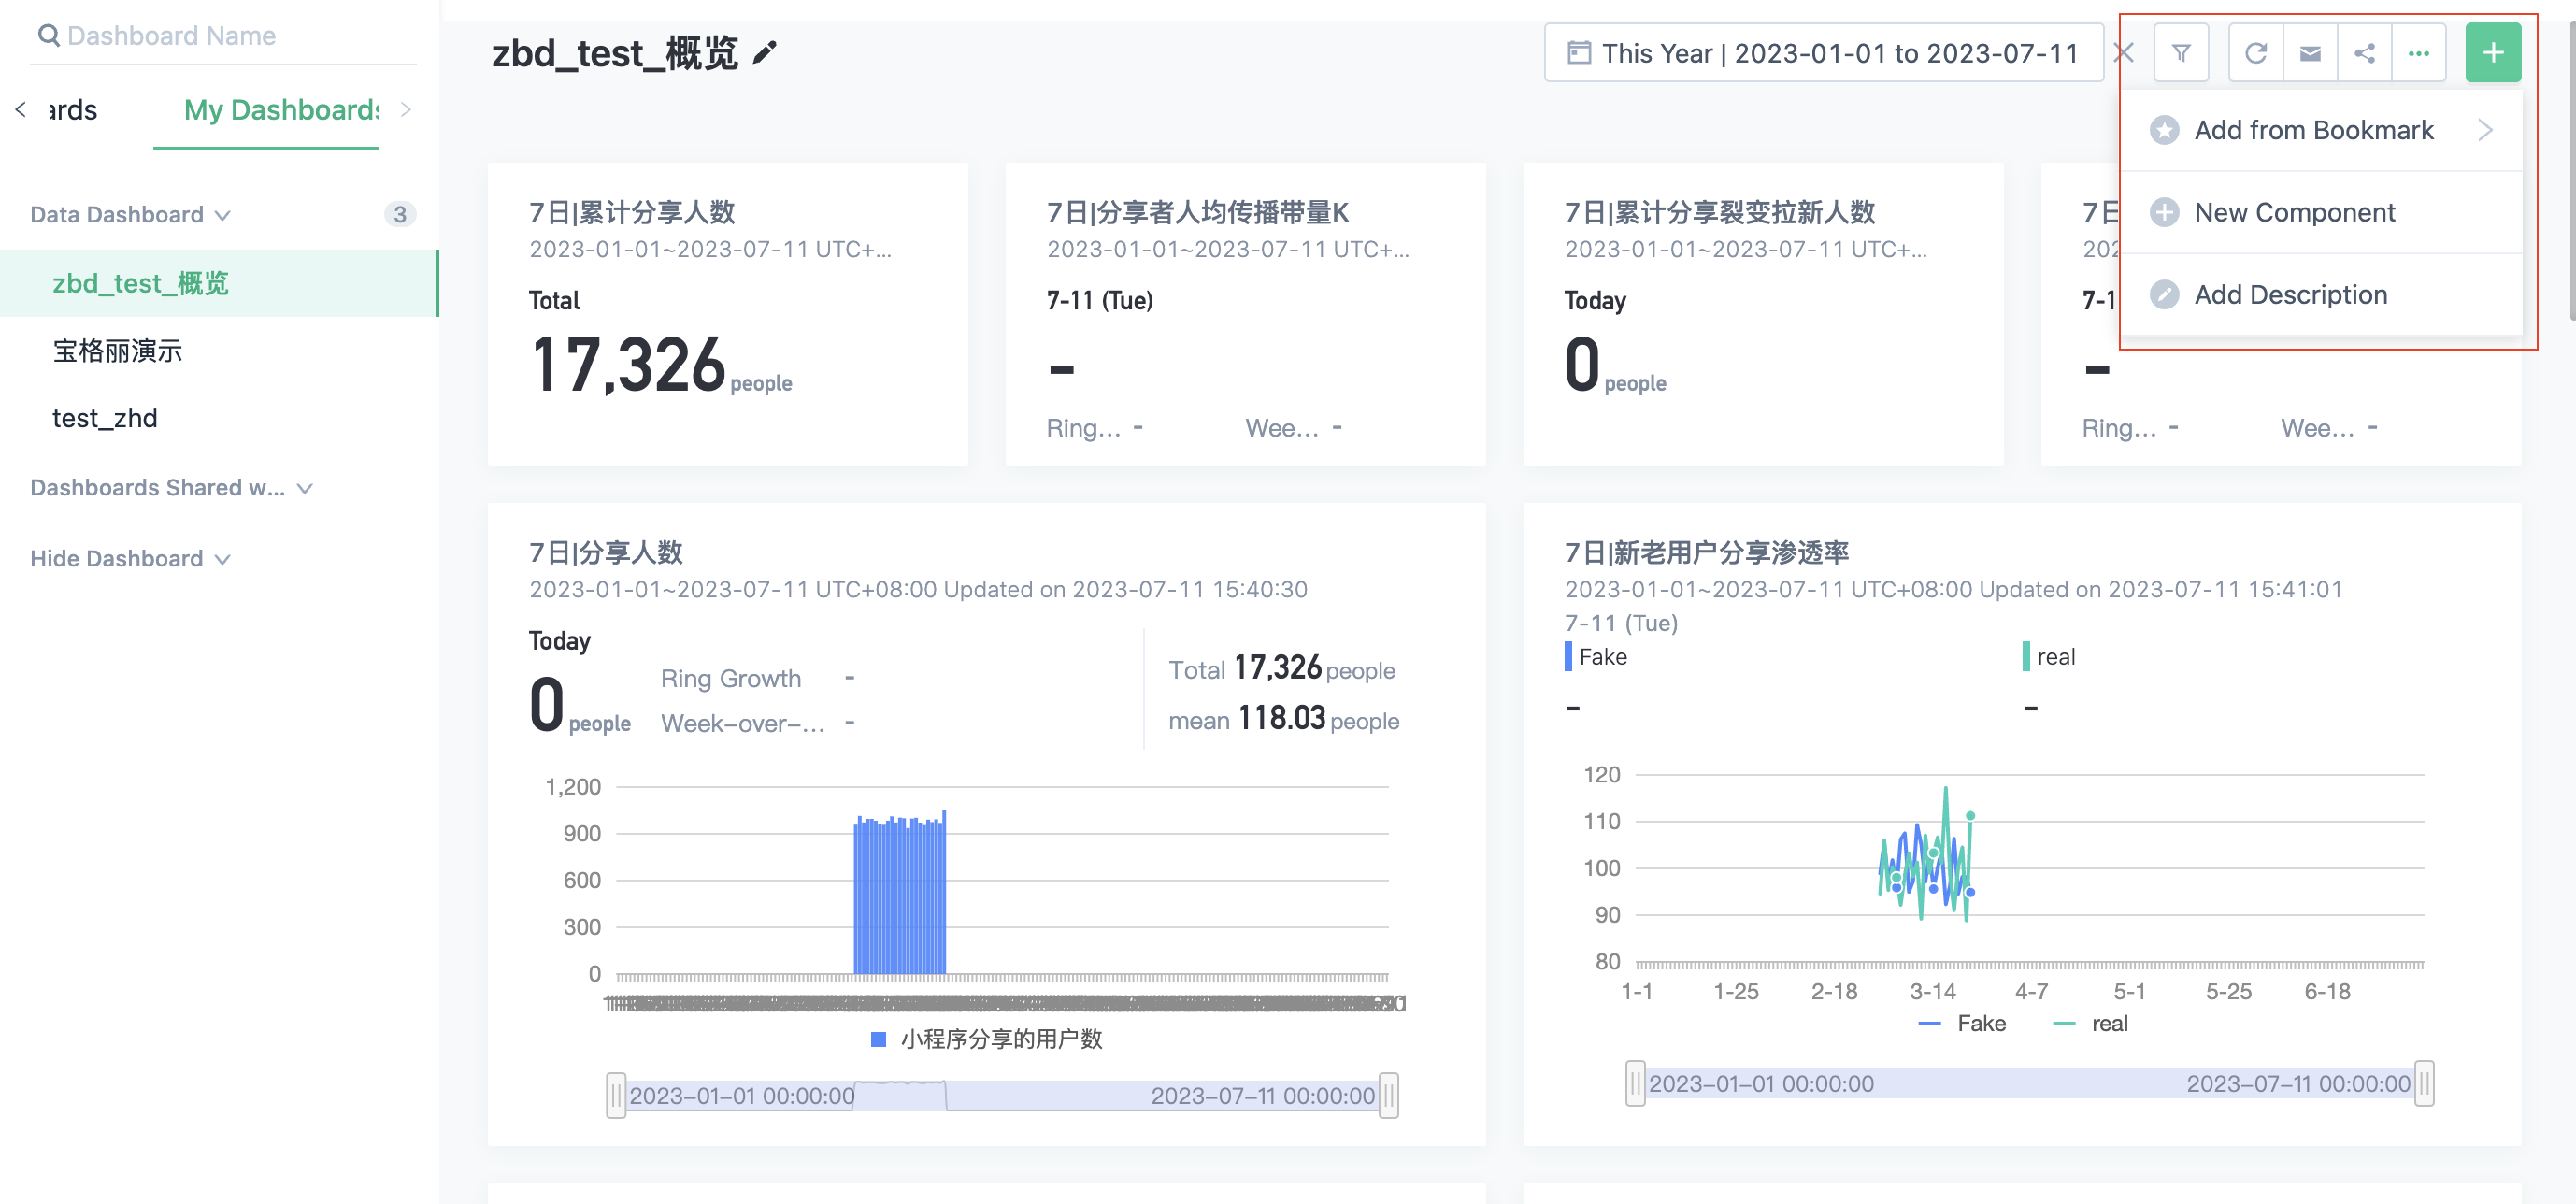
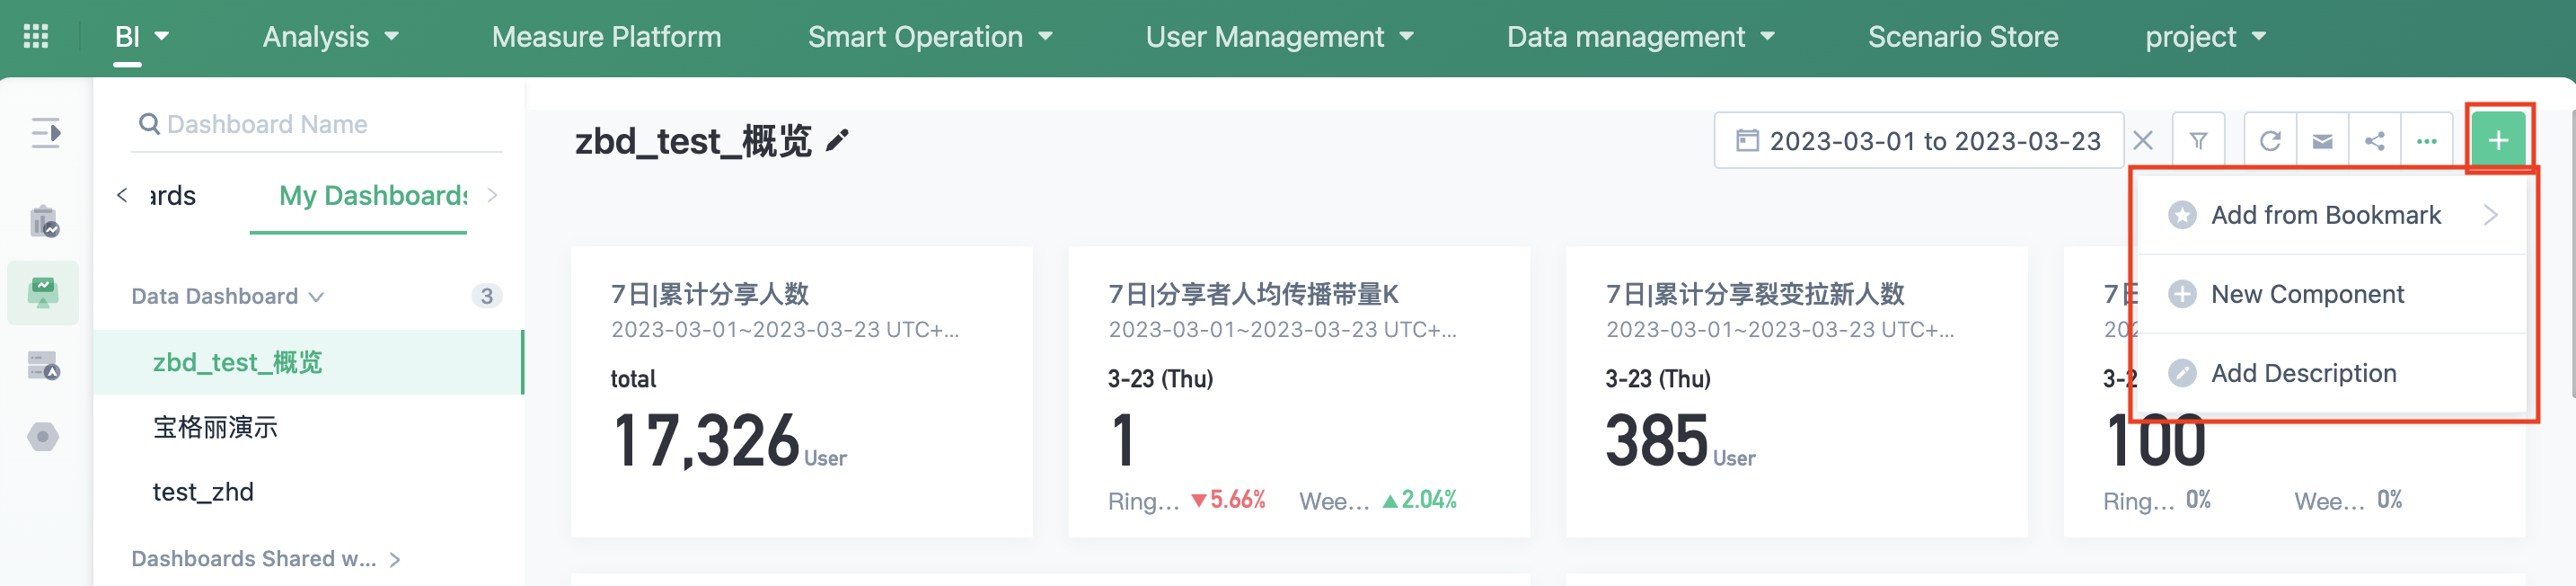
After the new dashboards is successfully created, click on the "+" button in the upper right corner of the dashboards details page to add existing content or create a new analysis block using the analysis model. In addition, we have added a "Description" component to make it easy for you to partition the entire dashboards or add interpretation descriptions, so that other viewers can better understand the analysis results you want to convey.
- Choose "Add from bookmarks" to add existing bookmarks to the dashboards;
- Choose "New Component" to create a new bookmark through the analysis model, which can then be saved to the Team dashboards. Analysis content created using this entrance can only be added to the Team Dashboards.
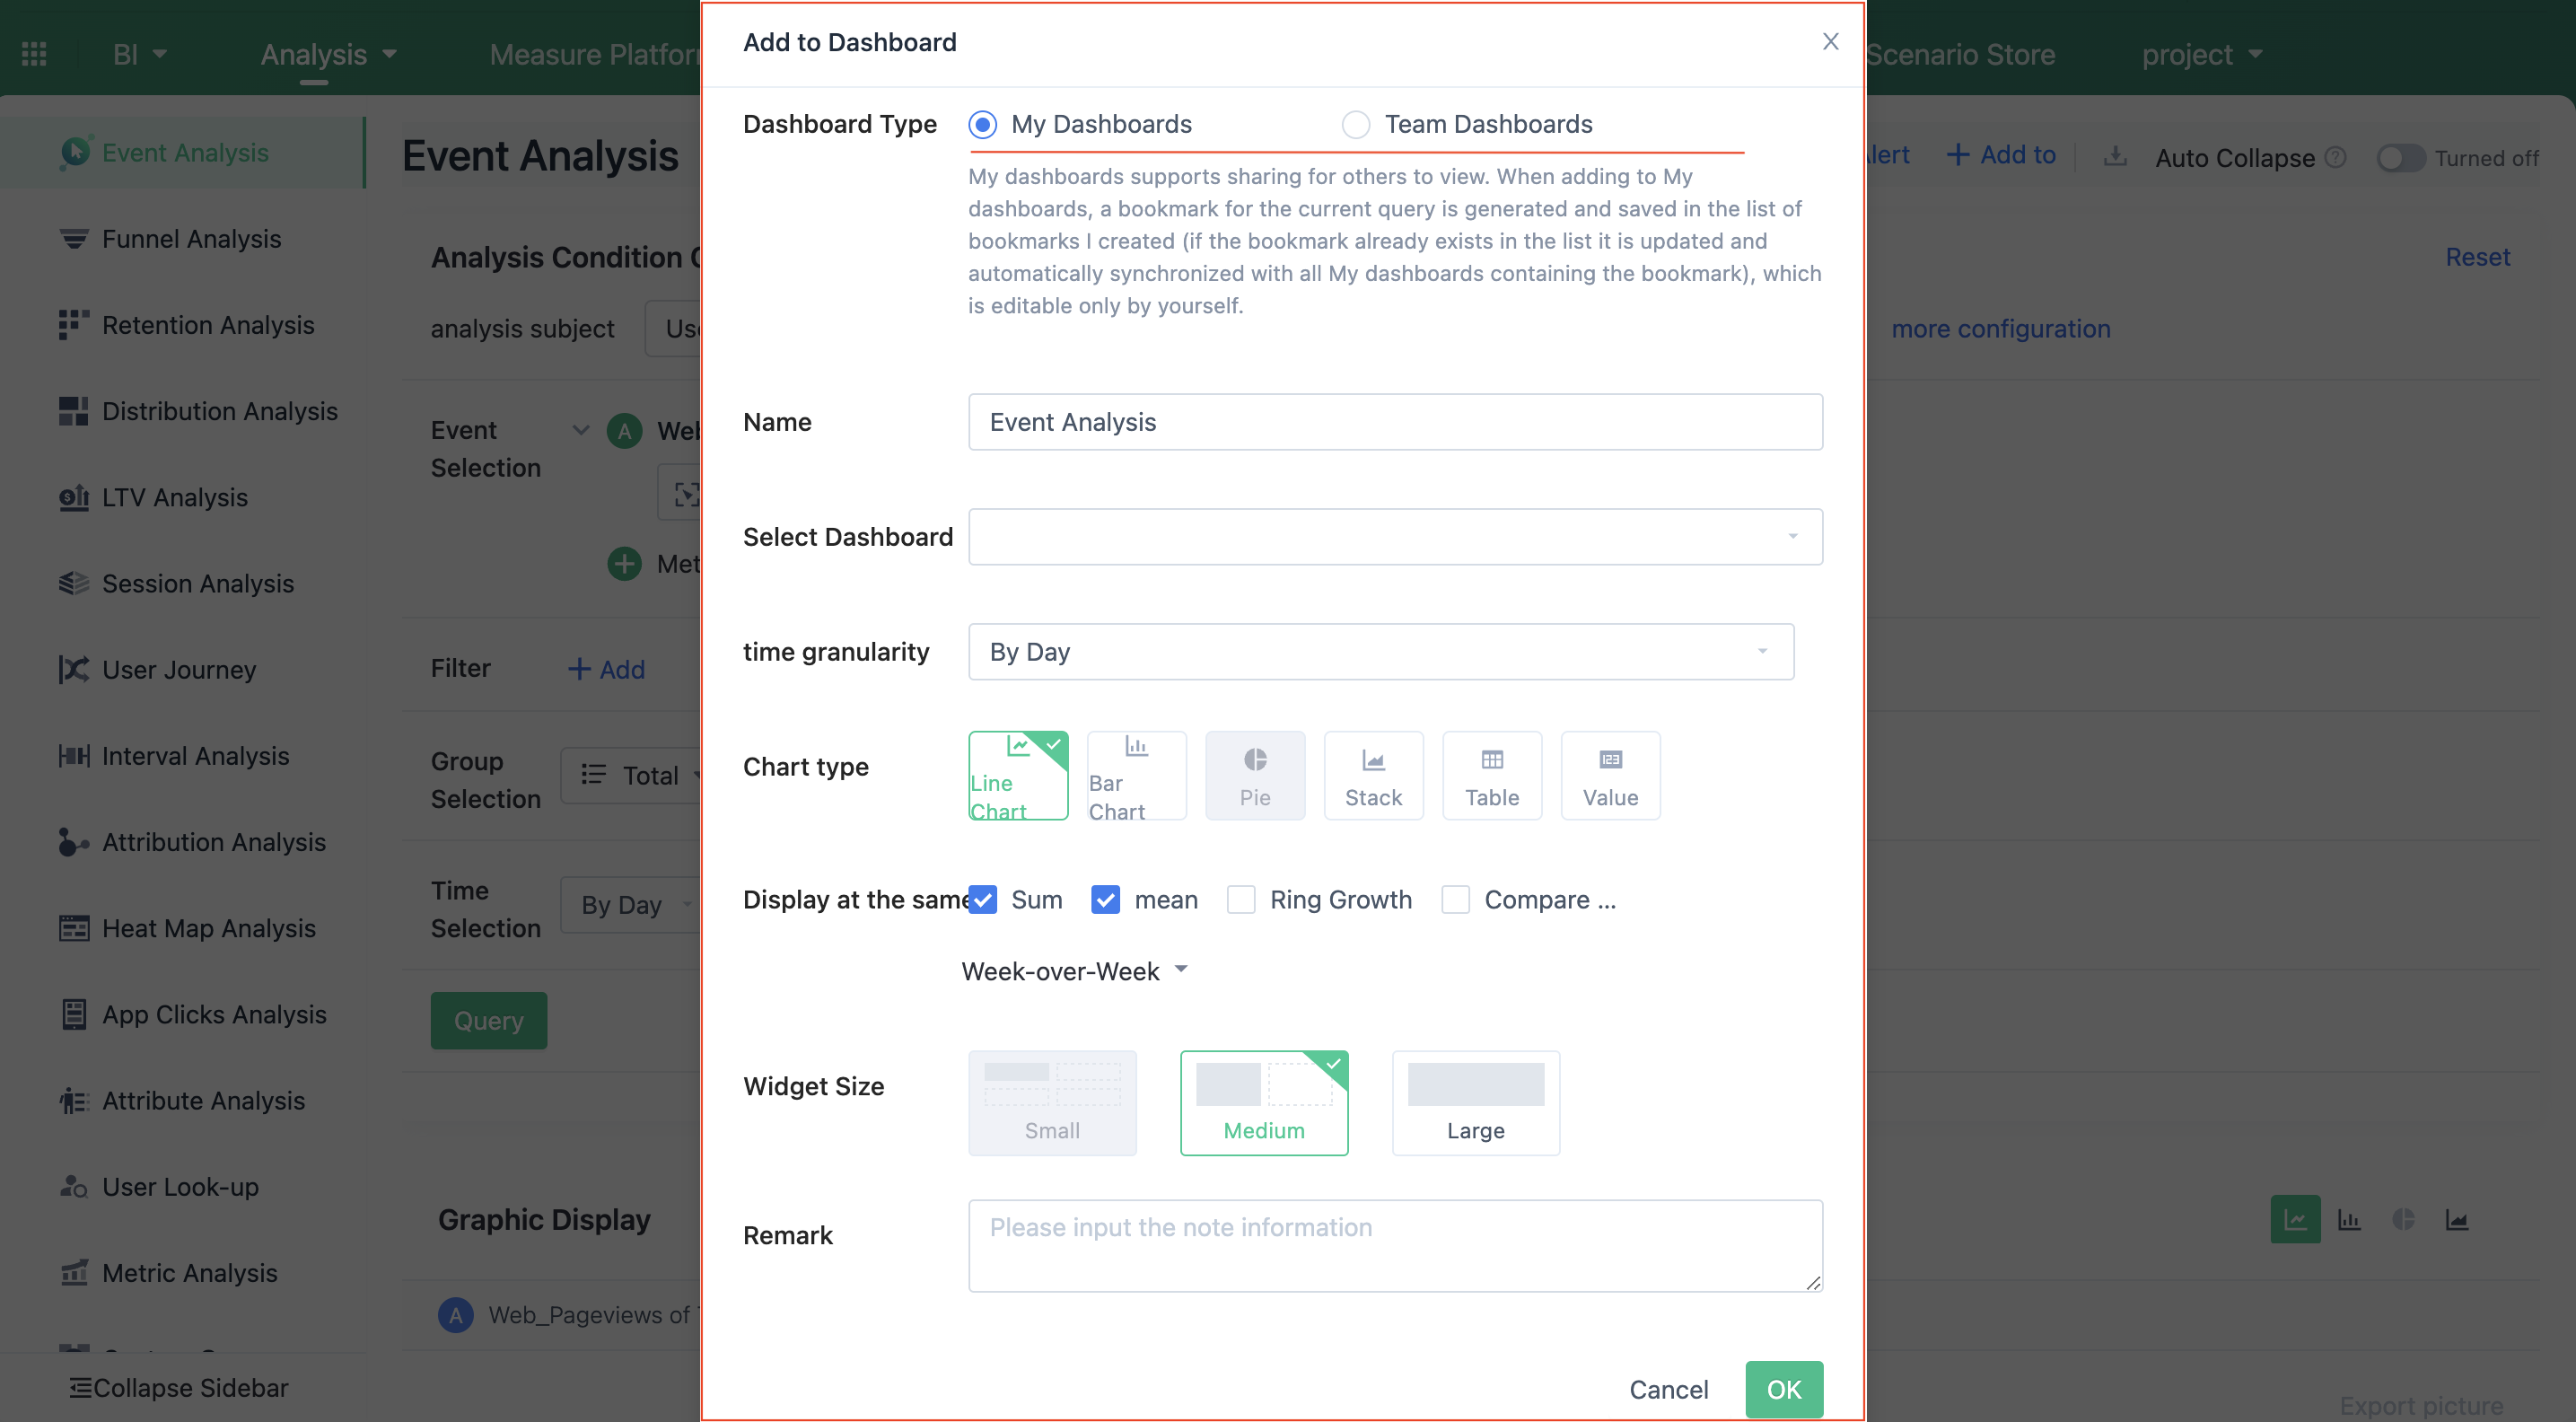
Members with "Team Dashboards Management" permissions can select "Save Analysis Results as Bookmarks" in each analysis model after analysis, and add them to Team Dashboards or My Dashboards.
4.2. Dashboards sorting and management: supporting changing dashboards sorting, modifying dashboards and group names, hiding dashboards
Change Dashboards Sorting
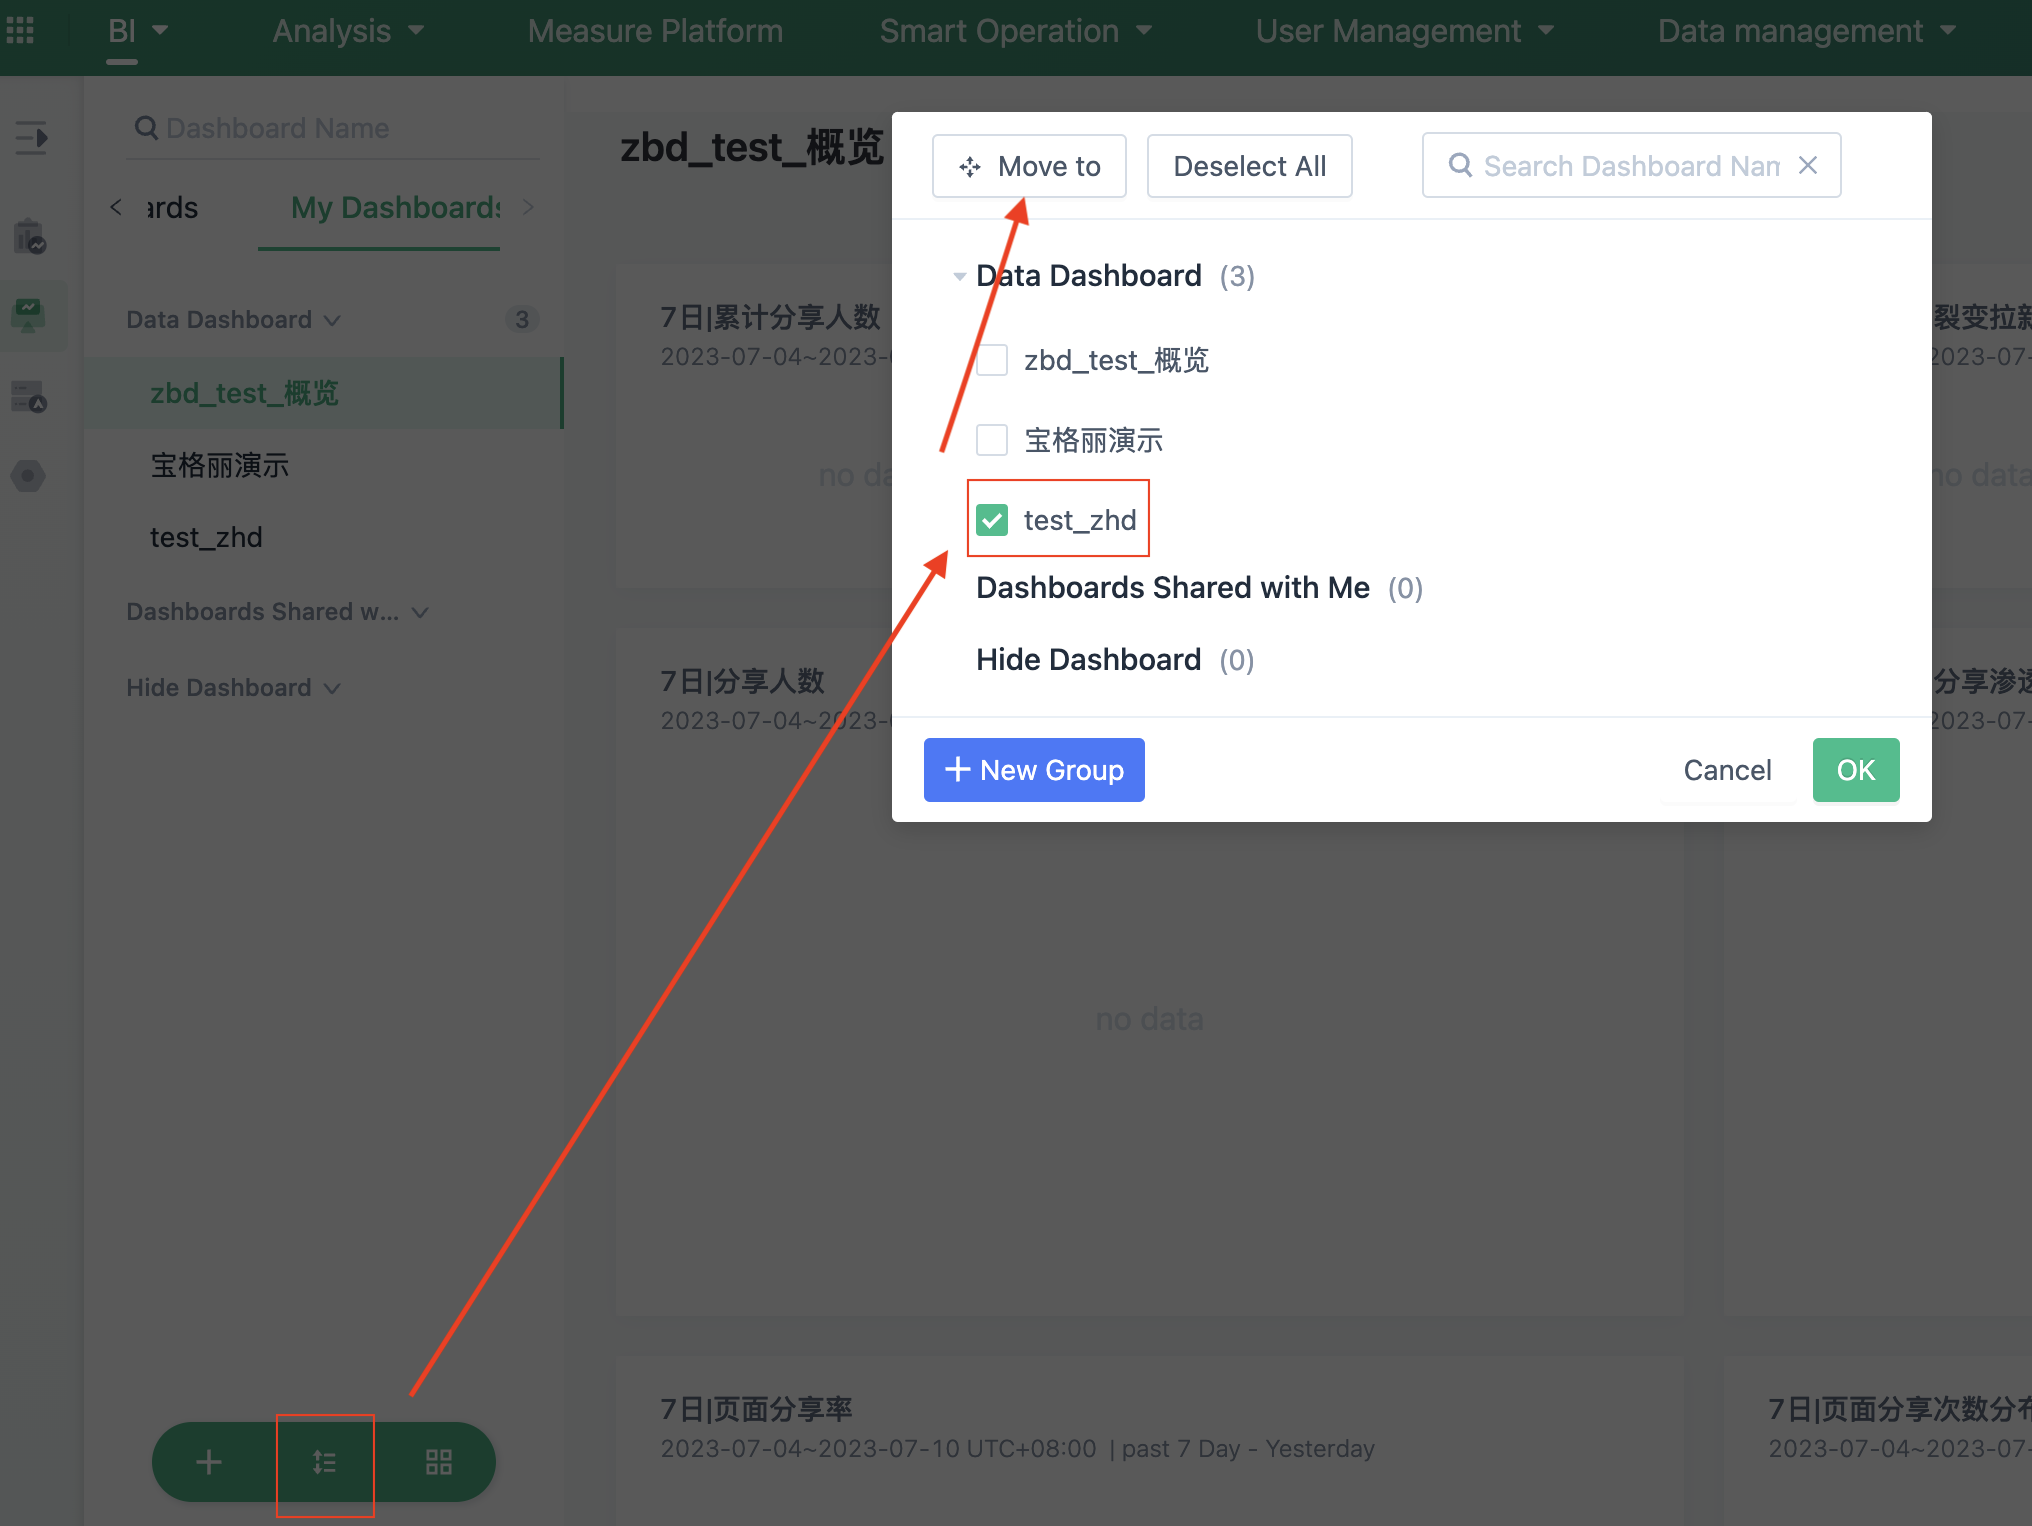
Click on the "Manage Order of My Dashboards" button at the bottom of the left navigation, and you can sort dashboards and dashboards groups.
- You can select multiple dashboards for batch movement in order to easily sort the dashboards.
- In this pop-up window, you can directly drag and sort the "Dashboards" or "Group" by clicking and holding the mouse button.
Modify Dashboards and Group Names
Hover over a specific "Dashboards" or "Group" with the mouse to perform quick operations such as renaming the dashboards or group.
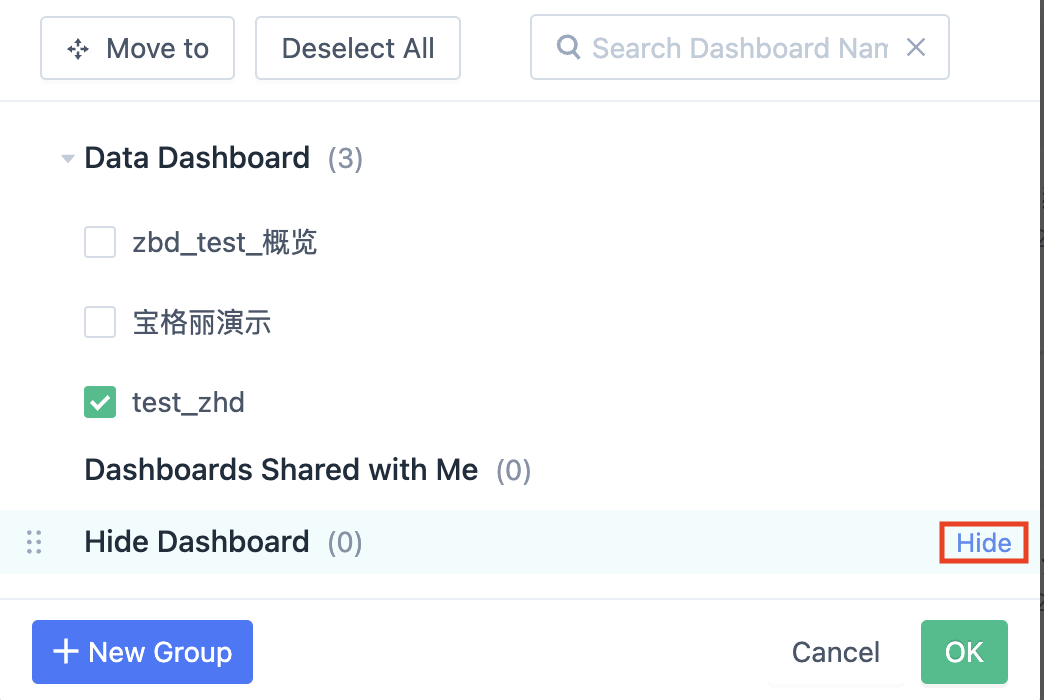
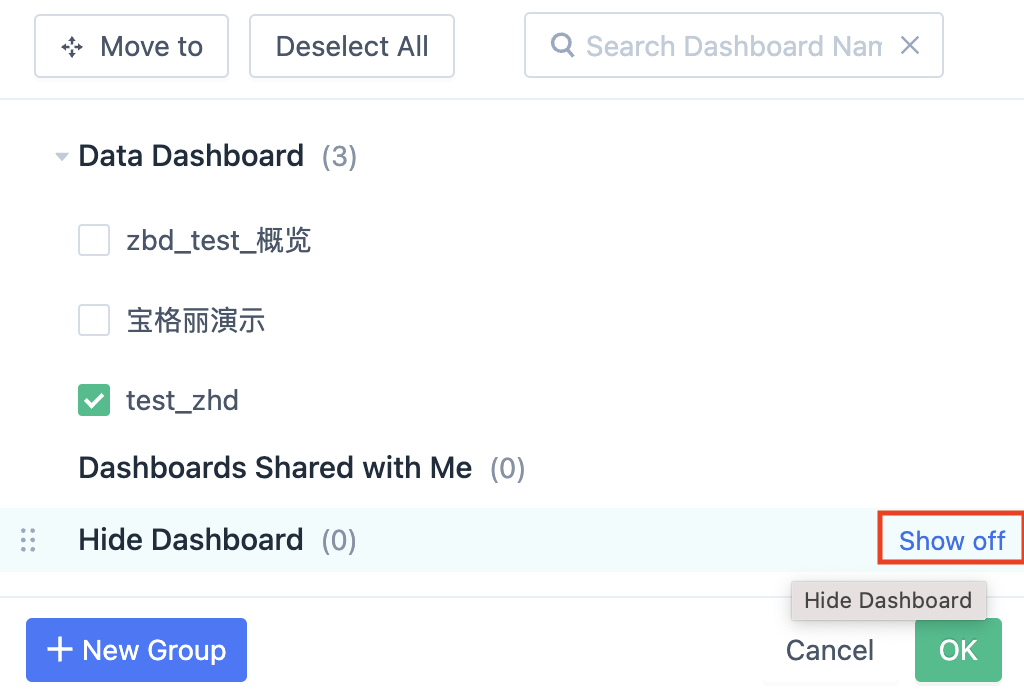
Hide Dashboards
Move the dashboards to "Hidden Dashboards" and click the "Hide" button to make the entire "Hidden Dashboards" group invisible in the dashboards directory list. To restore it, click the "show off" button of "Hidden Dashboards".
4.3. Manage entrances of bulk sharing and deletion of dashboards
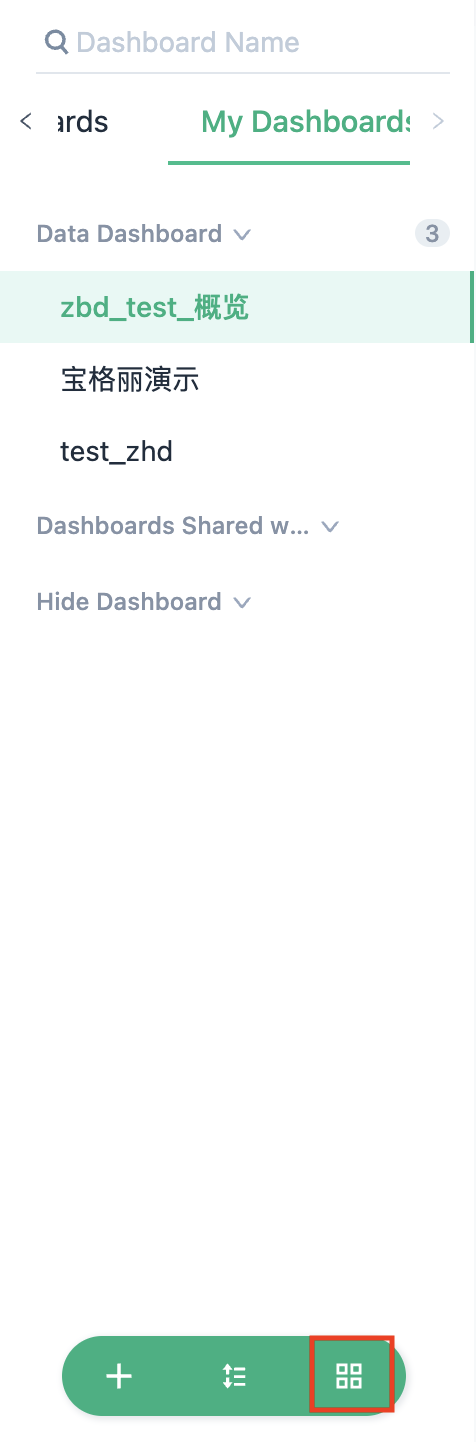
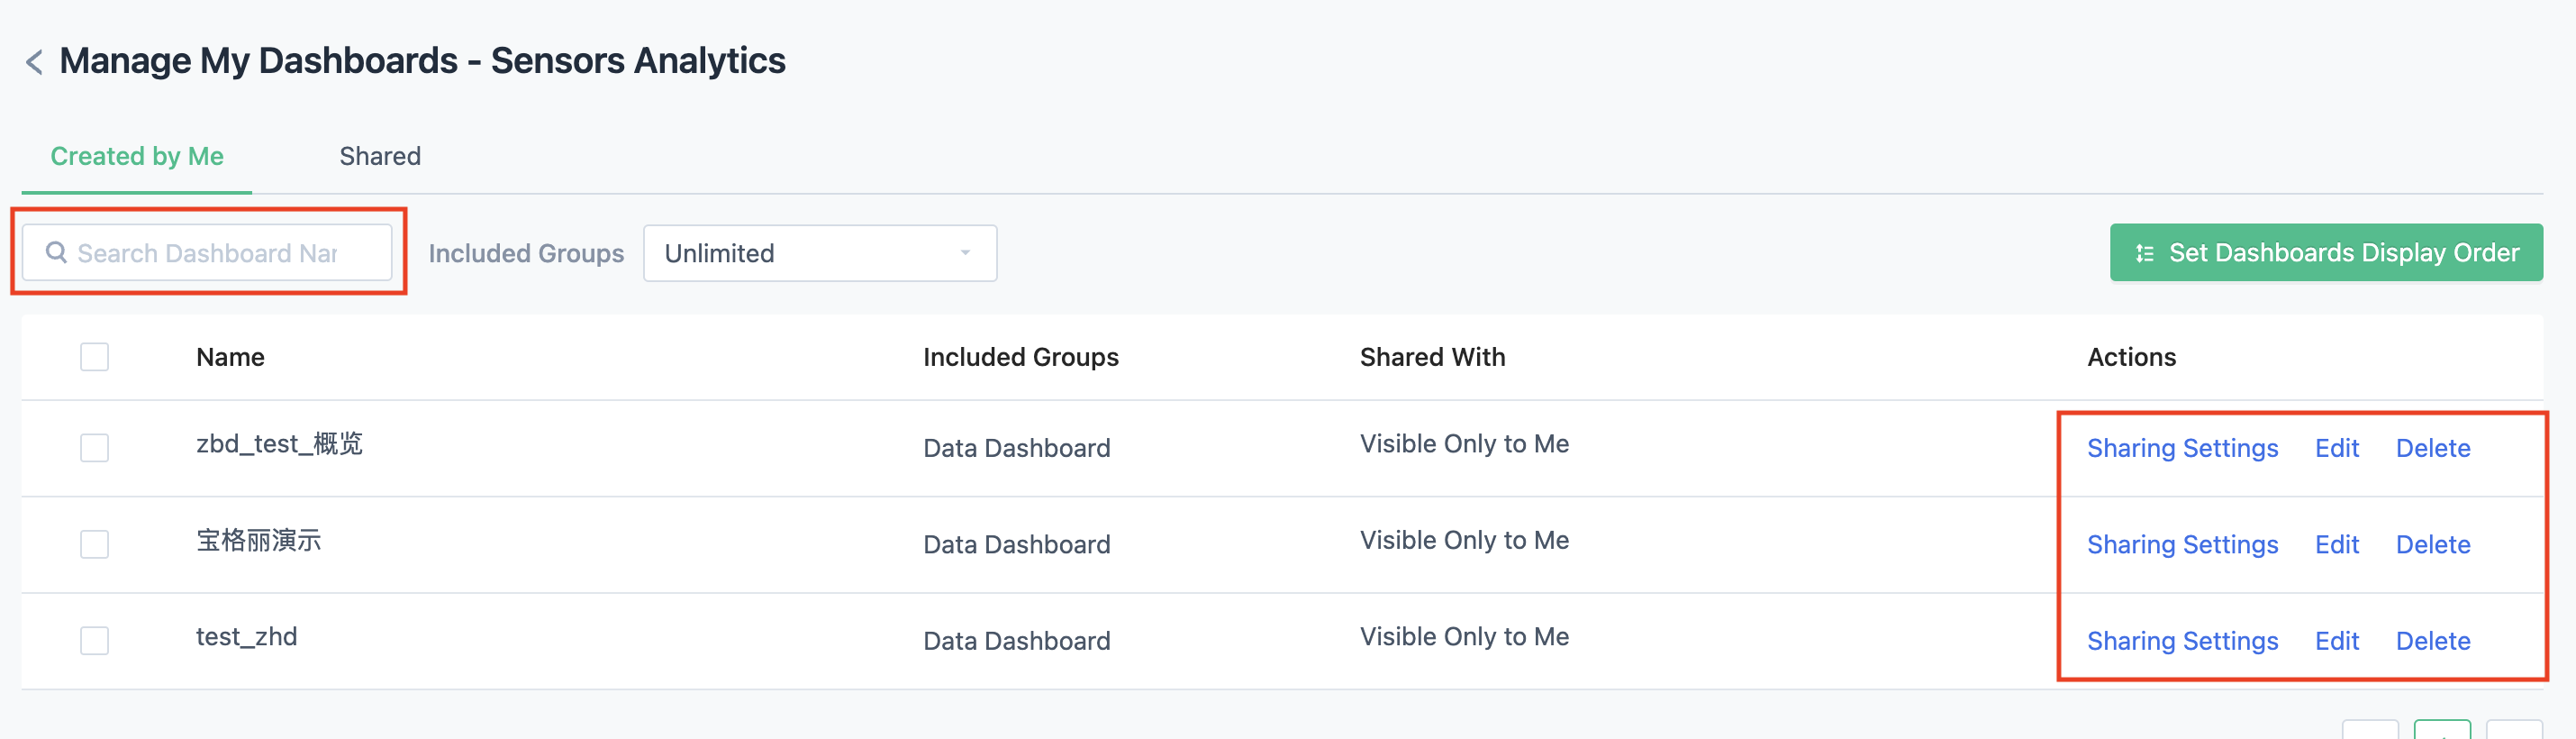
Select "Team Dashboards" or "My Dashboards" and click the "right-most button" on the left navigation to enter the corresponding "Dashboards Management" page. In this list, get a comprehensive understanding of the sharing settings and creation information of Public Dashboards.
- Support searching for dashboards name keywords for retrieval
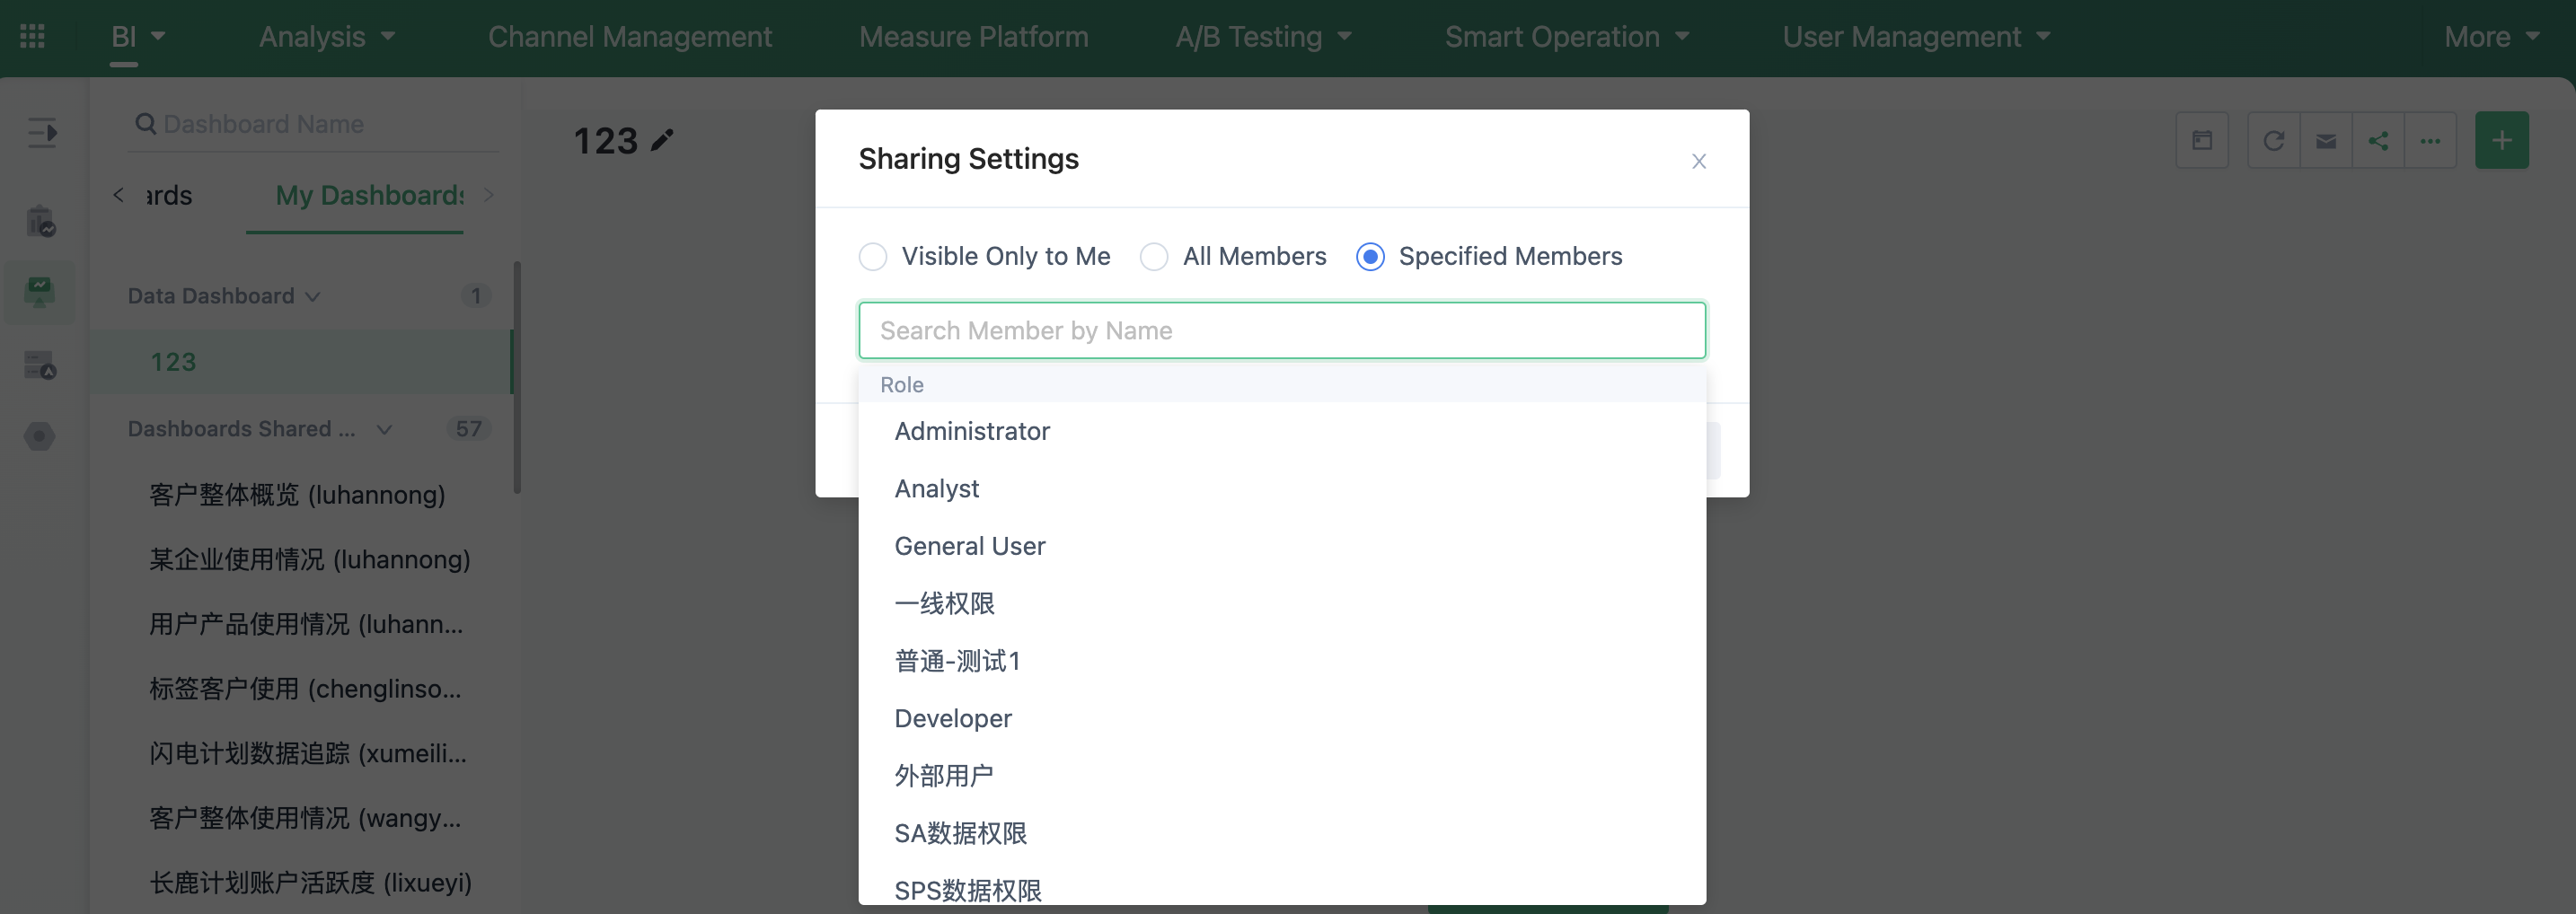
- "Sharing Settings" are supported; through this configuration, you can set the visible range of the current dashboards: "Only members with Public Dashboards management permissions can see it", "All members", "Specified members". In "Specified members" you can set certain members or certain roles for dynamic configuration, or dynamic configuration of certain positions. Note: If there is no "position information" in the current project, it will not be displayed here. You can go to "Member and Role"- "Member Management"-"Position Management" to add relevant information. After that, members of this position can view the corresponding dashboards according to this configuration.
- Editing operations are supported, allowing you to modify the name of the dashboards and the grouping settings.
- Use deletion operation with caution. Members who were able to view this dashboards before deletion will no longer be able to do so; bookmarks with no owner can be restored for use under "Add from Team Bookmarks".
- Stop sharing; only members with "Manage Team Dashboards Permissions" can view it after the update.
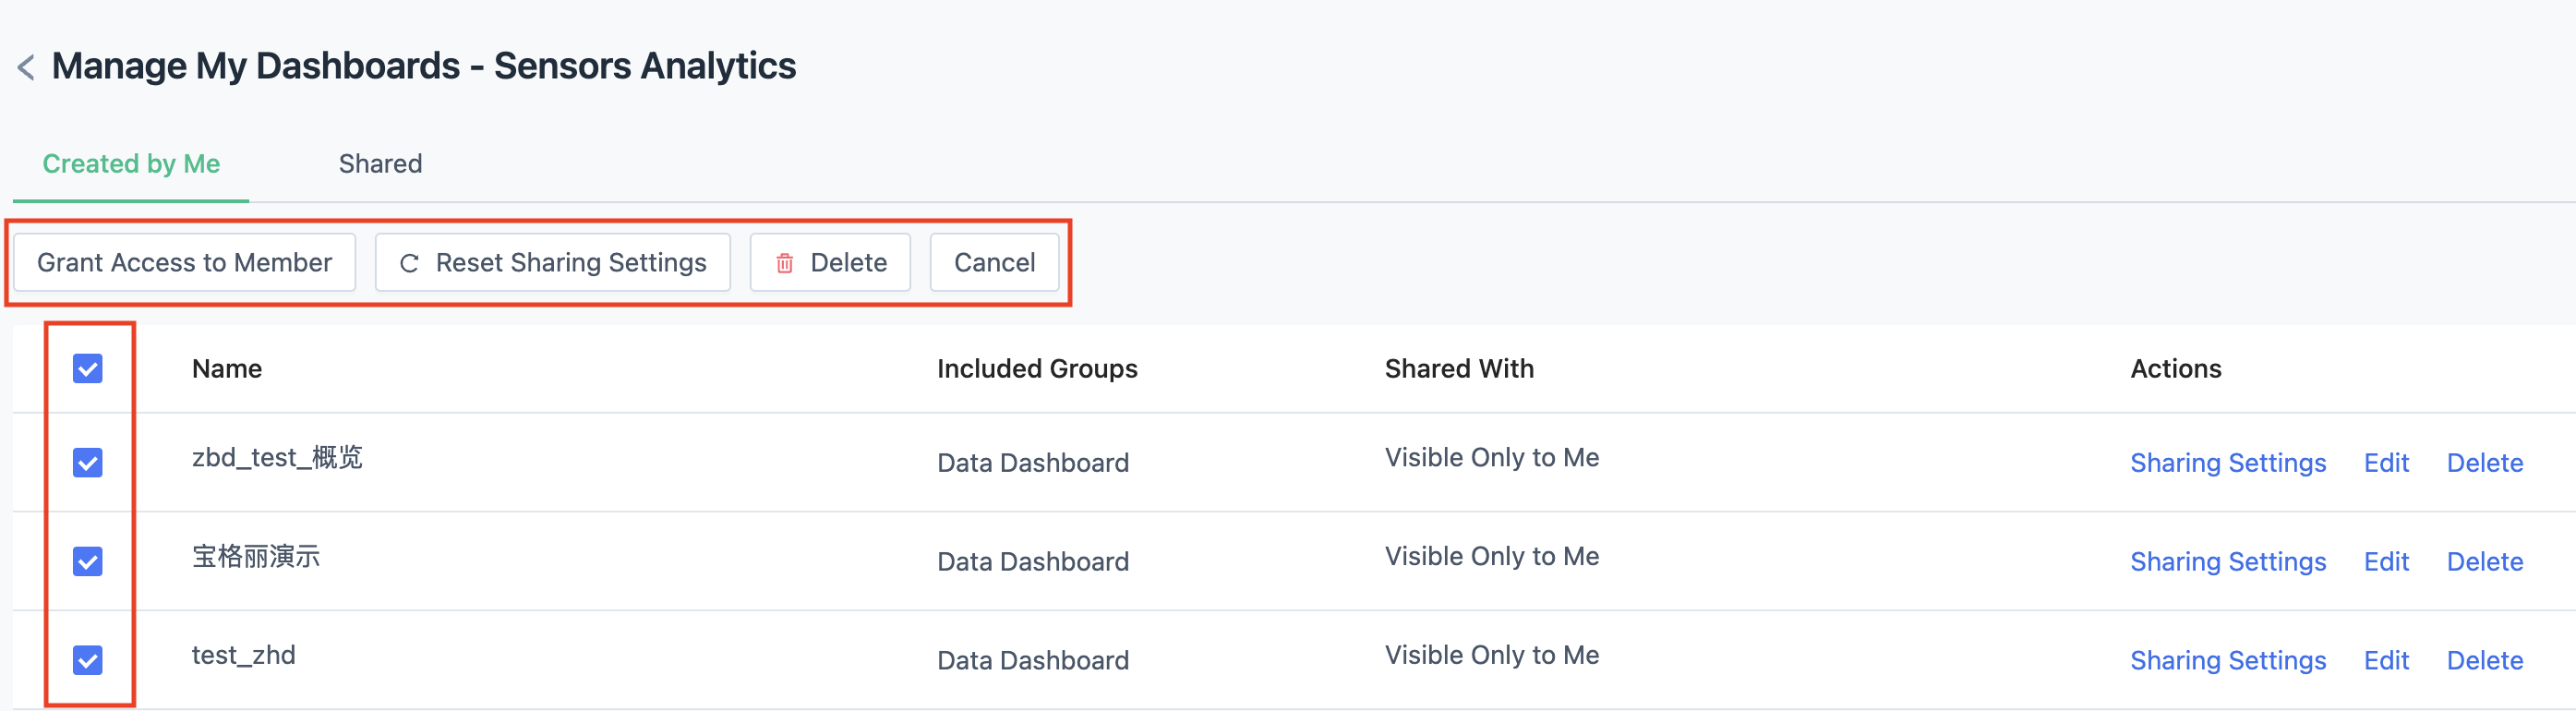
Support selecting multiple dashboards for "Batch Setting".
- If you need to add accessible members to the currently selected dashboards in bulk, use "Add Accessible Members".
- If you need to reset the sharing settings for the currently selected dashboards in bulk, use "Reset Sharing Settings".
- Use batch deletion with caution.
Note: If a member does not have access to any dashboards within a group, the group will not appear when the member views Public Dashboards.
For example, the Operations Data Dashboards Group contains three dashboards, and none of the share settings for each dashboards includes John. When John views Team Dashboards, he cannot see the "Operations Data Dashboards Group".
4.4. Edit the current dashboards name
After clicking the Edit button, you can directly modify the dashboards name, then press Enter or click outside the input area to complete the rename.

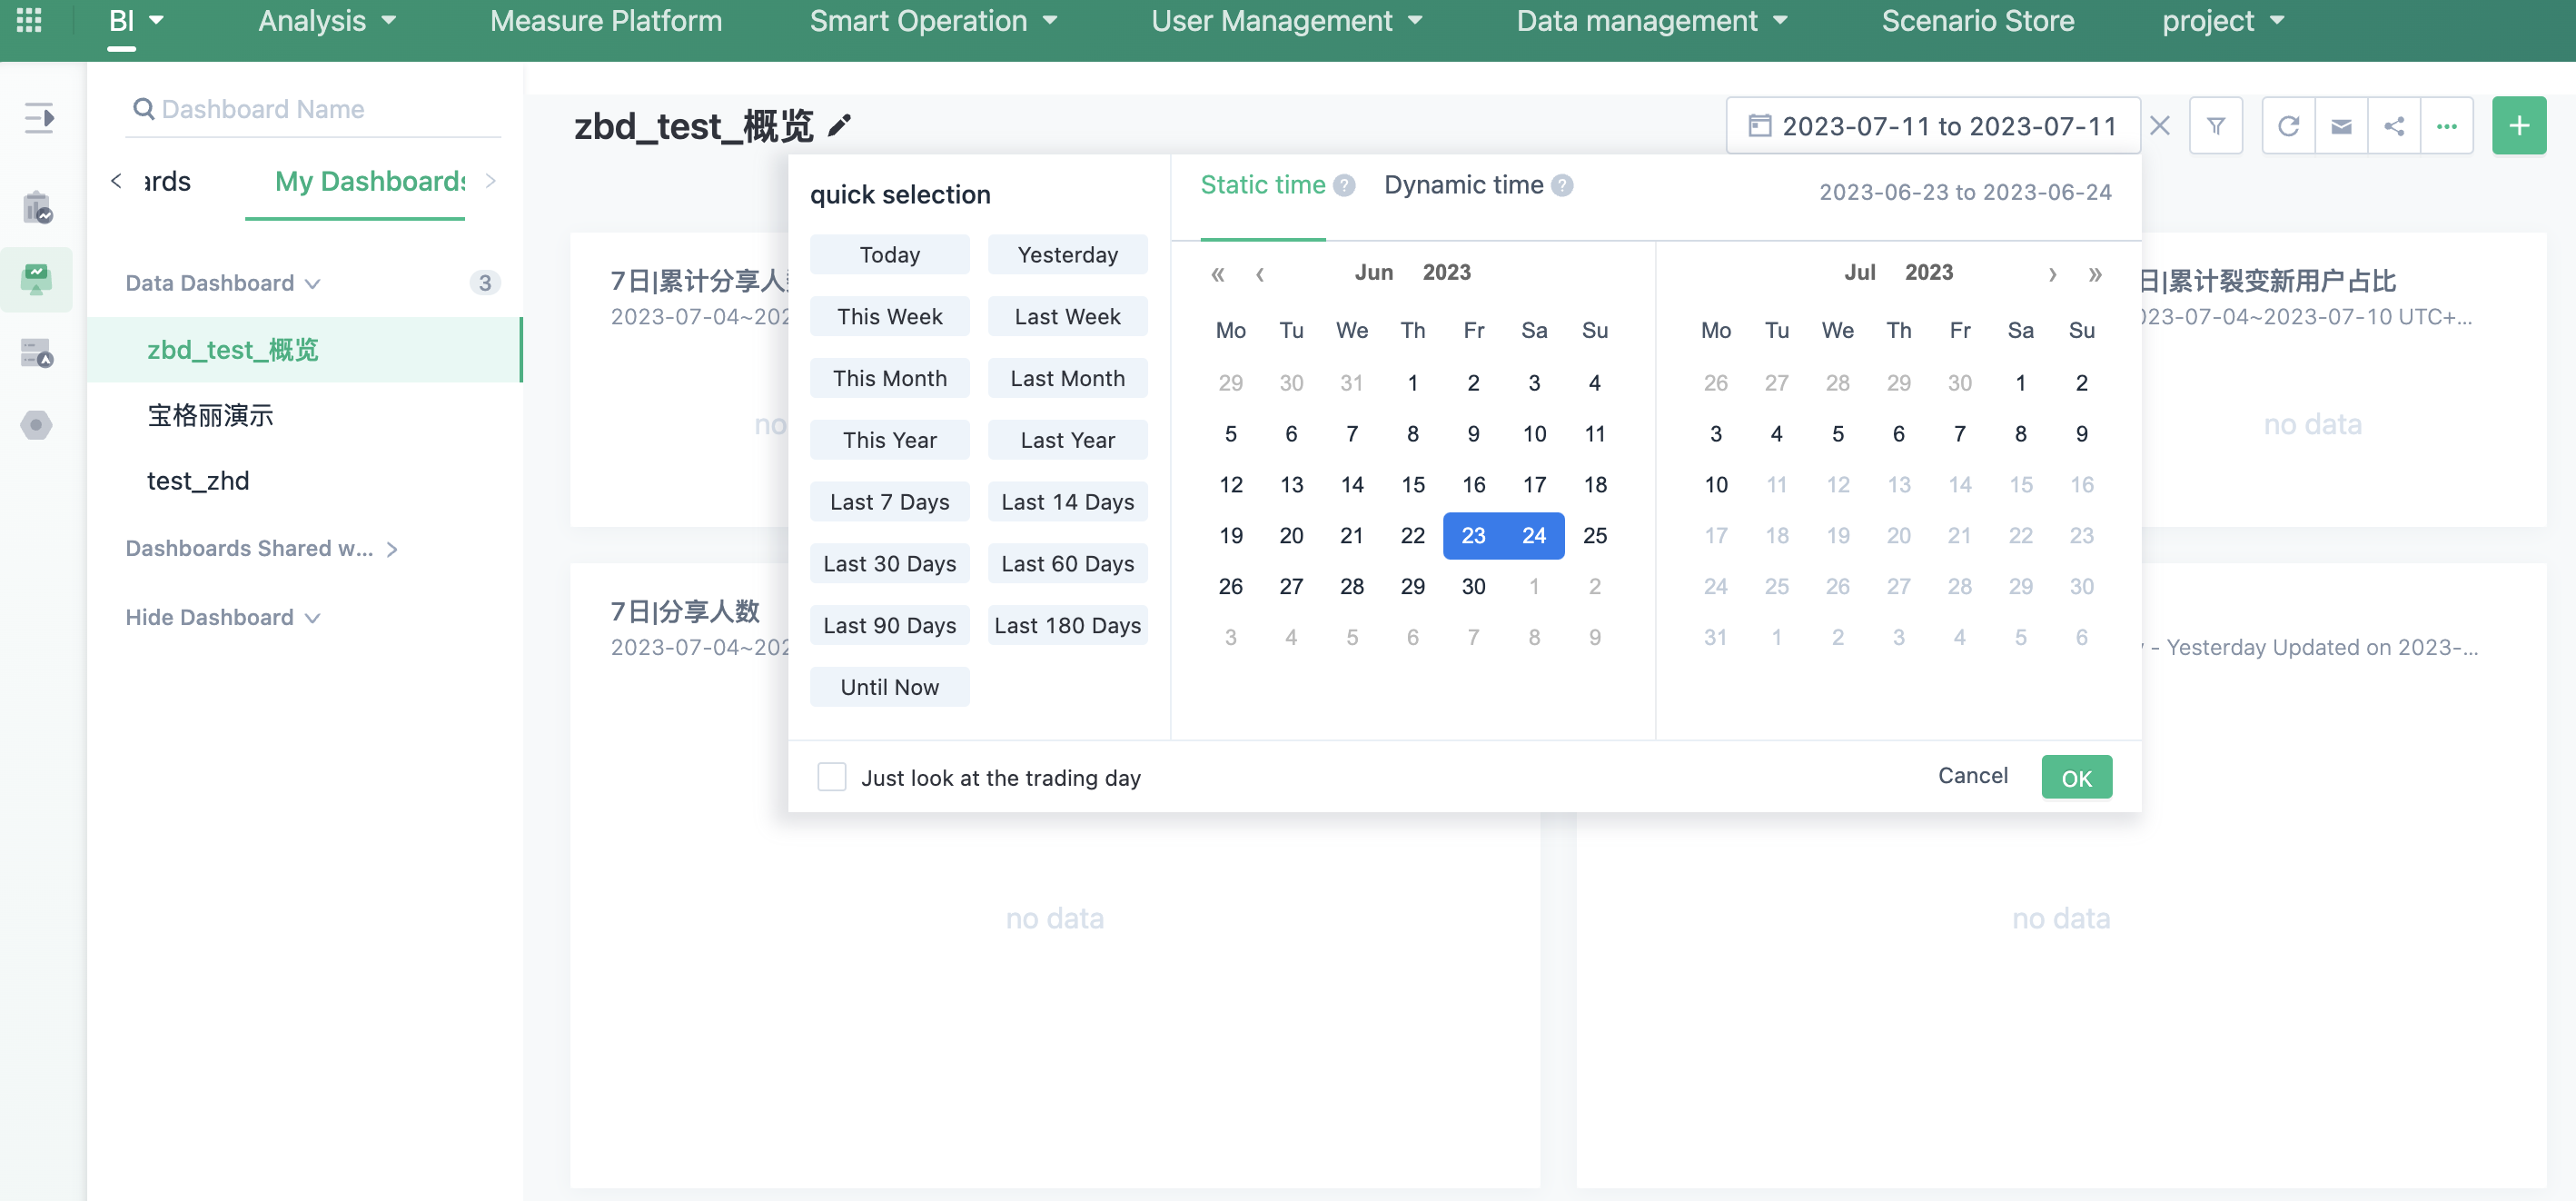
4.5. Global filtering time frame
After modifying the time frame, it will take effect on all analysis results within the dashboards. When you switch to a different dashboards or page, the time condition will not be preserved. Please be aware.
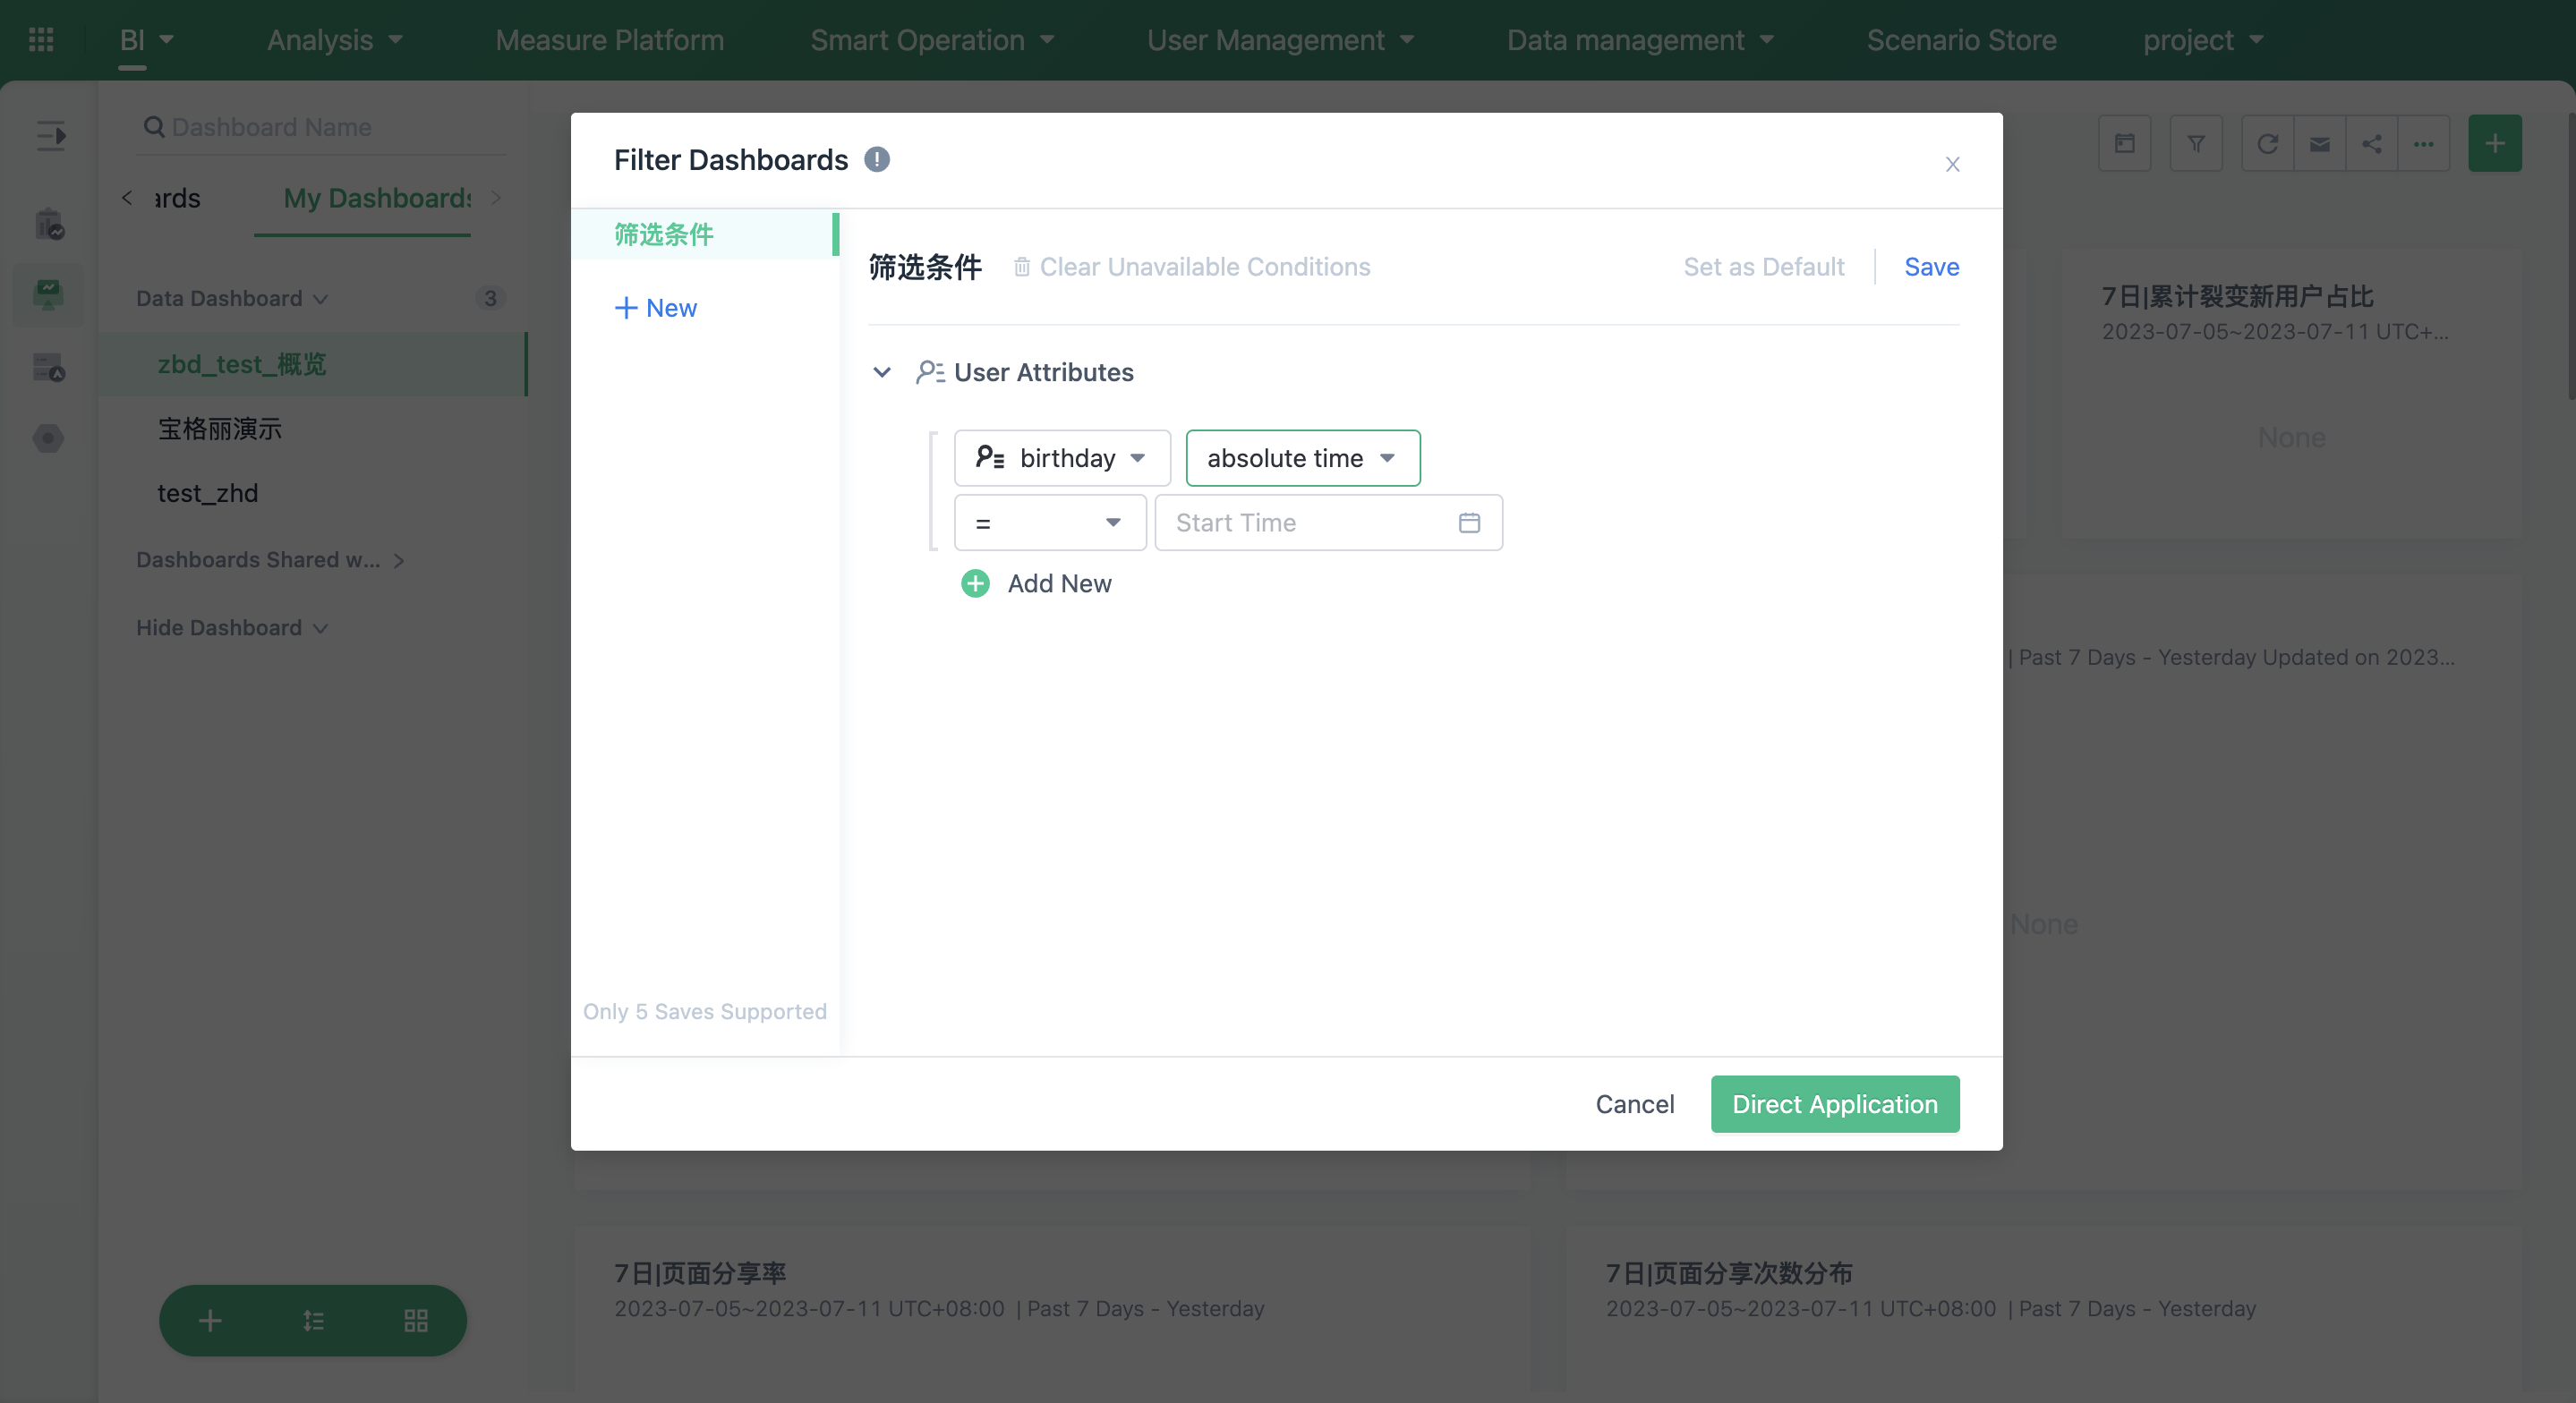
4.6. Global filtering of event properties and user properties.
After clicking the filter button, you can configure the filter criteria in the pop-up window. Only filtering for "Event Properties" or "User Properties" is supported. If filtering criteria are set for both "Event Properties" and "User Properties", the query relationship between the two categories of properties is "AND". You can also save the filter criteria condition, up to 5 historical filters can be saved.
Note that global filtering only applies to some analysis models. Currently, it is possible to filter the analysis results of "User Analysis," "Event Analysis," "Retention Analysis," "Distribution Analysis," "Attribute Analysis," and "Session Analysis." Among them, "Session Analysis" and "Attribute Analysis" only support user properties.
In the case of event properties, we have specially marked the classification of the selected properties to help you use the current filtering options more effectively.
- Public properties: refers to "Event Properties" that all events in the dashboards have, and when using such attributes for filtering, it can take effect on all analyses.
- Non-public properties: refers to "Event Properties" that exist only in individual events in the dashboards. When using such attributes for filtering, the filtering query for events that do not contain this property will automatically fail.
Note: Event properties do not currently include virtual attributes; user properties currently do not include virtual attributes, user segments or user tags.
Save Historical Filters
- Up to 5 historical filters can be saved.
- Support Editing and deleting the preserved historical filter conditions.
- Support setting the saved historical filter as the default filter. Once set as the default filter, the dashboards will be queried based on the filter conditions contained in the historical filter every time it is re-entered.
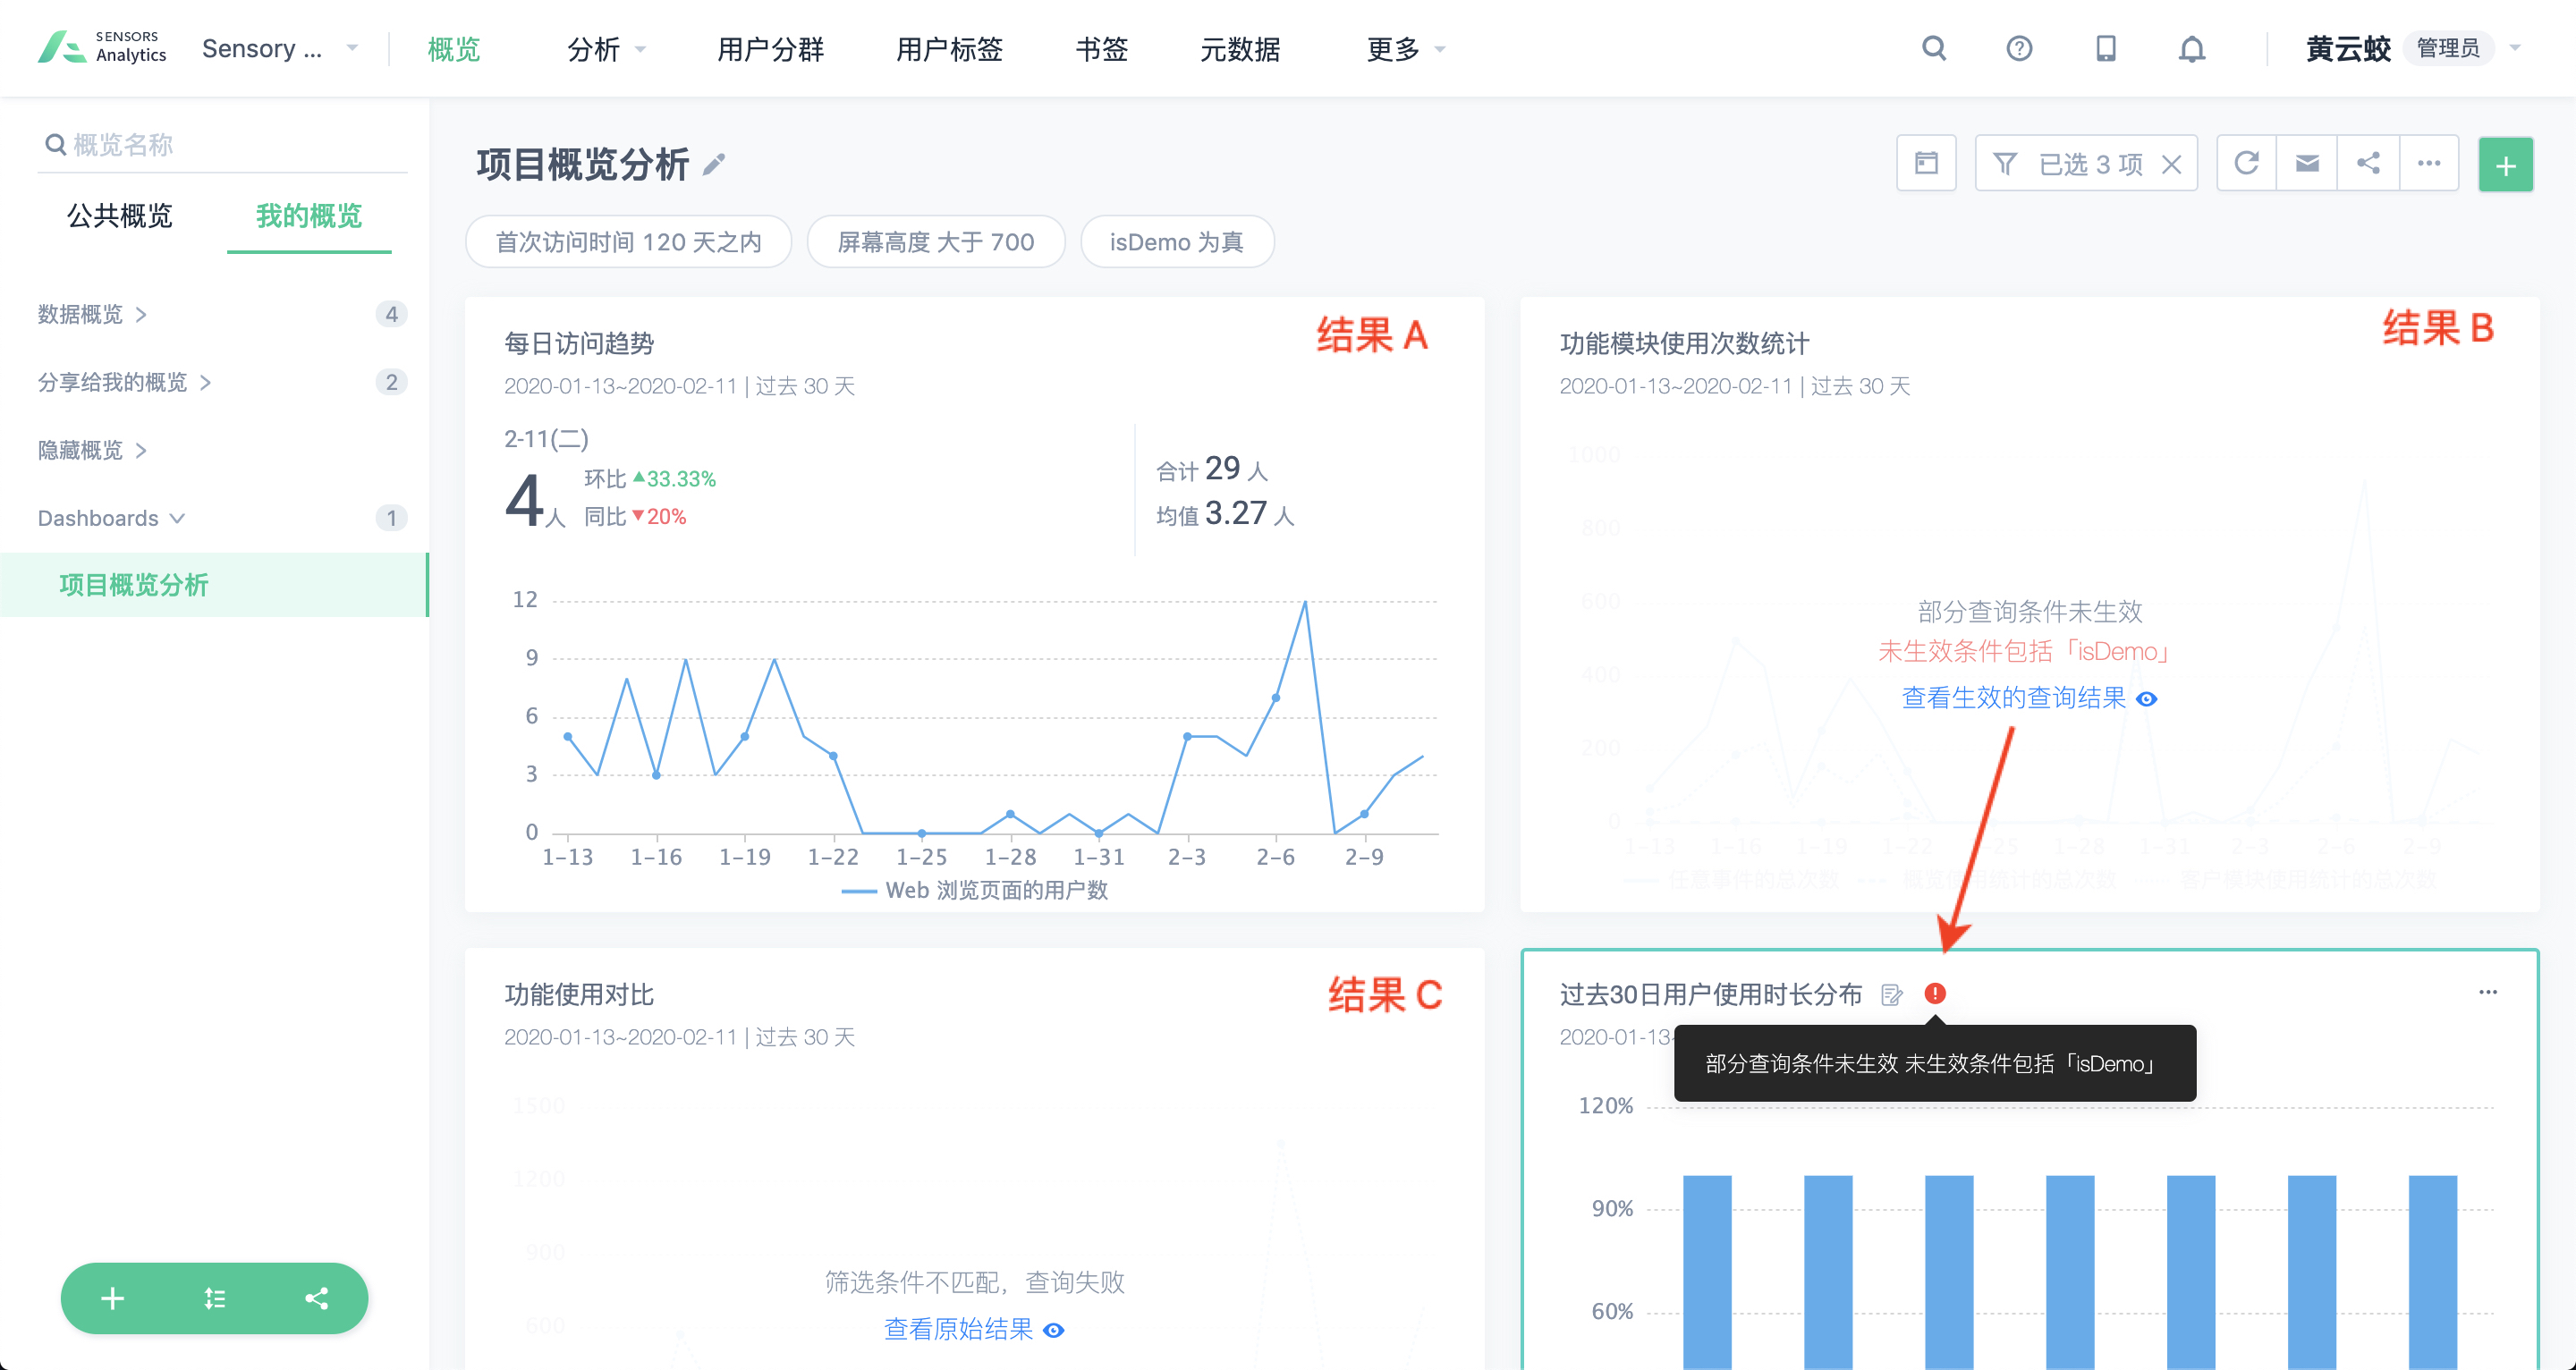
There are three possible results of the widget after applying the filter condition.
- Result A: All filter conditions take effect.
- Result B: "isDemo" is not a public event attribute of all events used in this analysis, so this condition is not effective. However, users can still click "view effective query results" to view other effective filter conditions and the resulting data.
- Result C: None of the filter conditions match the public event attributes of the events used in this analysis, so the query fails. However, users can still click "view original results" to view the original analysis results.
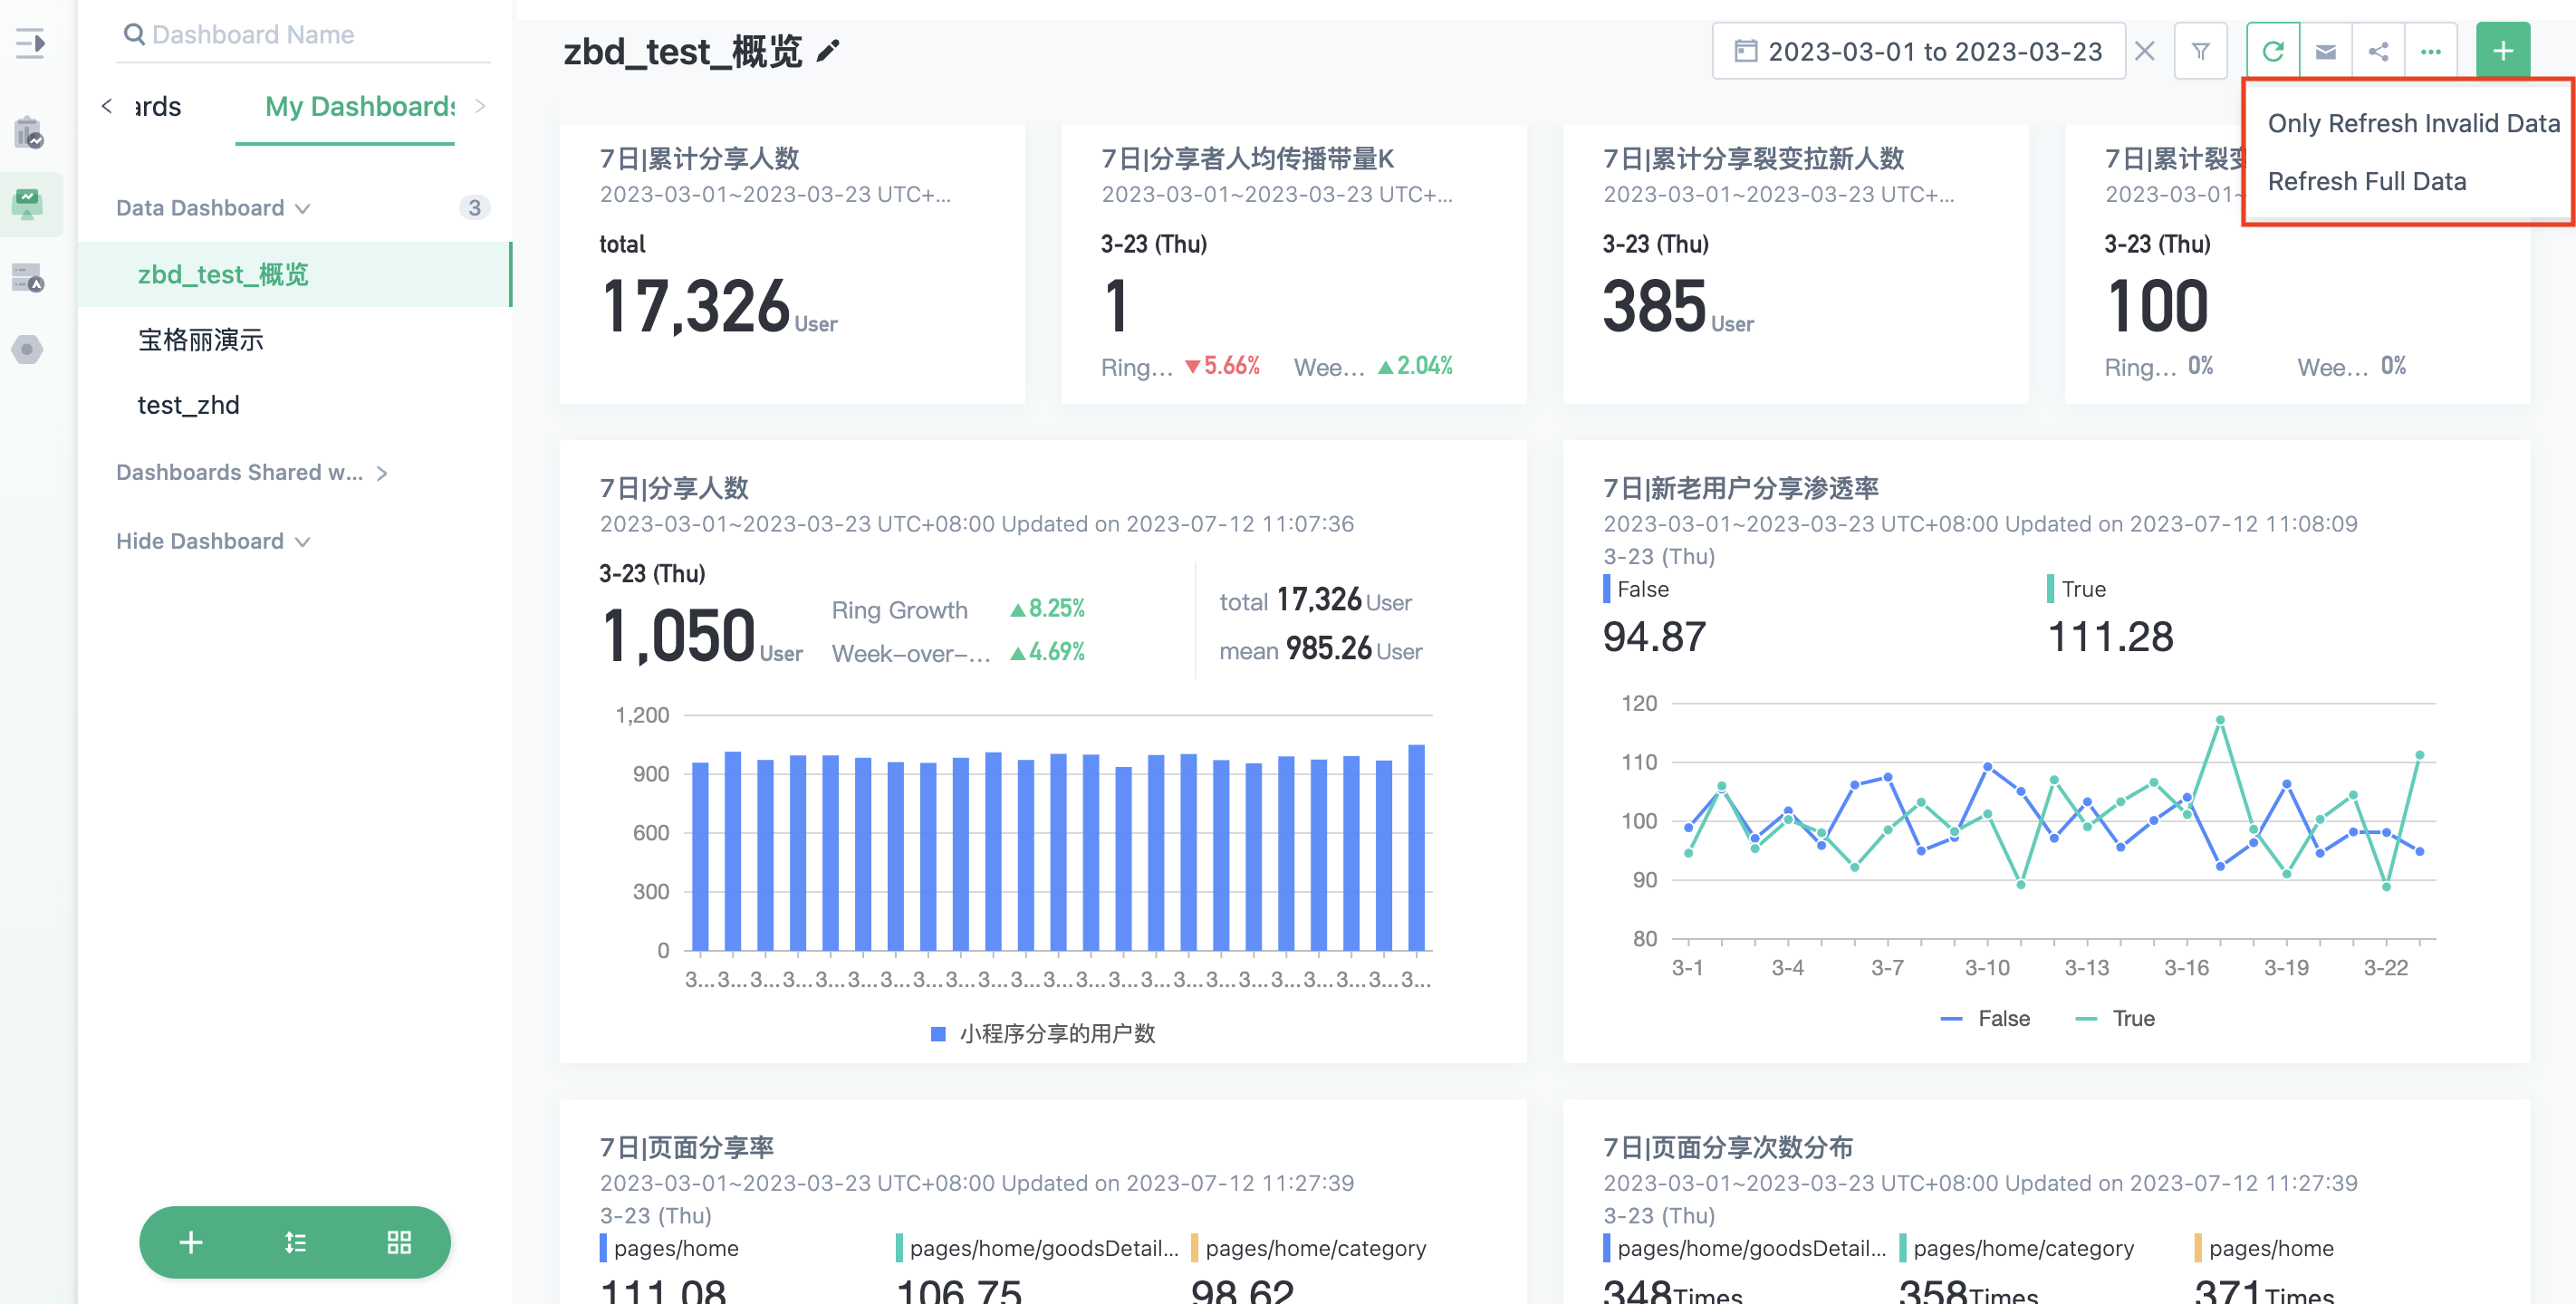
4.7. Refresh the current calculation data (refresh only the invalid data, or refresh the full data)
Refresh invalid data: In order to improve the query efficiency, the query results of the Sensors Analytics are cached data, and the cached data is cached daily. The cache invalidation mechanism is:
(1) In the time range of the query, if the total number of event data entered that day is less than 100,000, and new data is entered, the cached data will be invalidated. Click the refresh invalid data button to re-query the latest data.
(2) In the time range of the query, if the total number of event data entered that day is more than 100,000 and new data is entered, and the amount of new data is less than 5% of the total queried last time, then the cached data queried before does not expire. Click the refresh invalid data button to query the latest data.
(3) In the time range of the query, if the total number of event data entered that day is more than 100,000, and new data is entered, and the amount of new data is greater than or equal to 5% of the total queried last time, then the cached data queried before expires. Click the refresh invalid data button to re-query the latest data.
Refresh full data: Whenever new data is entered, click the refresh full data button to query the latest data.
4.8. Dashboards Sending Settings
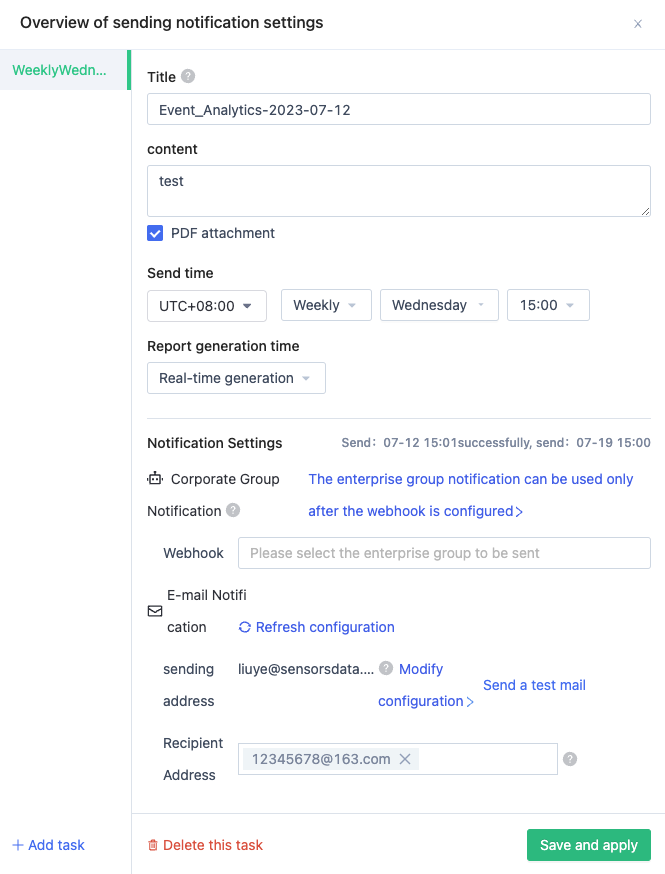
You can configure email and enterprise group (Webhook) sending on the system interface. You can only configure mail and enterprise group (Webhook) sending for data profiles you create. First select a self-created data profile, and then click the "mail icon" on the top right as shown above, a dialog box will pop up, in which you can complete the sending configuration.
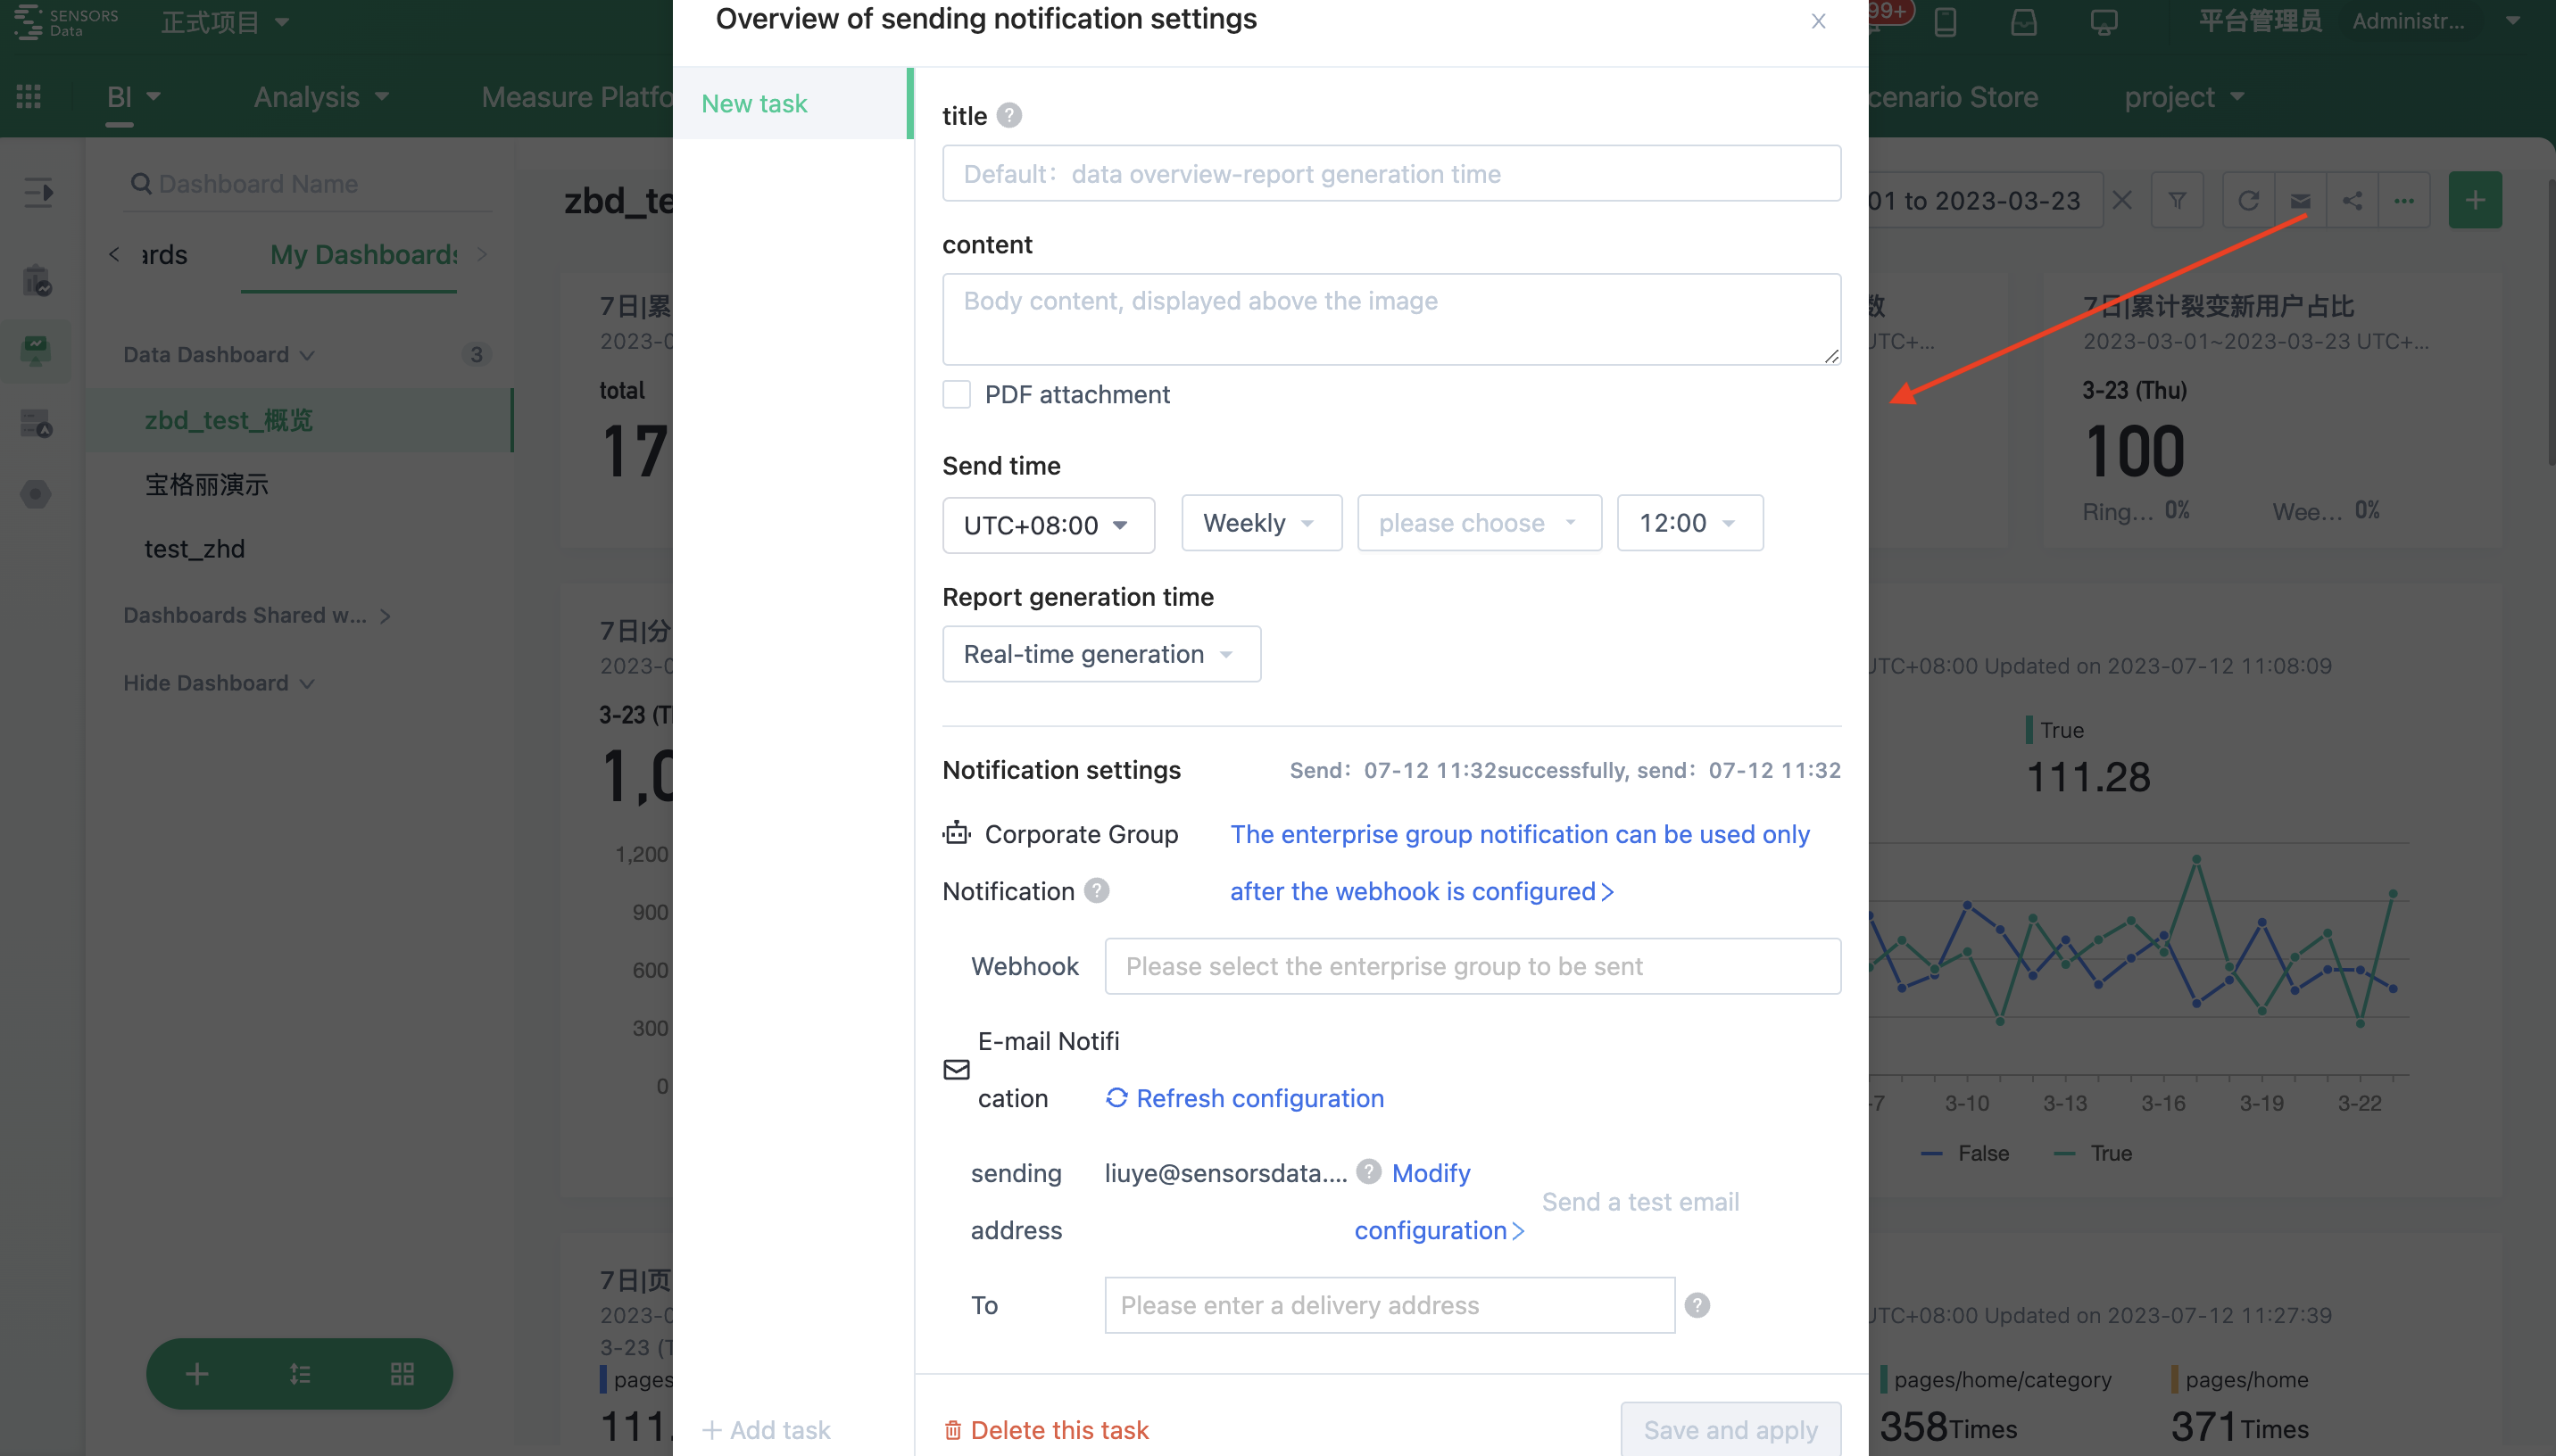
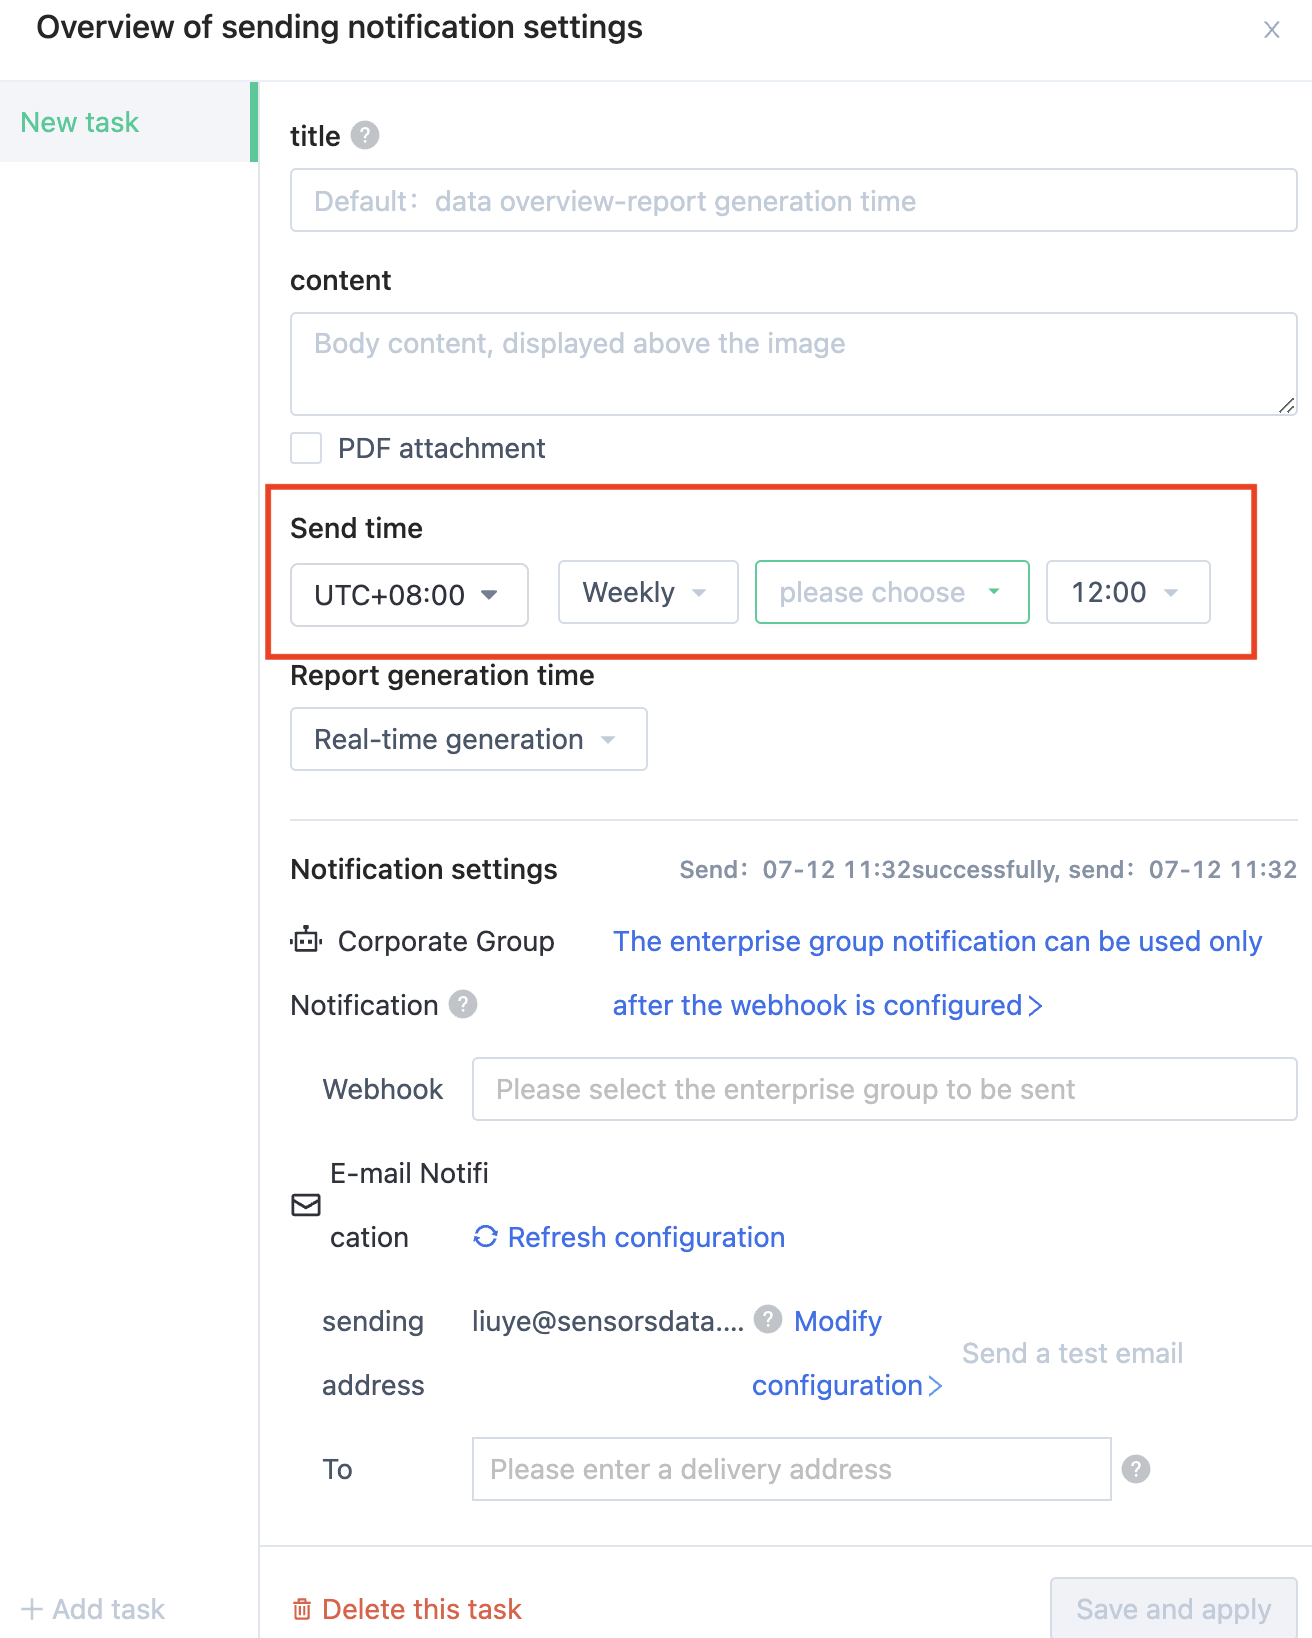
Step 1: Set the content to be sent
The content of the dashboards sending includes: title, body, image, and PDF. The title and content can be filled in by yourself, and the PDF can be selected whether to be sent. The image is sent by default.
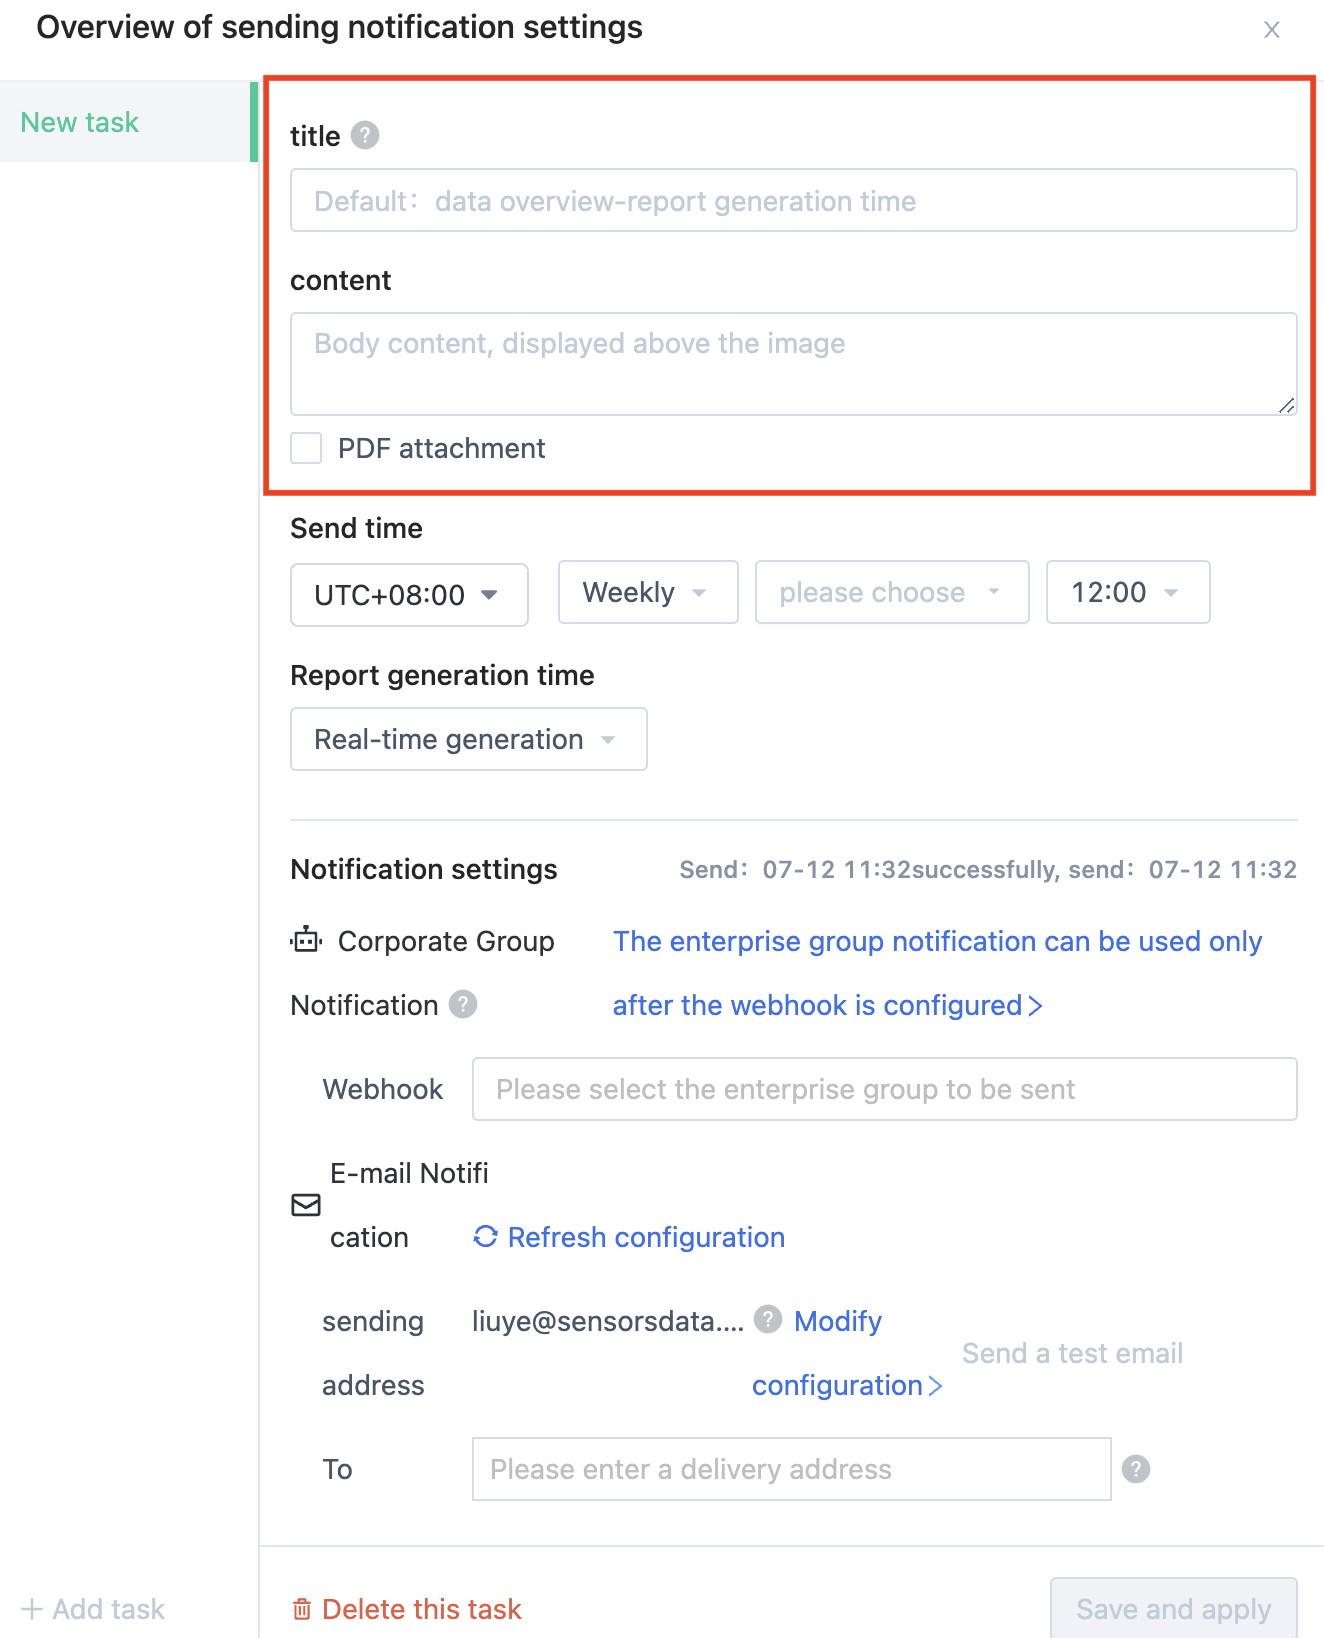
Step 2: Set the sending time
The email sending task starts at the "sending time" set, but the final sending time may be delayed by 2 to 15 minutes because the time to obtain data and render data cannot be determined. If complete dashboards data cannot be obtained within 10 minutes, the email will fail to be sent.
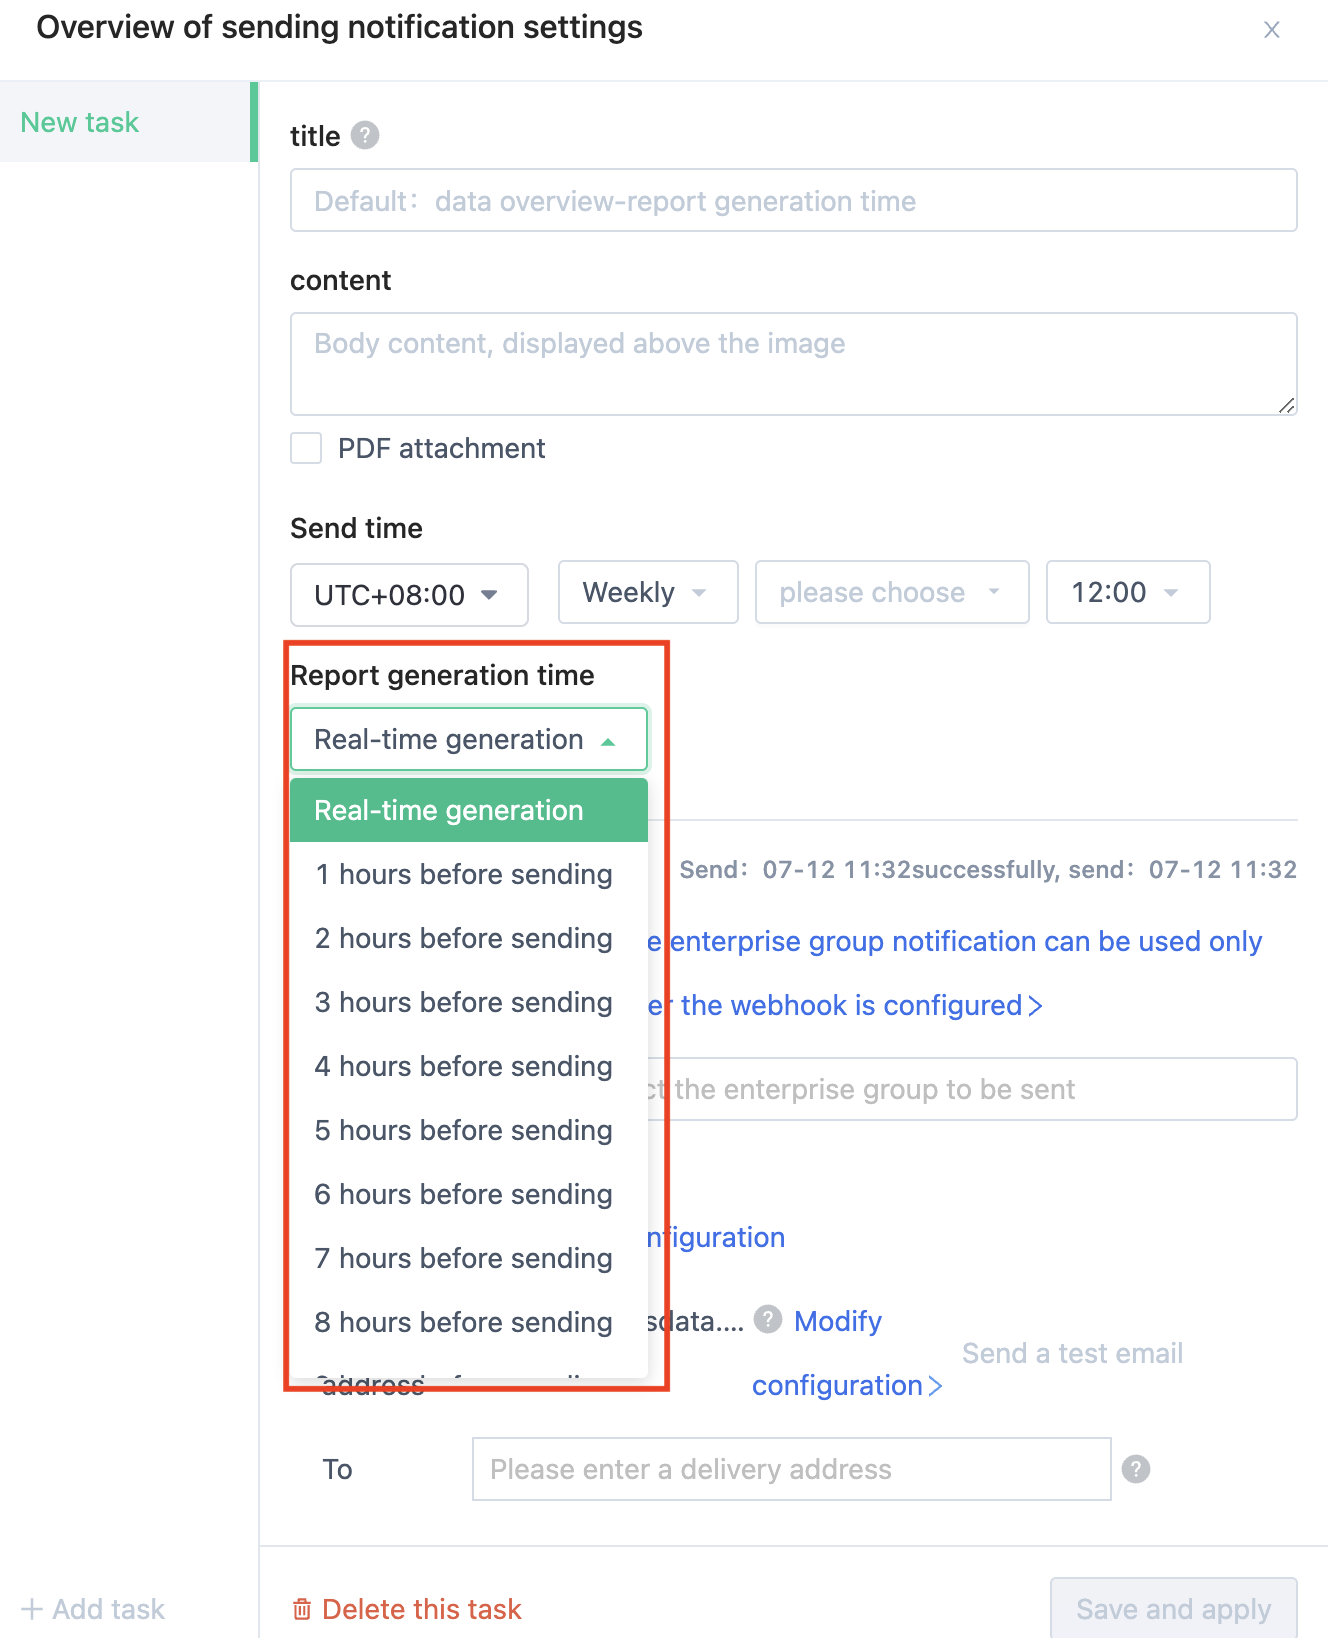
Step 3: Set the report generation time
For example, if the time range selected in the dashboards is "yesterday" and the "sending time" in the email configuration is set to "09:00 every day", and the current date is July 24, 2017, the email will be sent at 9:00 on July 24, but different "report generation times" will have different effects on the data.
Real-time generation: The time range selected in the dashboards is "yesterday" of July 23, 2017, which is consistent with reality. The data in the dashboards for that day is also data on July 23, 2017.
Sending 10 hours before: The time range selected in the dashboards is July 22, 2017, and the data in the dashboards is also data on July 22, 2017. The "current time" when sending the email is no longer the current time but 10 hours back from 9:00 on July 24, 2017. The "current time" becomes 23:00 on July 23, 2017.
Step 4: Set the sending method - Enterprise Group(Webhook) and Email sending
Support selection of Enterprise Group (Webhook) sending and email sending.
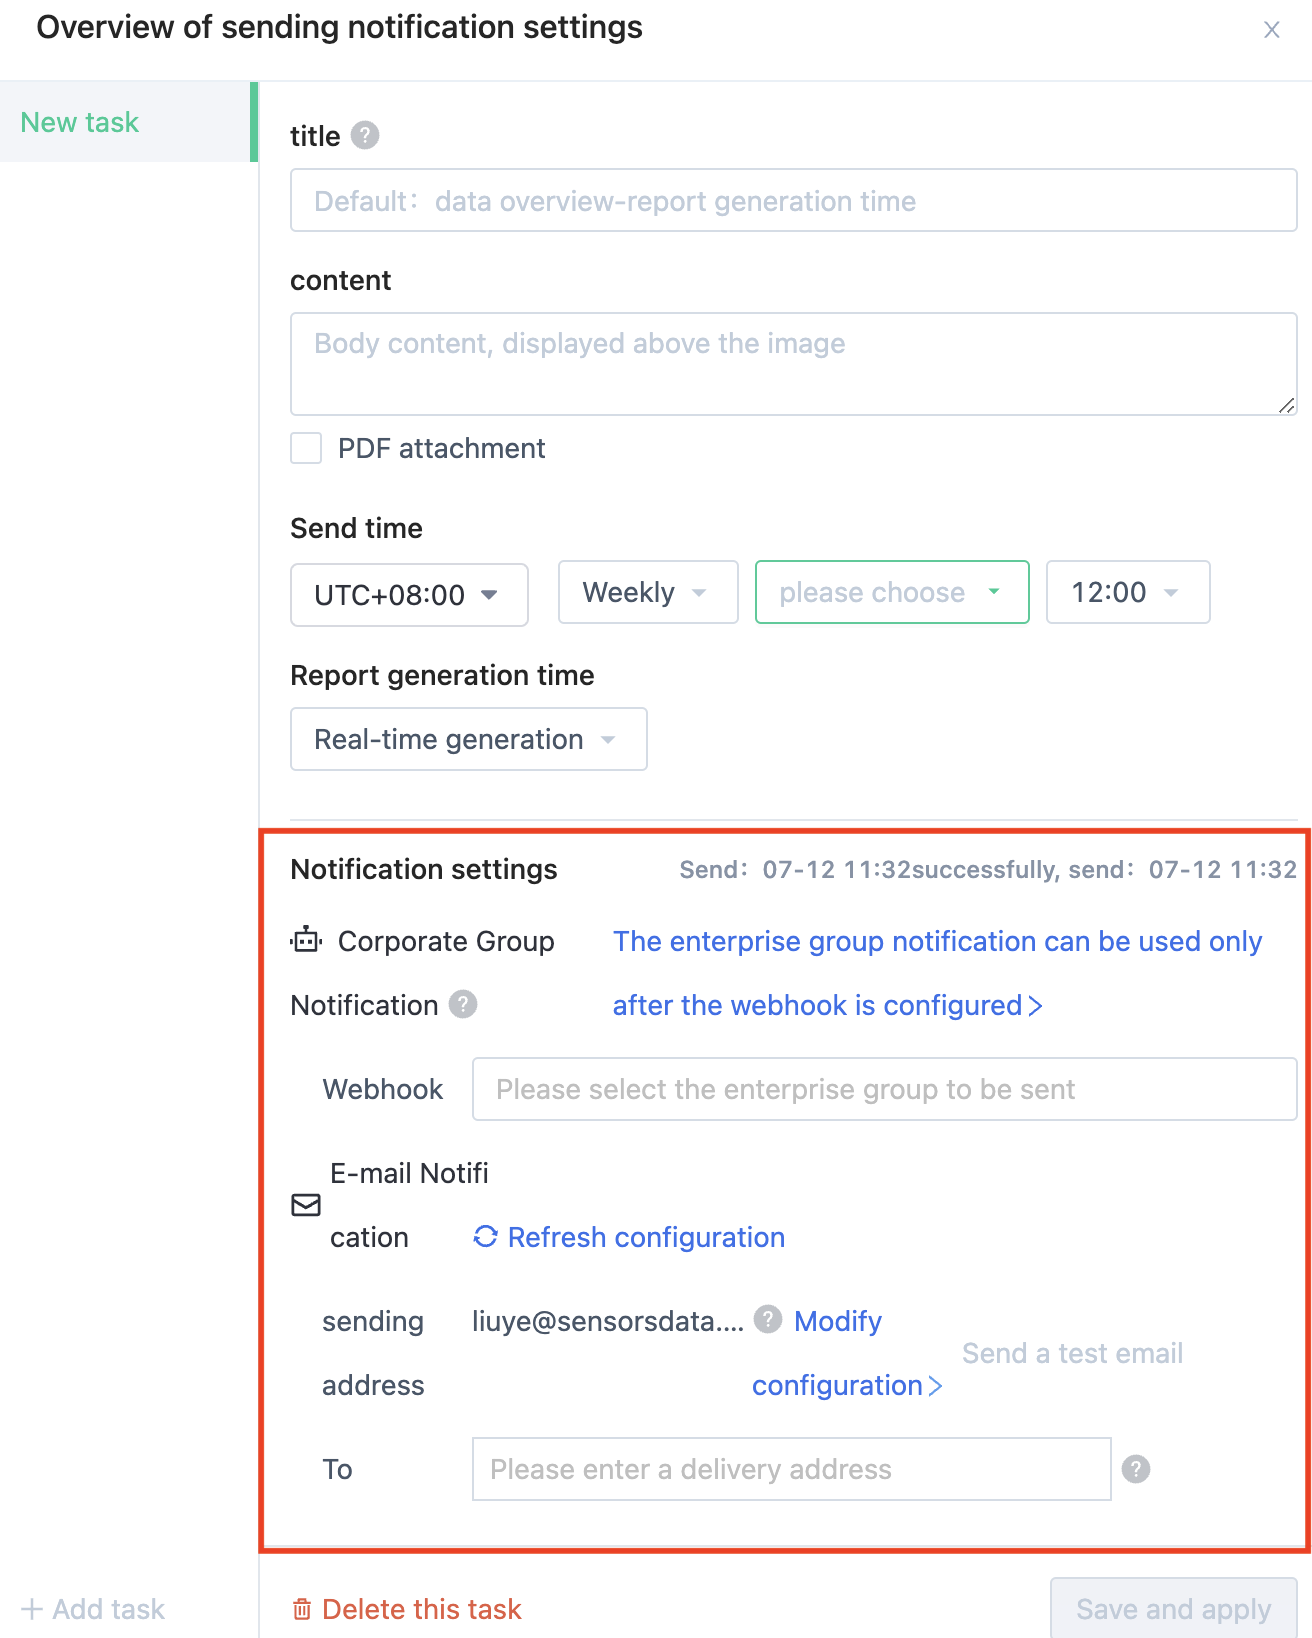
Enterprise Group(Webhook) sending
Send notifications to enterprise groups such as Feishu, DingTalk, and WeChat Work through Webhook. Support selection of multiple configured enterprise groups. For details on how to set up enterprise group notifications, please see How to set up enterprise group notifications.
Note:
- When adding a group robot to Feishu and DingTalk, you must fill in keywords. Only when the content of the sent message contains the keywords, can the group robot send the notification.
- The Webhook function is controlled by the license and needs to be enabled and the current user has Webhook usage permission before it can be used.
- If the client's SA environment can only be accessed within the intranet, the picture sent via Webhook can only be opened within the intranet.
- Starting from version 251, direct image sending is supported, but it is limited by the functions of each platform: DingTalk can only send normal images when DingTalk's network can access SA, otherwise it will send a broken image. If a broken image appears, please contact the staff of Sensors Analytics. Feishu only supports sending images through application robots and ordinary group robots do not support it temporarily.
Email sending-Get the mailbox configuration
In the sa2.4 version, the sender's address of the email will be set to the email address in "Mailbox Management" by default, as shown in the following figure:
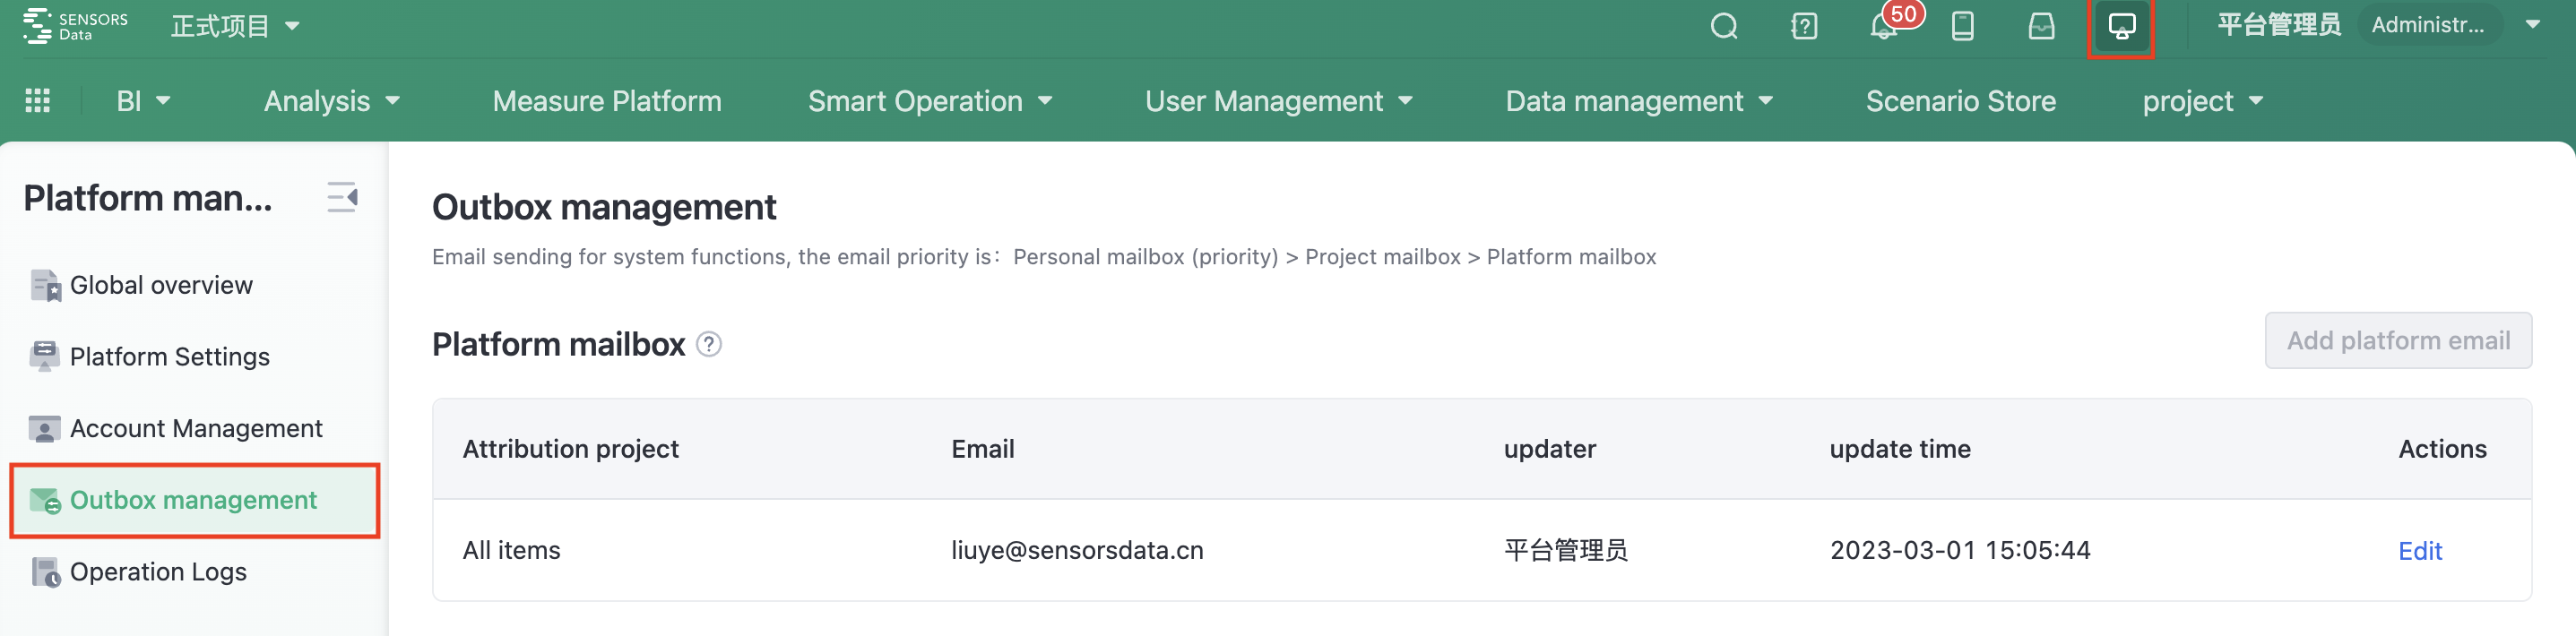
The dashboards provides a quick entry to Mailbox Management. When sending emails, the email address configured in Mailbox Management will be used. The priority order is personal email > project email > platform email.
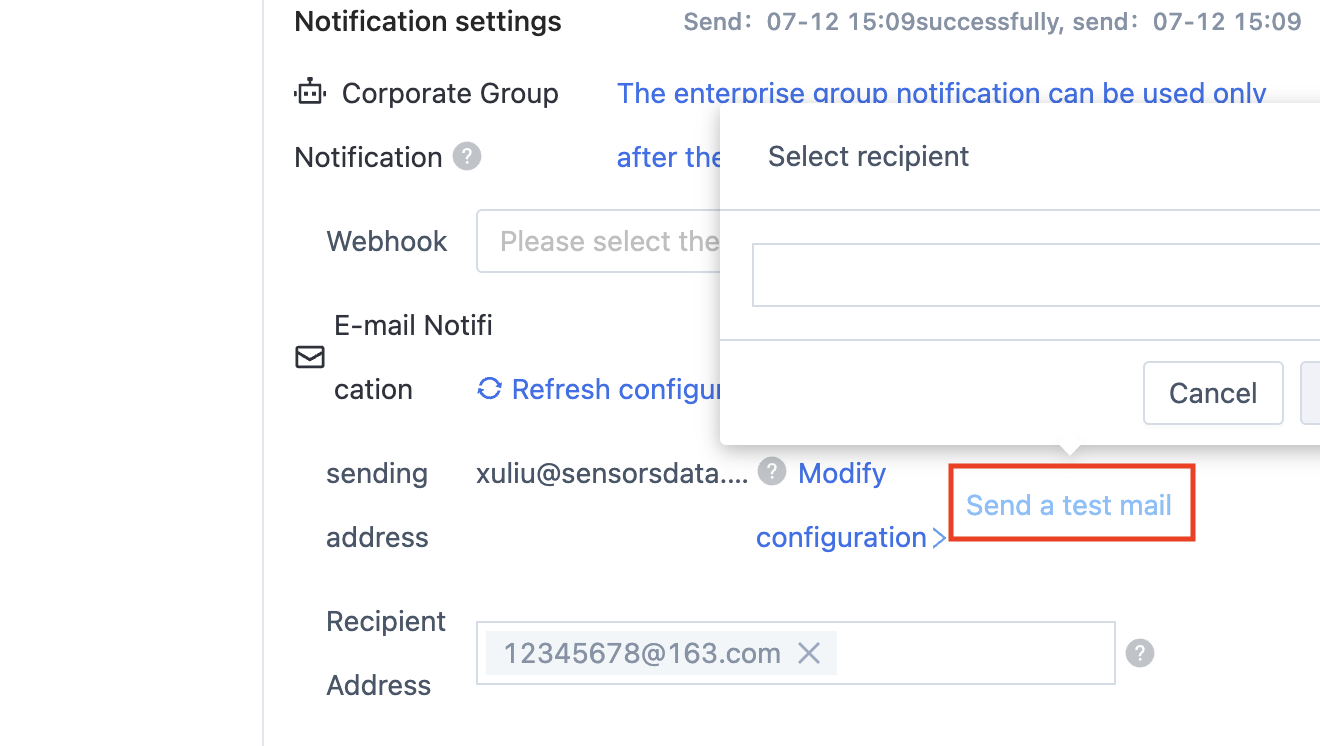
Email sending-Test sending
After the configuration is completed, you can click "Test Send" to ensure that the email can be sent normally and the content in Data Dashboards is correct.
4.9. Sharing Settings
You can share your dashboards with other members to view, and after the sharing is successful, it will be notified in the Notification assistant and automatically added to the other party's "My Dashboards"-"Dashboards Shared with me" list. When you modify the content of this dashboards, it will be updated synchronously for the viewer.
You can share your dashboards with all members, or specific roles, positions, or specific members.
4.10. More Actions: Performance Settings, Full Screen Mode, Stop Update, Copy Dashboards, Delete Dashboards, Export to PDF
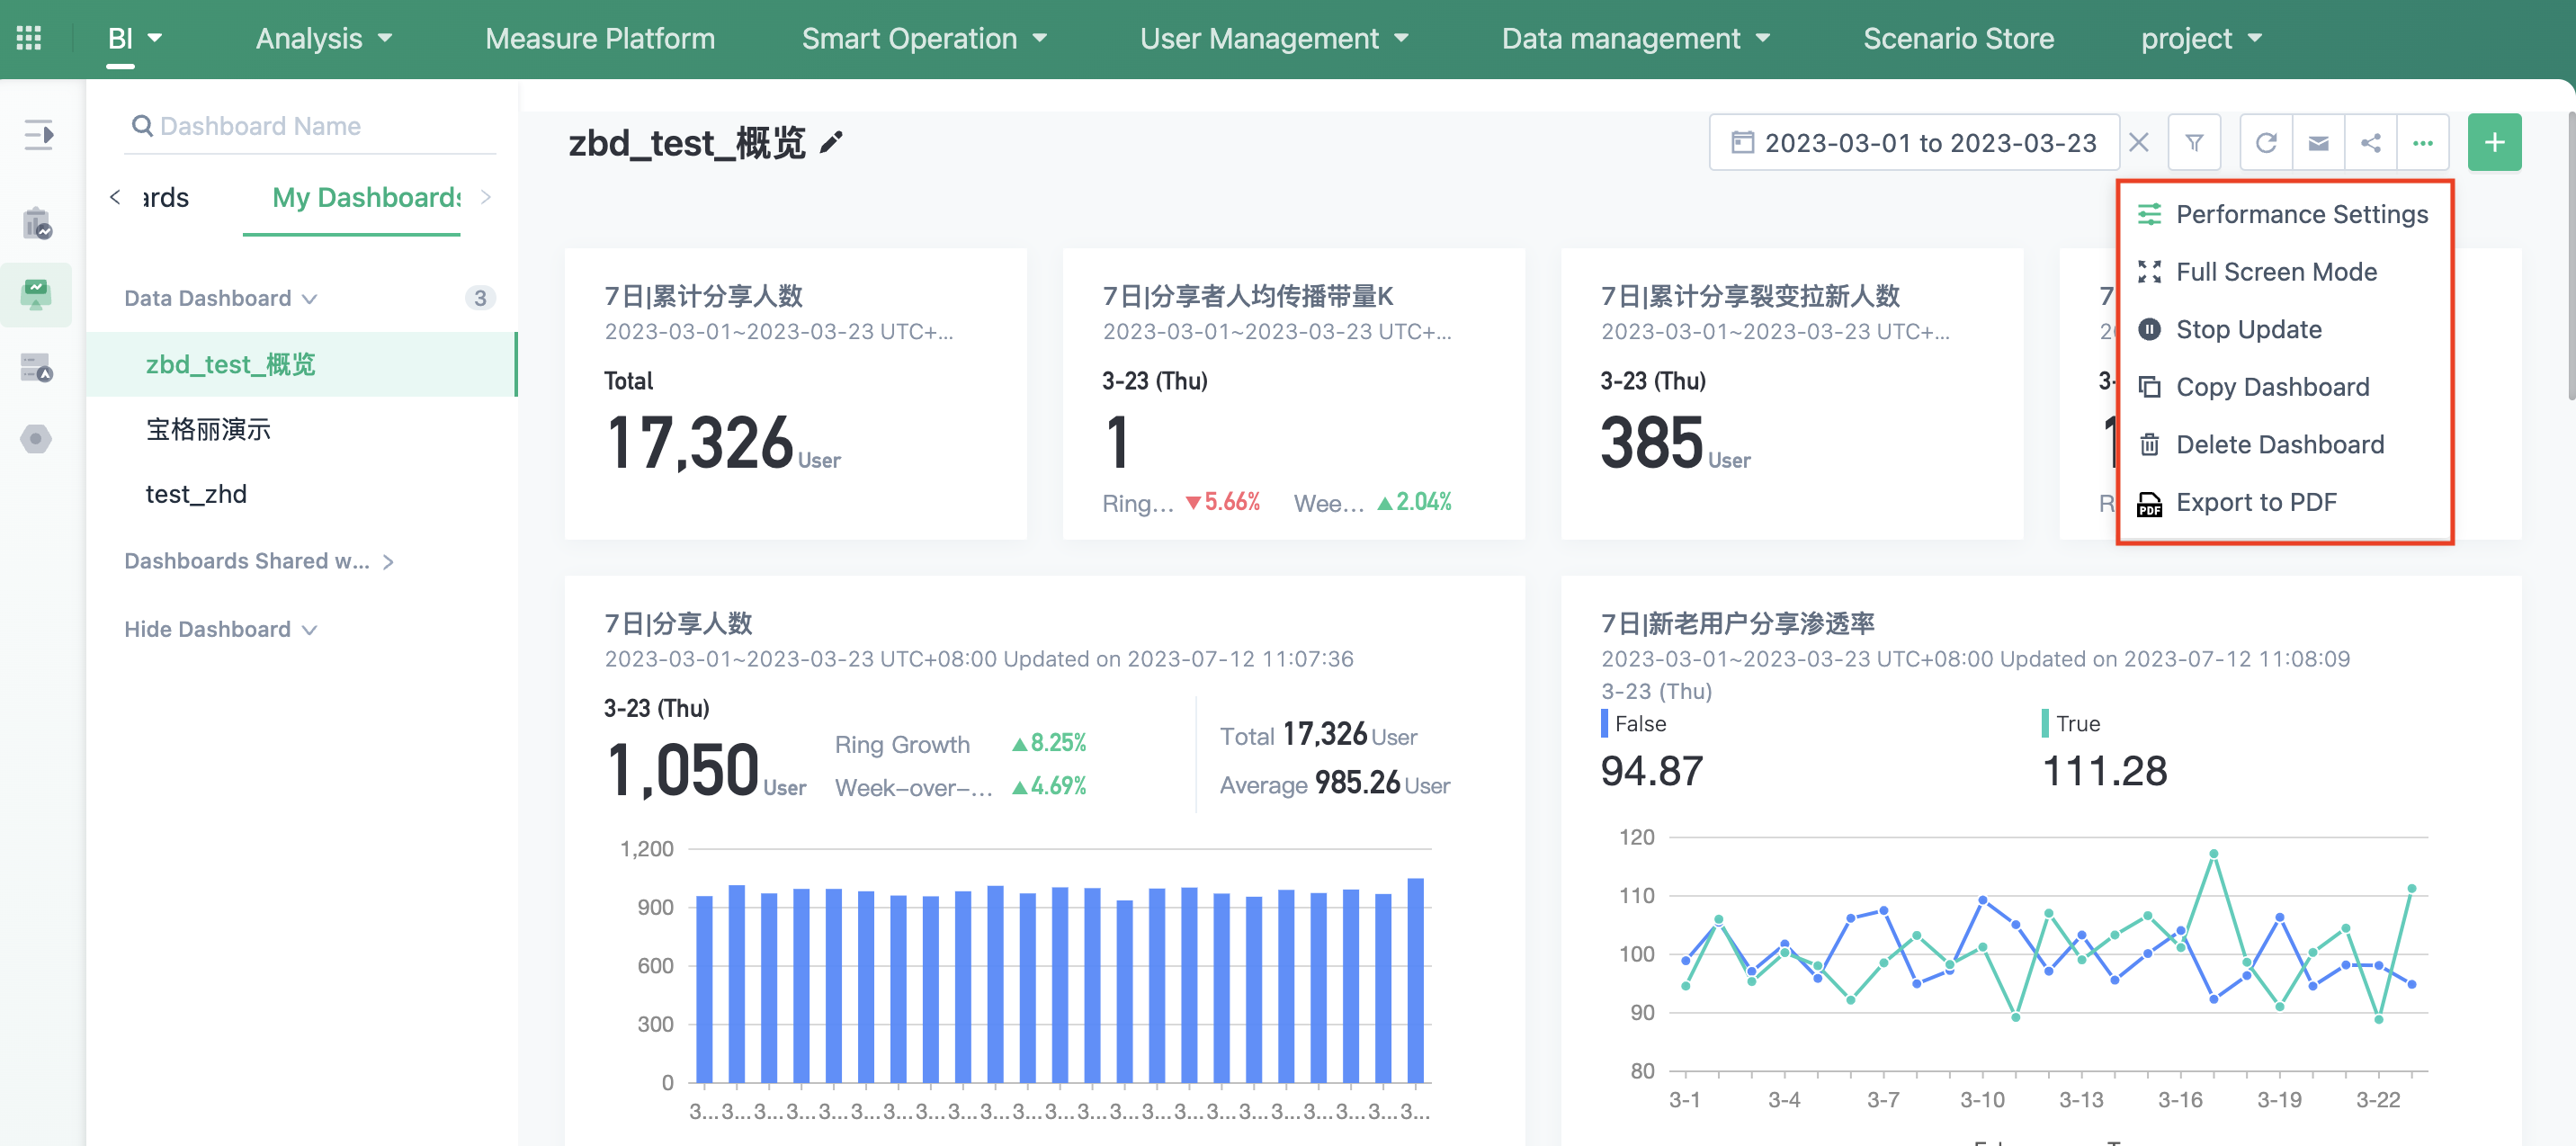
4.10.1. Performance Settings
Support dashboards performance adjustment in the interface, choose the appropriate configuration to improve the display efficiency of the dashboards, thus ensuring the effective use of query resources.
A. Typical scenarios
Customers with a large amount of data access (over 1 billion updates per day), if want to optimize query performance, can unify the trend-presenting metrics in a certain dashboards, adjust its dashboards performance, and reduce query time.
Customers whose machine configurations do not match the amount of data received, for example, a data volume of 100,000 daily activities with a high-end single machine configuration (the standard of a high-end single machine is 60,000 daily activities). In this case, the query is usually slow. Adjust dashboards performance to reduce query time. Of course, the best advice is to adjust the machine configuration to match the data volume.
B. Specific operations
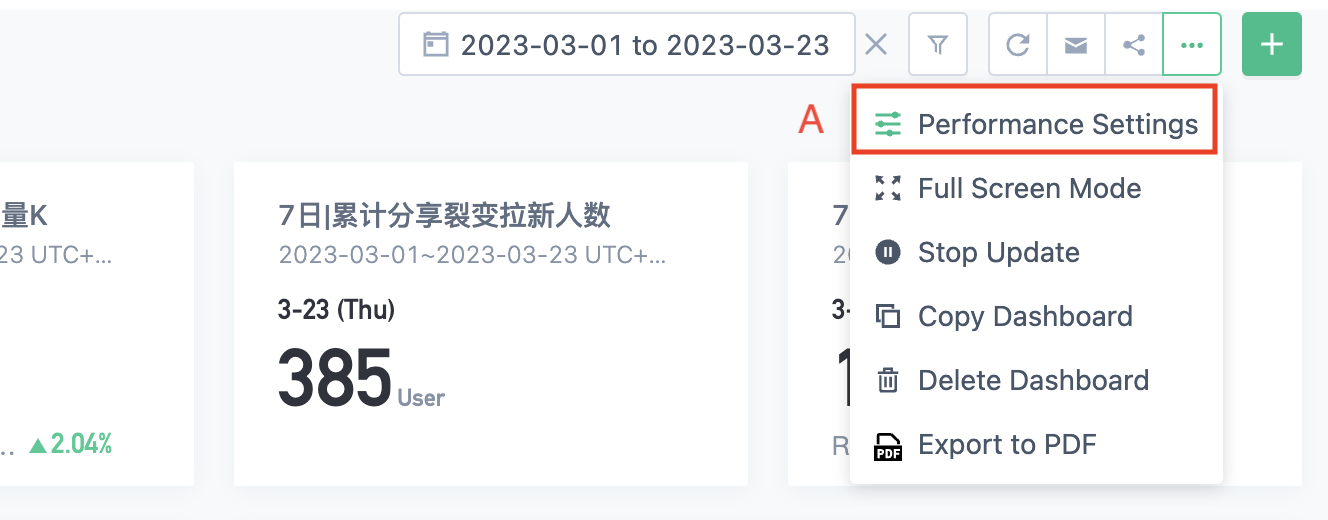
Step 1: Click the settings button at the upper right of the dashboards, select "Performance Settings" at A and the Performance Settings page will pop up (only the dashboards created by yourself have this entrance).
Step 2: Adjust the settings.
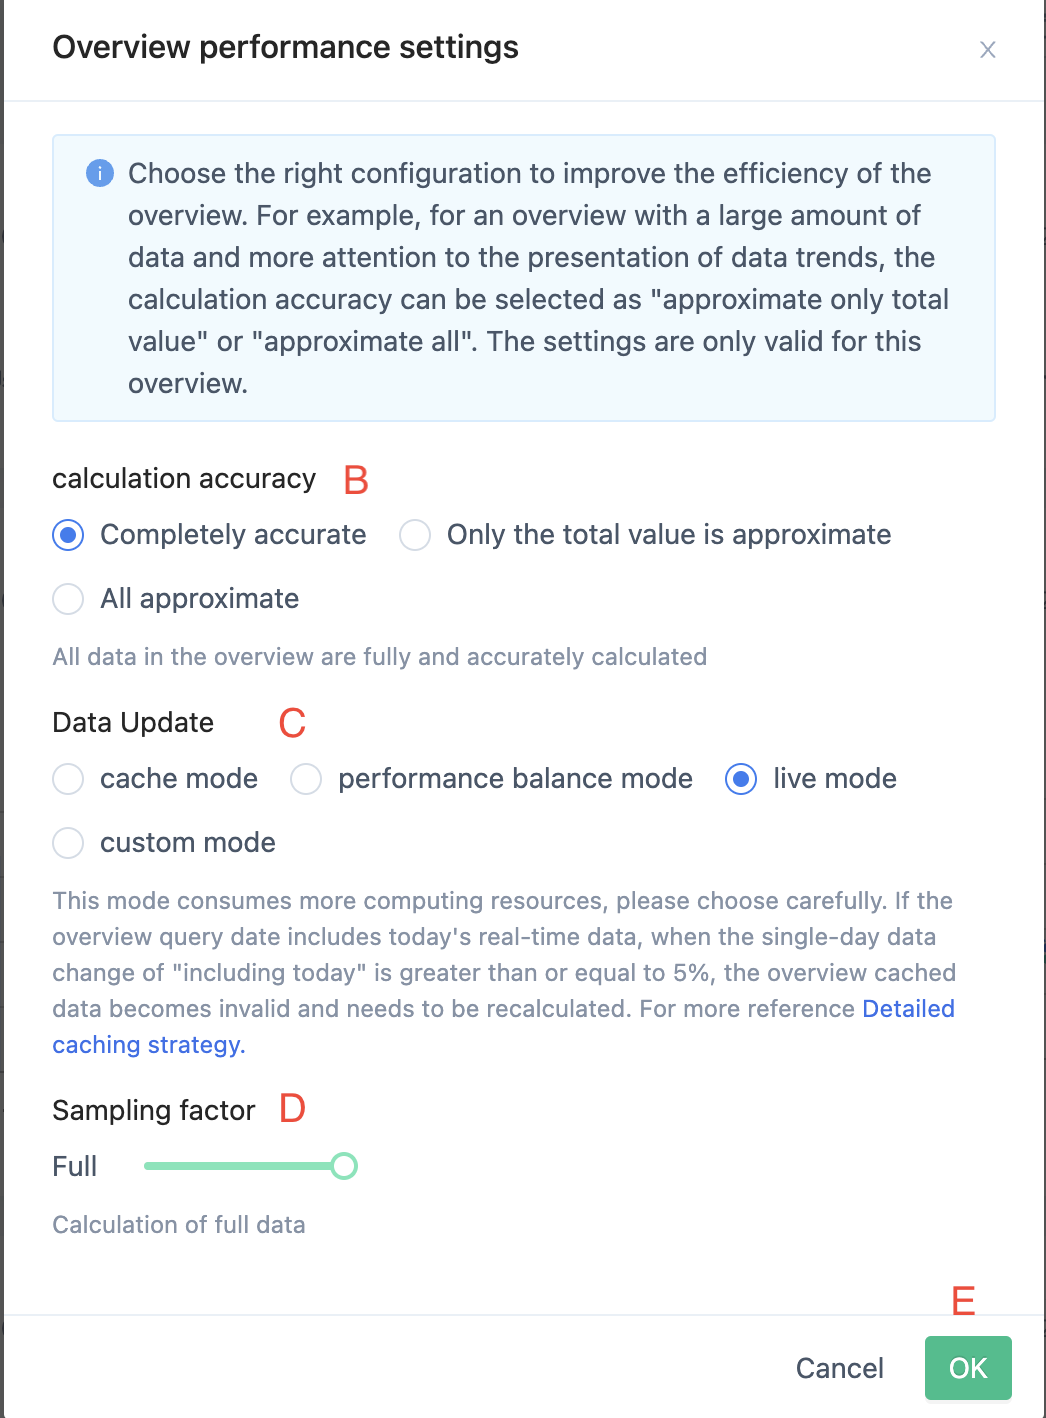
At B, select the calculation accuracy, and "Complete accuracy" is the default.
Completely accurate: All data in the dashboards is calculated with completely accurate;
Only the total value is approximate: Approximation calculation for the total value of all unique counts in the dashboards, and precise calculation for other data;
All approximate: Approximation calculation for all unique counts in the dashboards, and precise calculation for other data.
At C, "Data Update" is used to configure the update policy of the dashboards. The new dashboards will default to the "Data Update Default Policy" set by the project and supports modification.
Cache mode: The dashboards data is updated at 3:00 a.m. on a daily basis, and the dashboards data is not calculated repeatedly within the same day. It is recommended to use it in business scenarios such as daily and weekly reports to save calculation resources.
Performance balance mode: When the change of the daily data (excluding today's) is greater than or equal to 5%, the dashboards cache will be recalculated. This mode can take into account the changes in historical data and refresh in real-time. It is recommended to select it when real-time data for today is not needed.
Live mode: This mode consumes more calculation resources, so please choose carefully. If the dashboards query date includes today's real-time data, the data will become invalid when the change of the "including today" single-day data is equal to or greater than 5%, and you need to recalculate the dashboards cache.
Custom mode (updated every X minutes): Customize the cache update frequency. Once the time limit is reached, it triggers recalculating. If it is necessary to define the cache update according to time, it is recommended to reduce the update frequency to avoid the consumption of calculation resources caused by frequent cache refreshes.
At D, adjust the sampling factor: default calculation is for all data. You can drag or click the horizontal slider to adjust the sampling factor.
Click the Confirm button at E to make the setting effective, which only affects the current dashboards.
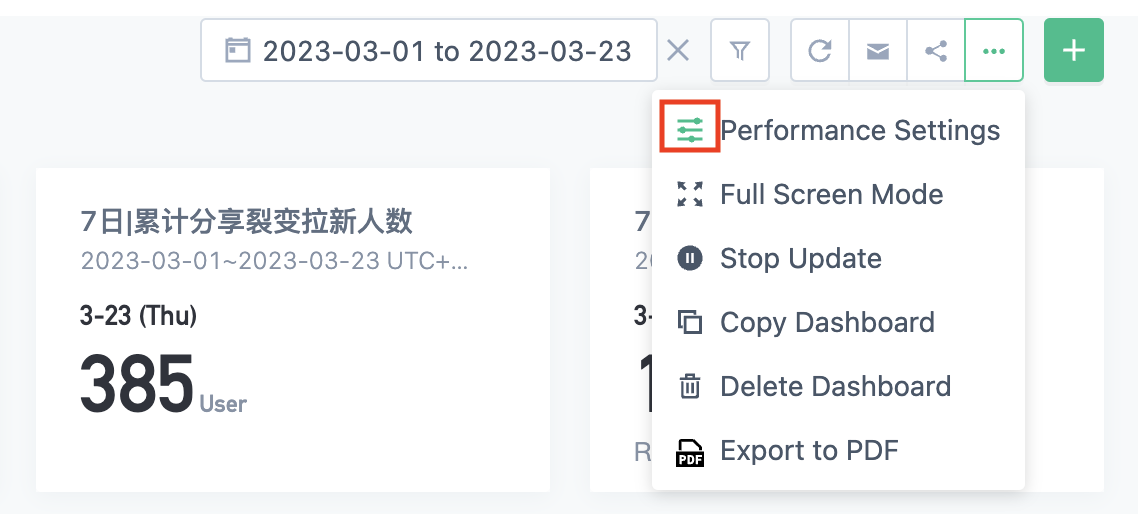
Step 3: If the dashboards performance is not set as the default configuration, the settings button will be highlighted as a reminder.
4.10.2. Full Screen Mode
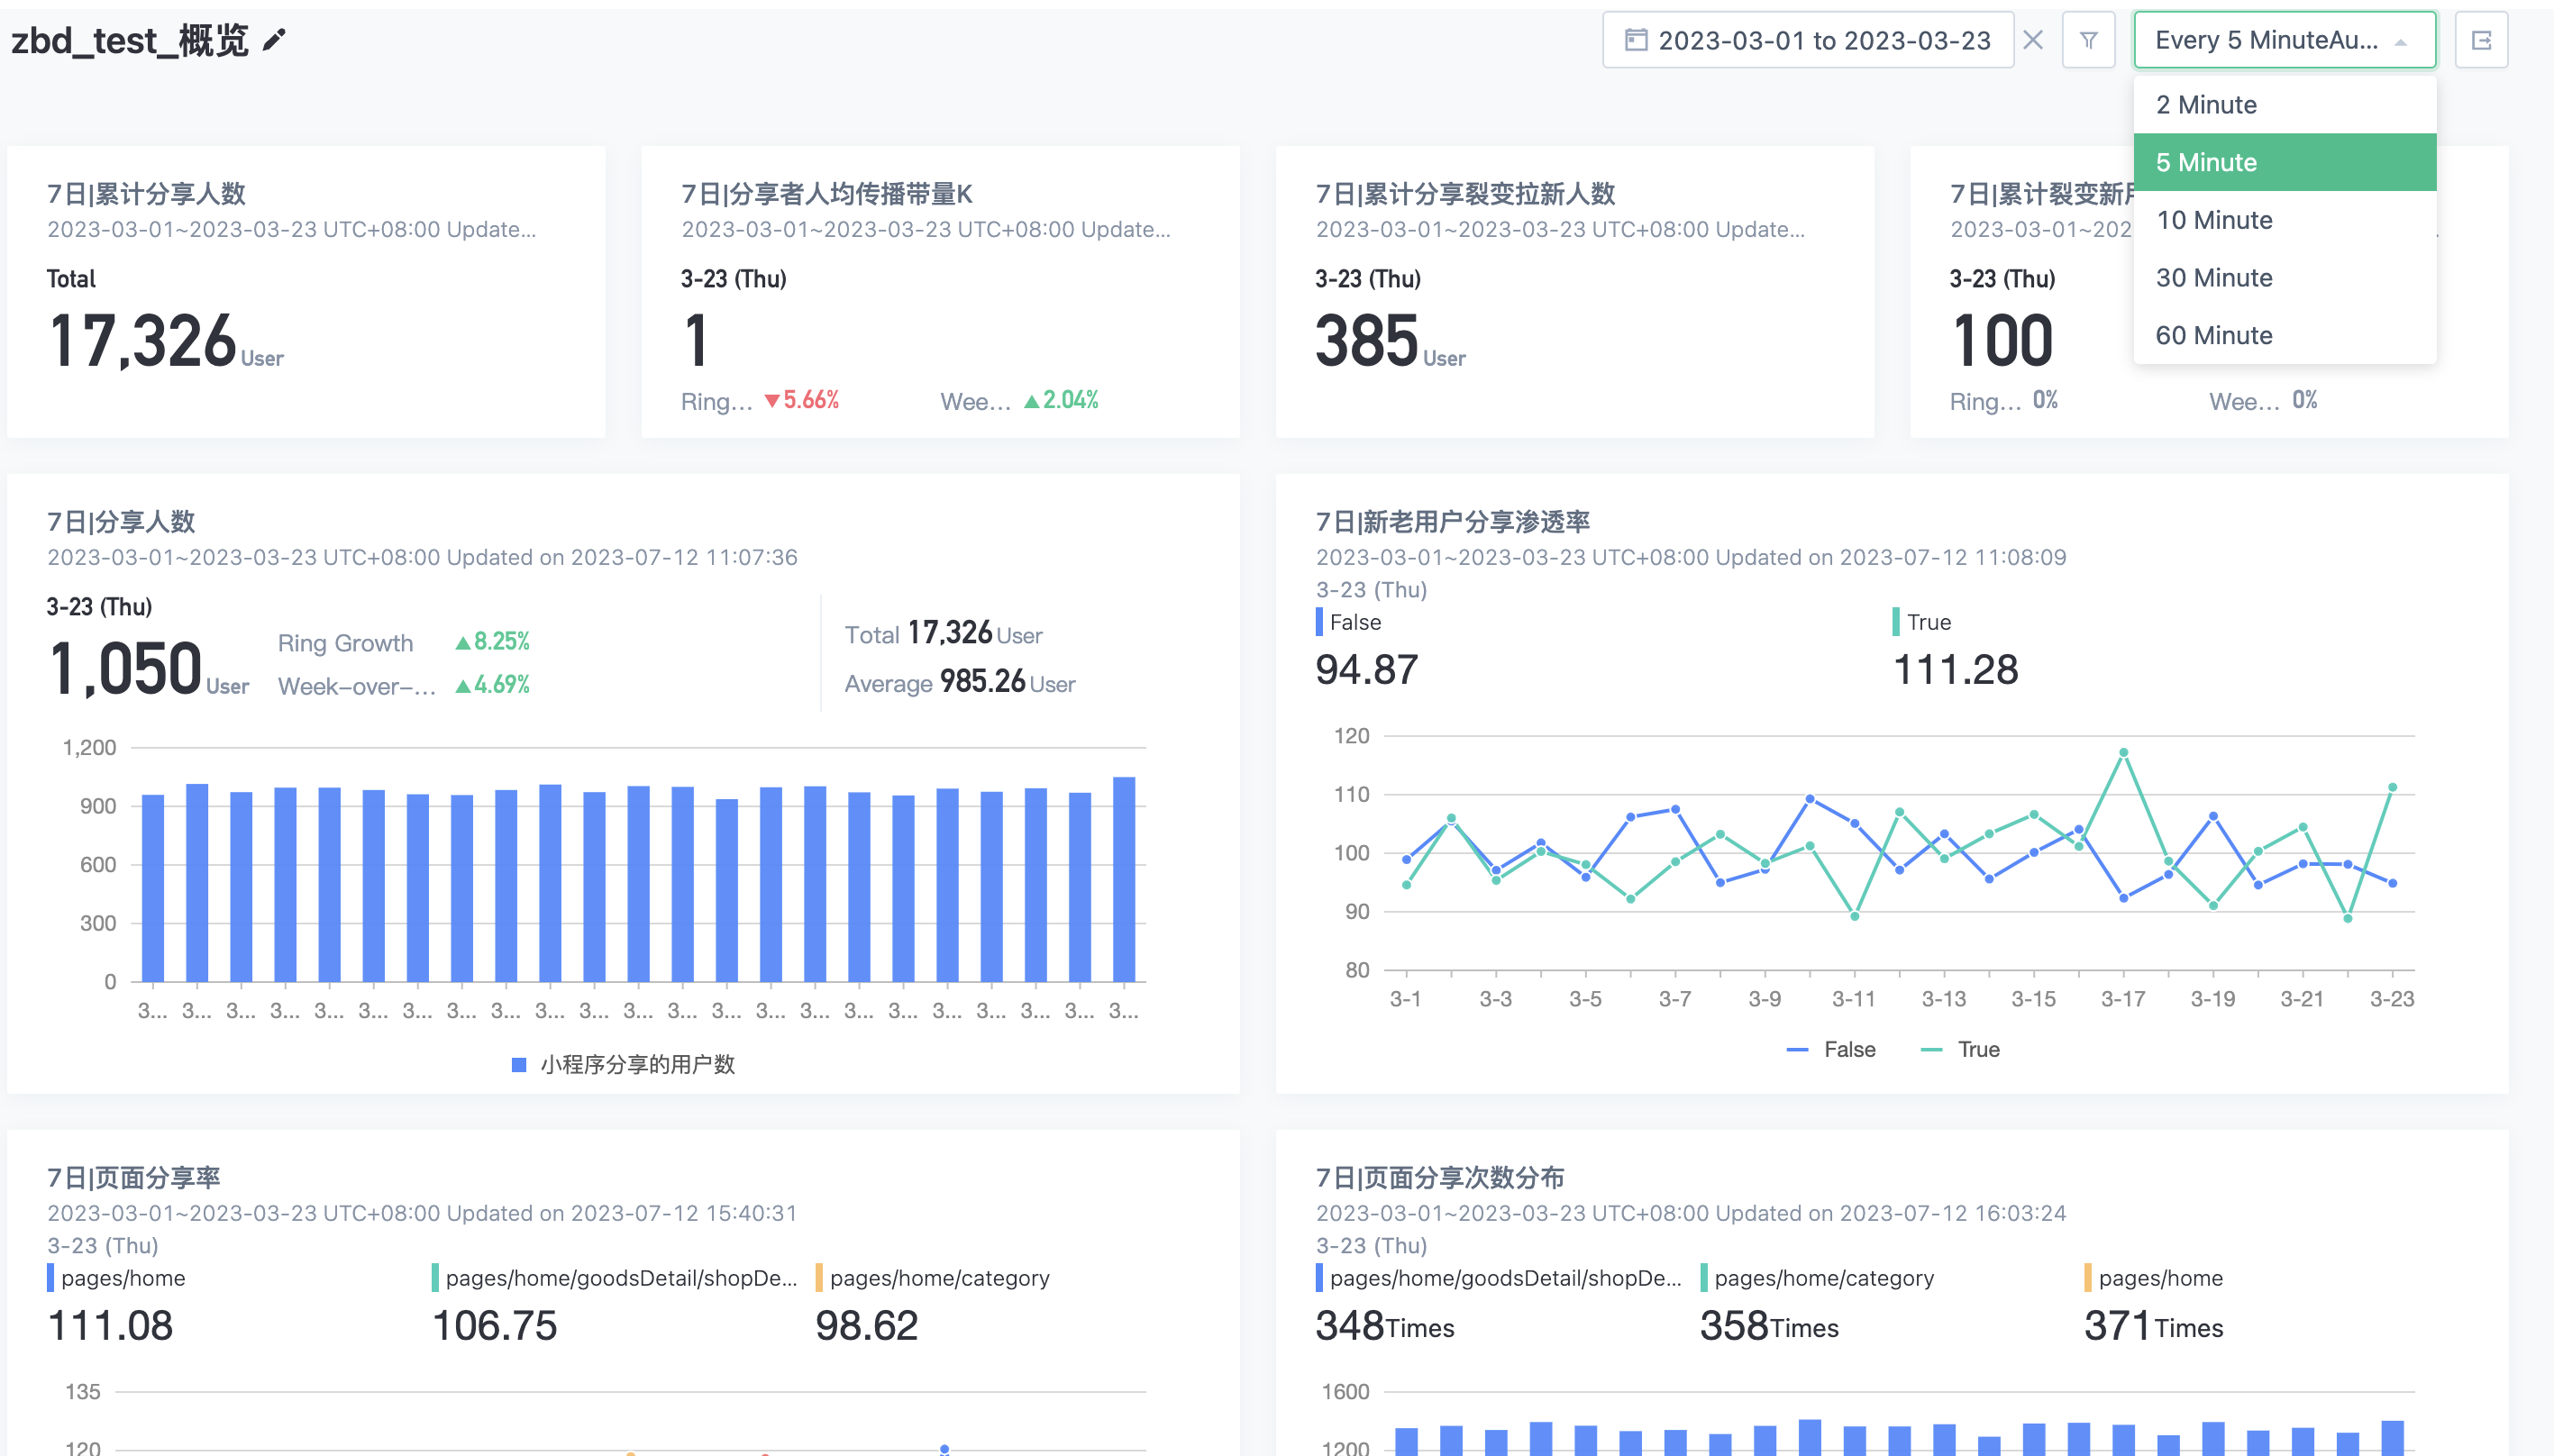
In full screen mode, you can set the interval time for automatic data refresh. In this mode, the navigation bar is hidden, but the global filtering function in the dashboards can still be used. Click the first button on the far right of the upper right corner or press ESC to exit full screen mode.
4.10.3. Stop Update
When you have a large number of dashboards in your project and it affects performance, resulting in slow queries, you can "stop updating" the dashboards that are no longer needed for daily attention. The dashboards will no longer be updated every day, thus preserving computational performance. If there are changes in business and data needs to be monitored again, you can click "auto-update" in the same location as "stop updating" and the system will resume daily automatic calculations and caching of dashboards data, ensuring that users can view the latest data.
4.10.4. Copy Dashboards
In order for enterprises to quickly add existing dashboards to "Team Dashboards" or for users to quickly use the dashboards configurations of others to complete their own related analysis work, we provide the function of "Copy Dashboards", which applies to "My Dashboards" and "Team Dashboards". After copying, each analysis content can be customized. Please note:
- The "Basic Data Dashboards" in the Scene Library is a special type of dashboards that currently does not support quick copy.
- Only members with "Public Dashboards Management Permissions" can copy existing dashboards and add them to "Team Dashboards".
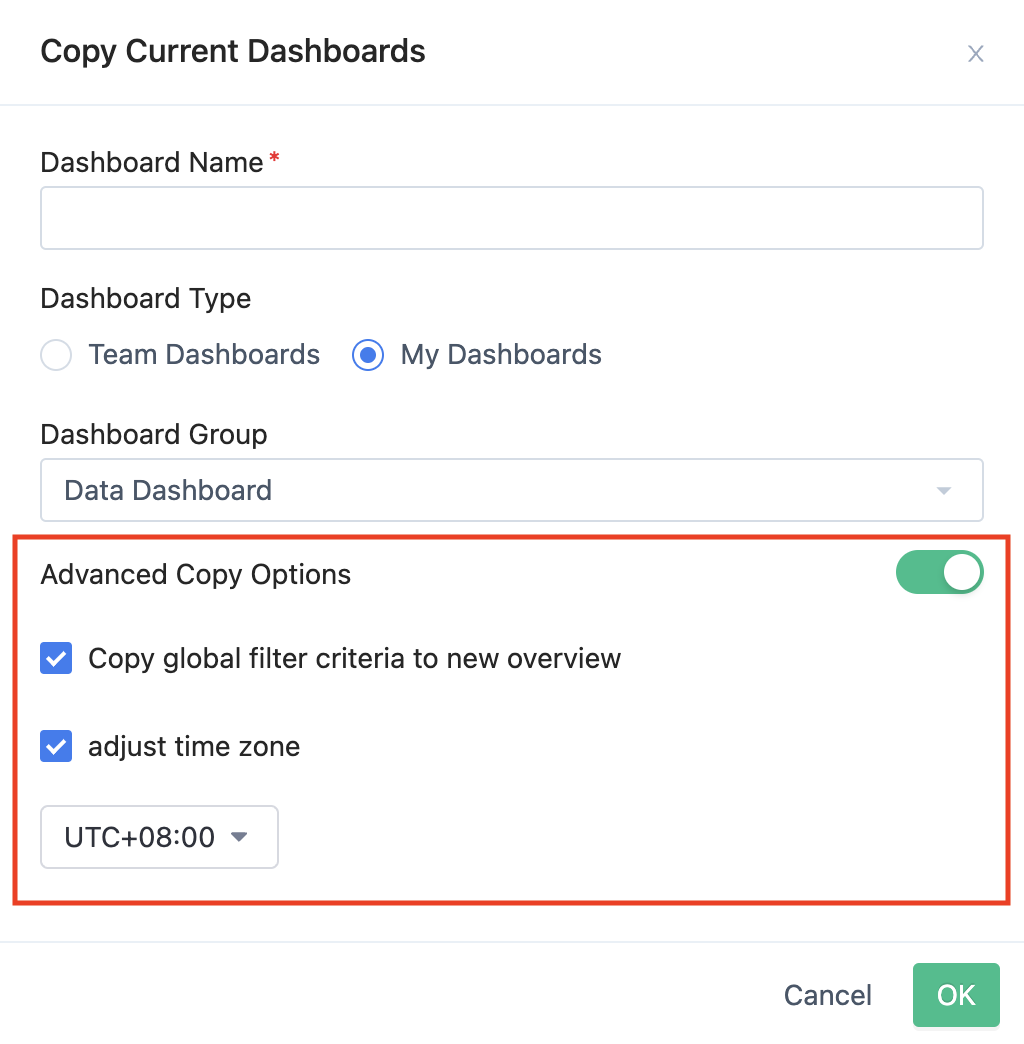
4.10.5. Advanced Copying Options for Dashboards
When copying dashboards, if you need to copy the filters or adjust the time zone caliber of the new dashboards, you can complete the operation in the "Advanced Copy Options". (For project time zone settings, please refer to Multi-timezone Configuration)
4.10.6. Delete Dashboards
When deleting a dashboards, because bookmarks may be added to multiple dashboards for use, the system does not delete the corresponding bookmarks. If it is a shared dashboards, the current members who share the dashboards will be notified after it is deleted.
4.10.7. Export to PDF
Take a screenshot of the content currently displayed in the dashboards and save it as a PDF file. If there is too much table content that needs to be scrolled horizontally or vertically to be viewed, it will be lost when taking a screenshot.
4.11. Add Data Information to the Dashboards: Add from Bookmark, Create Component, Add Description
A. Add from Bookmark
Only bookmarks created by the current user can be added.
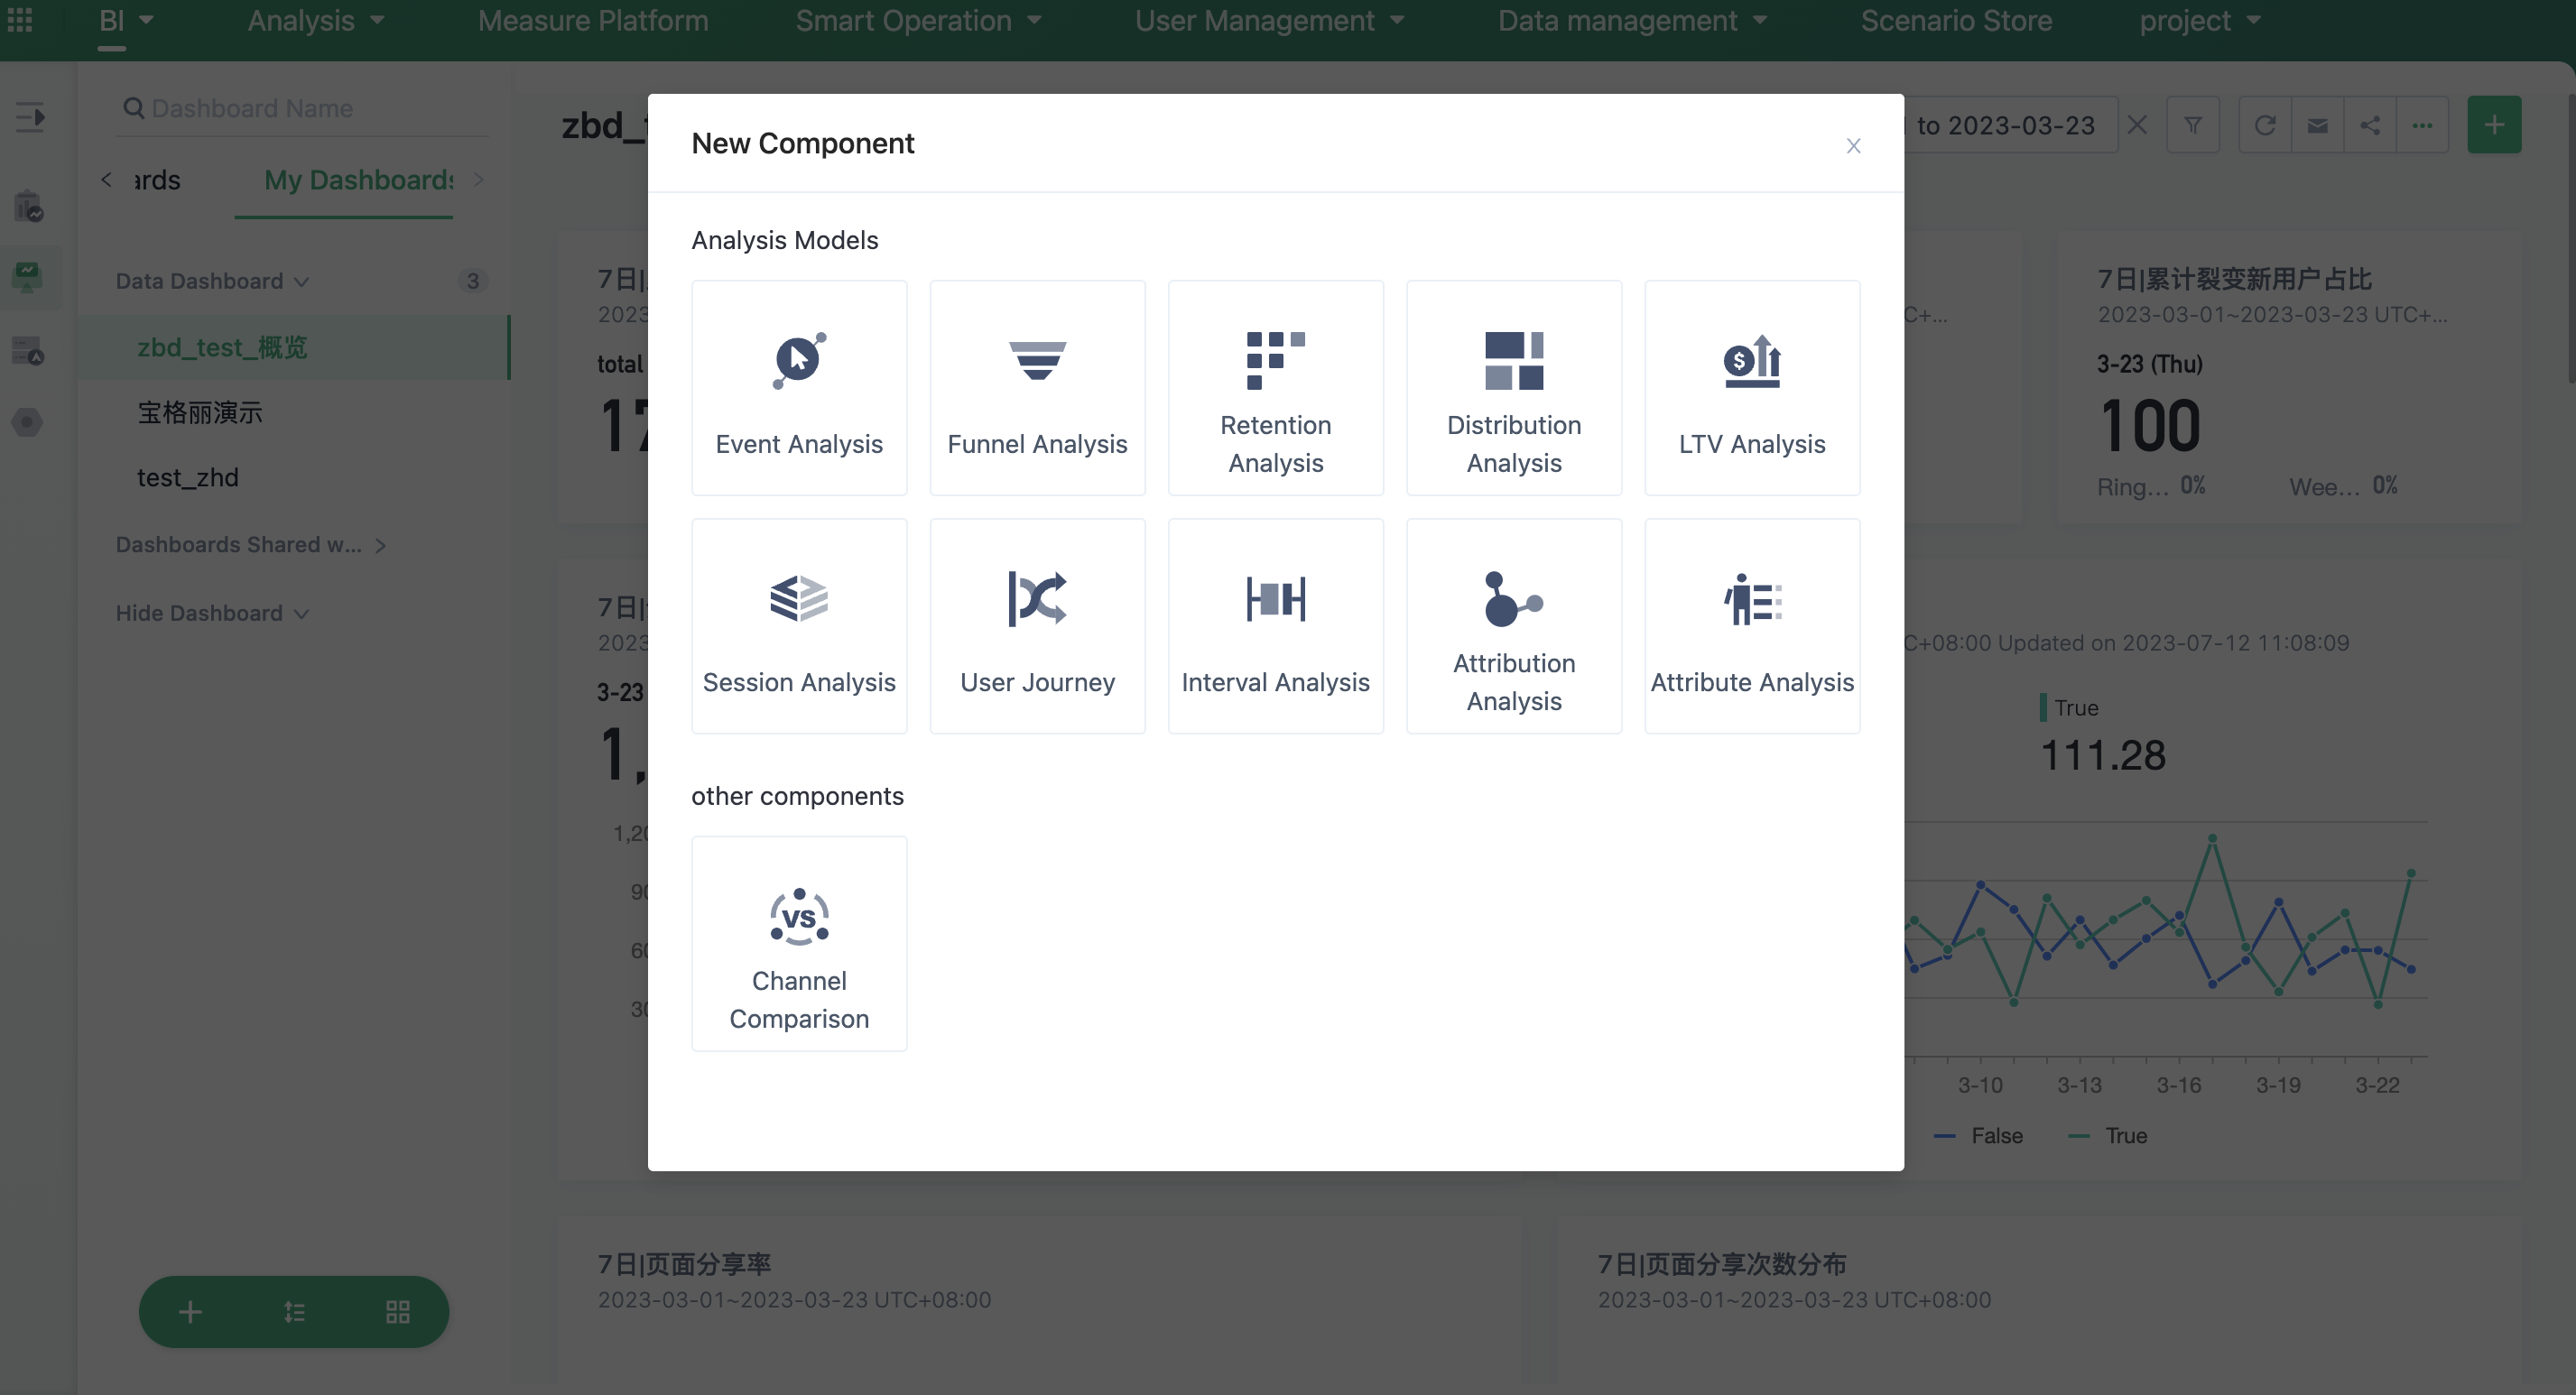
B. New Component
Step 1: Click "New Component" and select the analysis model that you need to use (currently, "User Journey" and "Interval Analysis" are temporarily subscribed to the dashboards in the form of small cards, and we will continue to iterate on related visualization functions).
Step 2: After entering the corresponding analysis model, configure and click "Update"
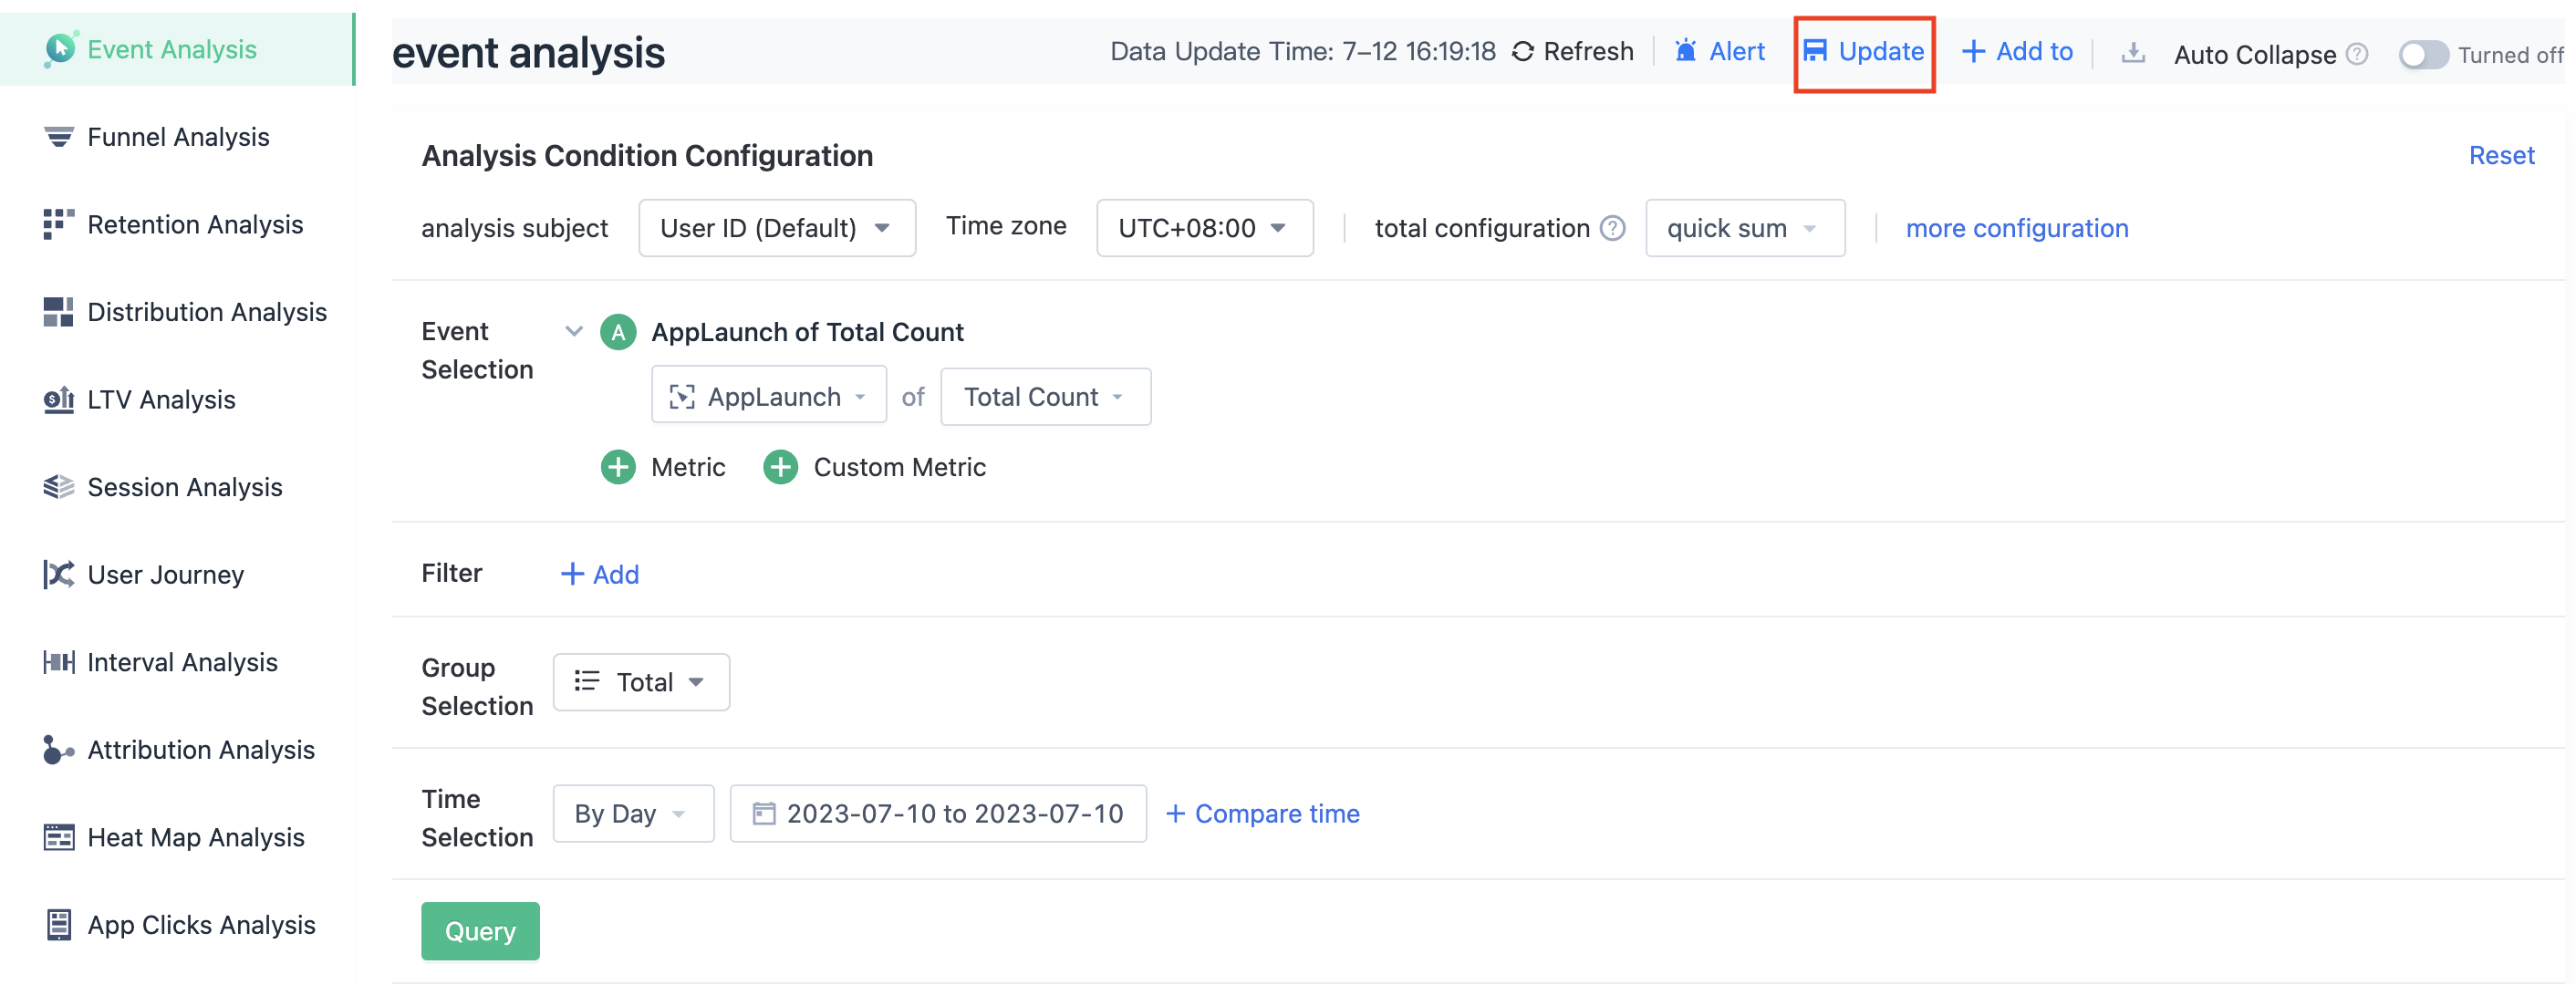
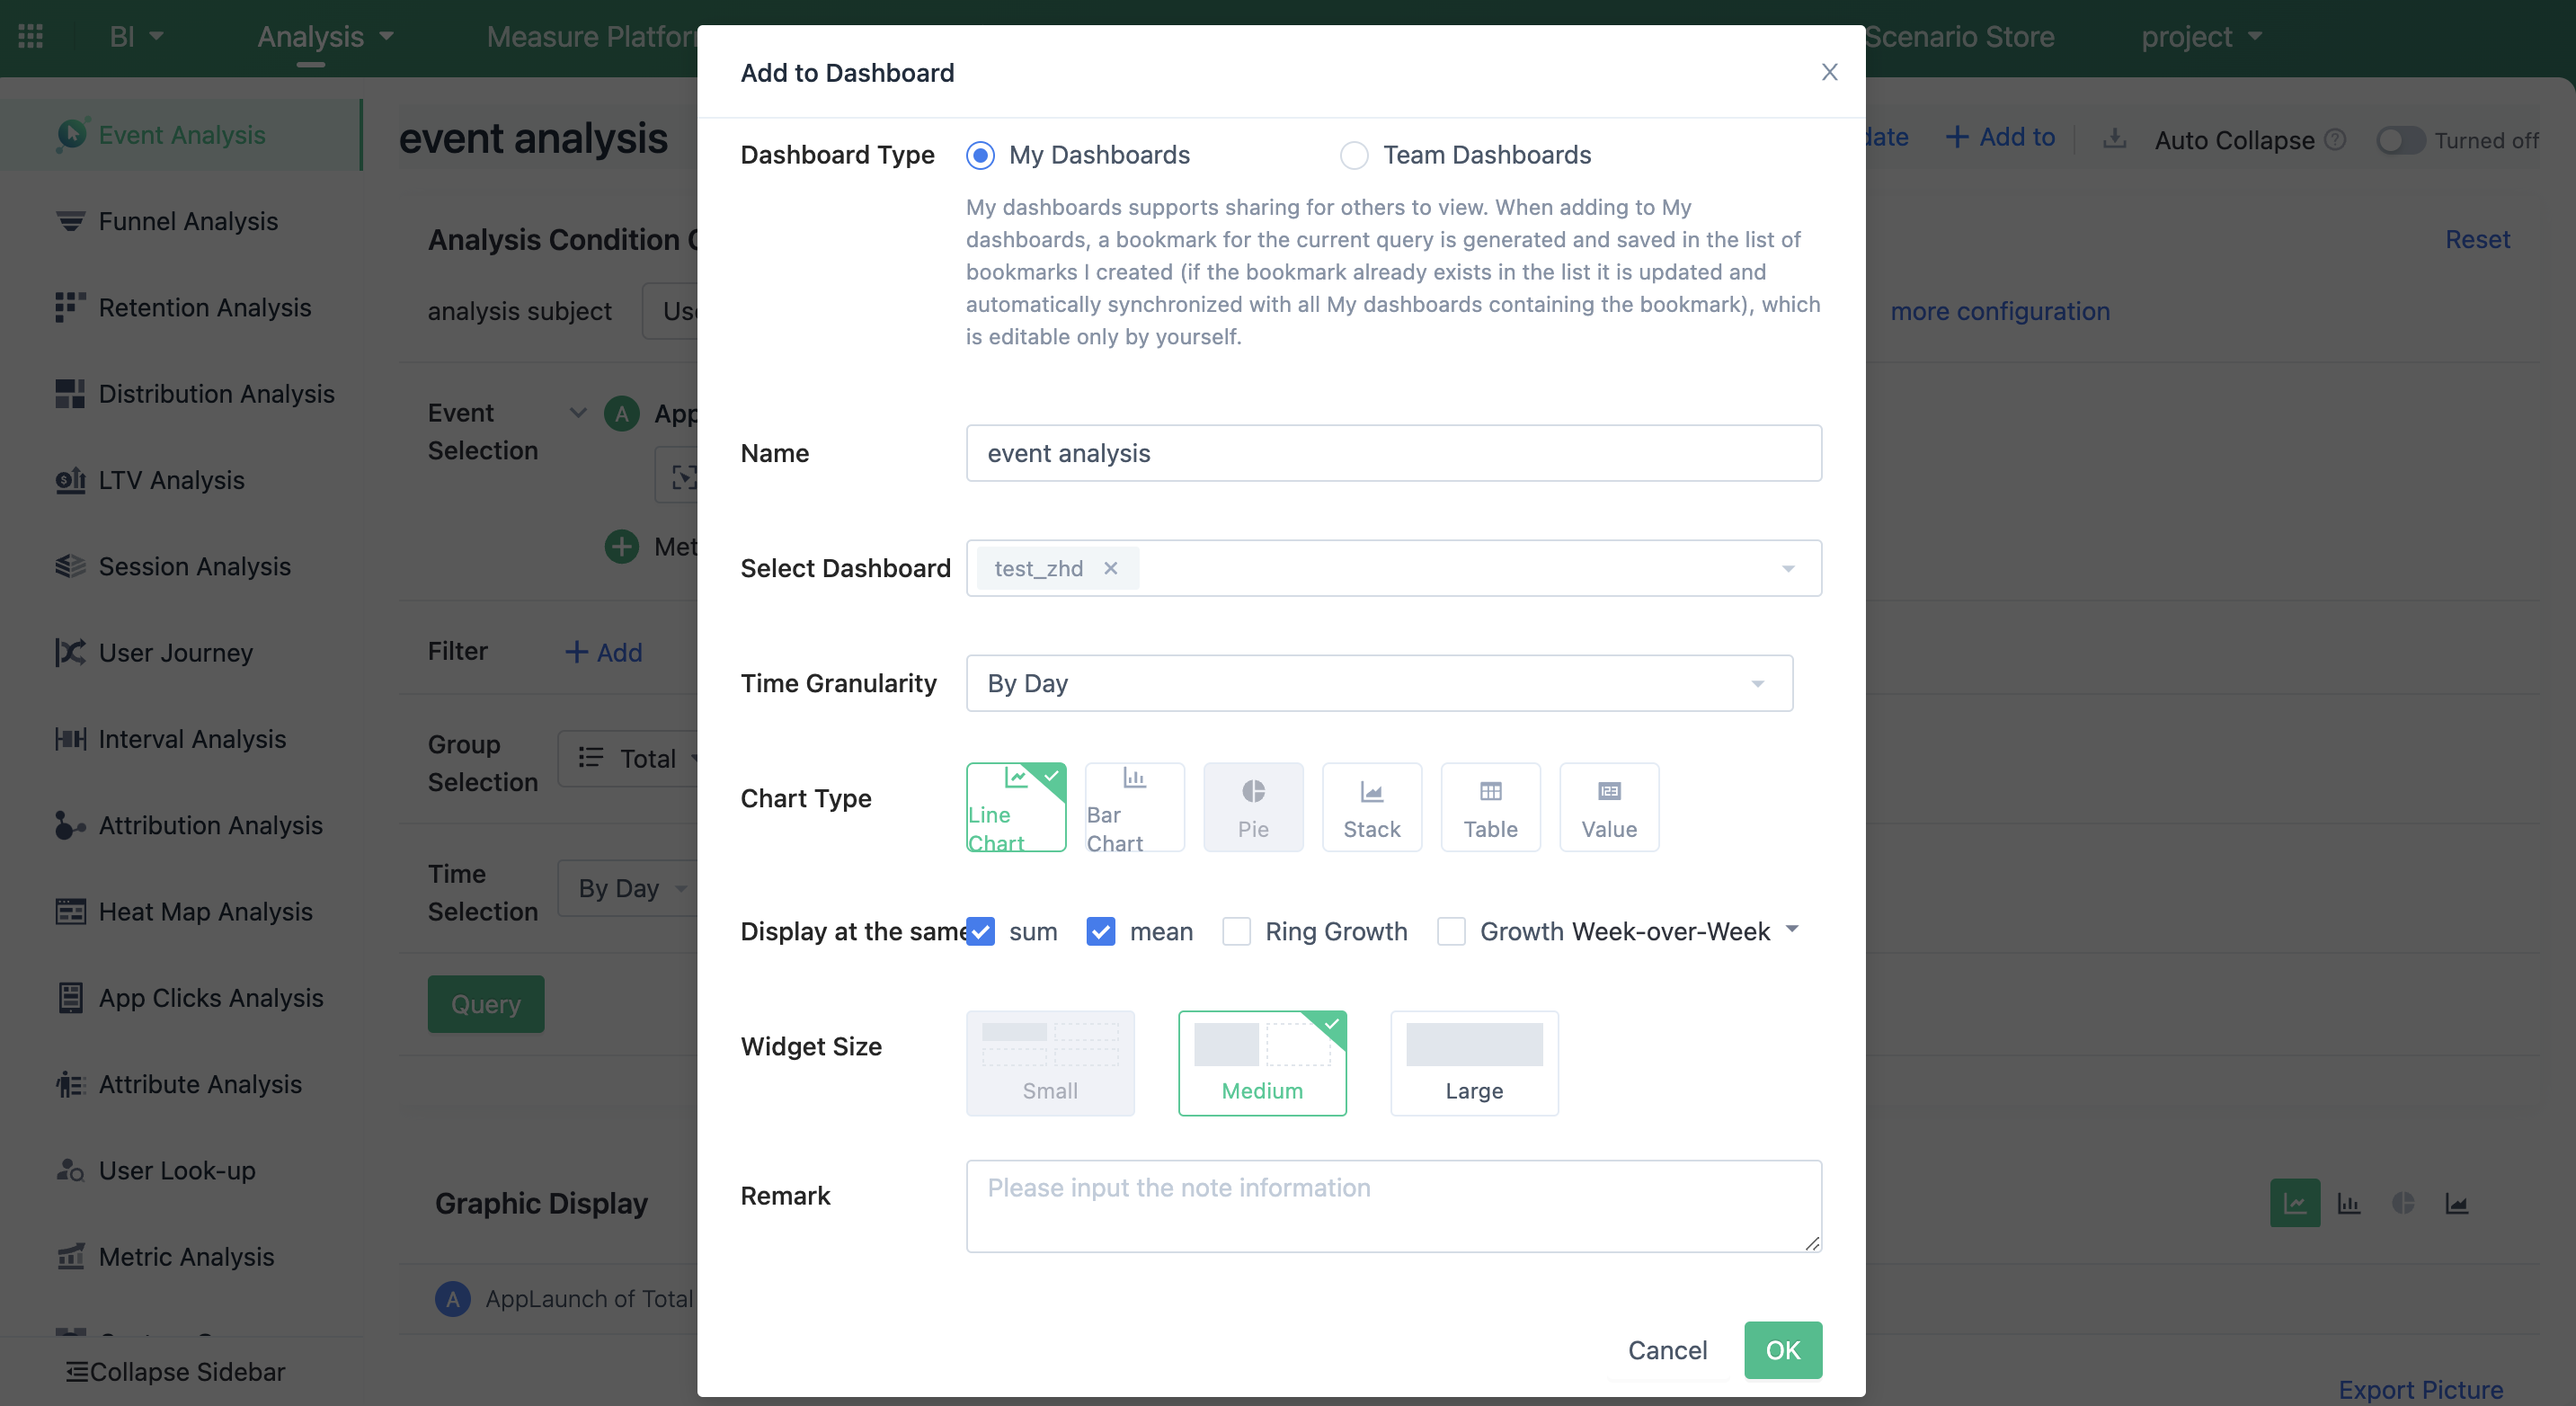
Step 3: Set the visual information, click OK, this analysis content will be successfully added to the dashboards.
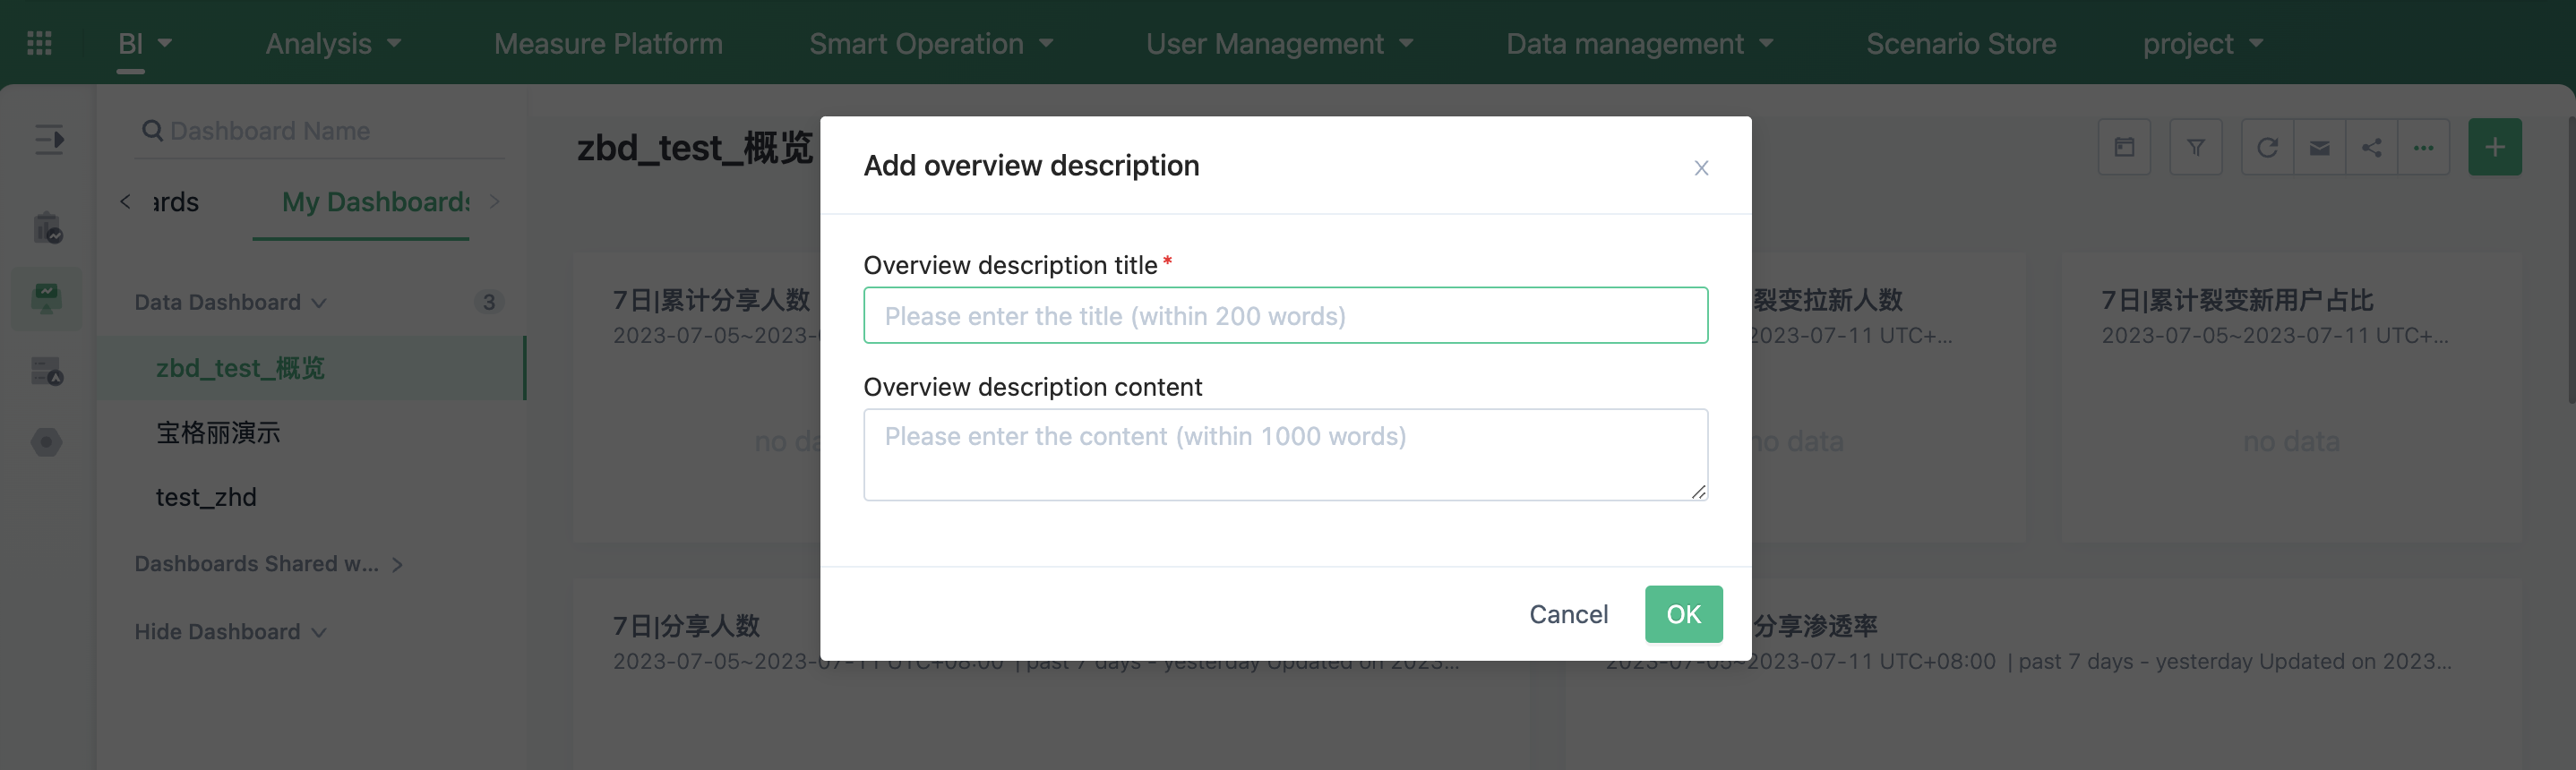
C. Create a description
After clicking "Add Description", fill in the description content in the pop-up window. At least one of the title or details should be filled out to save. Multiple descriptions can be added to a dashboards to explain the current analysis content or to separate analysis sections in the dashboards.
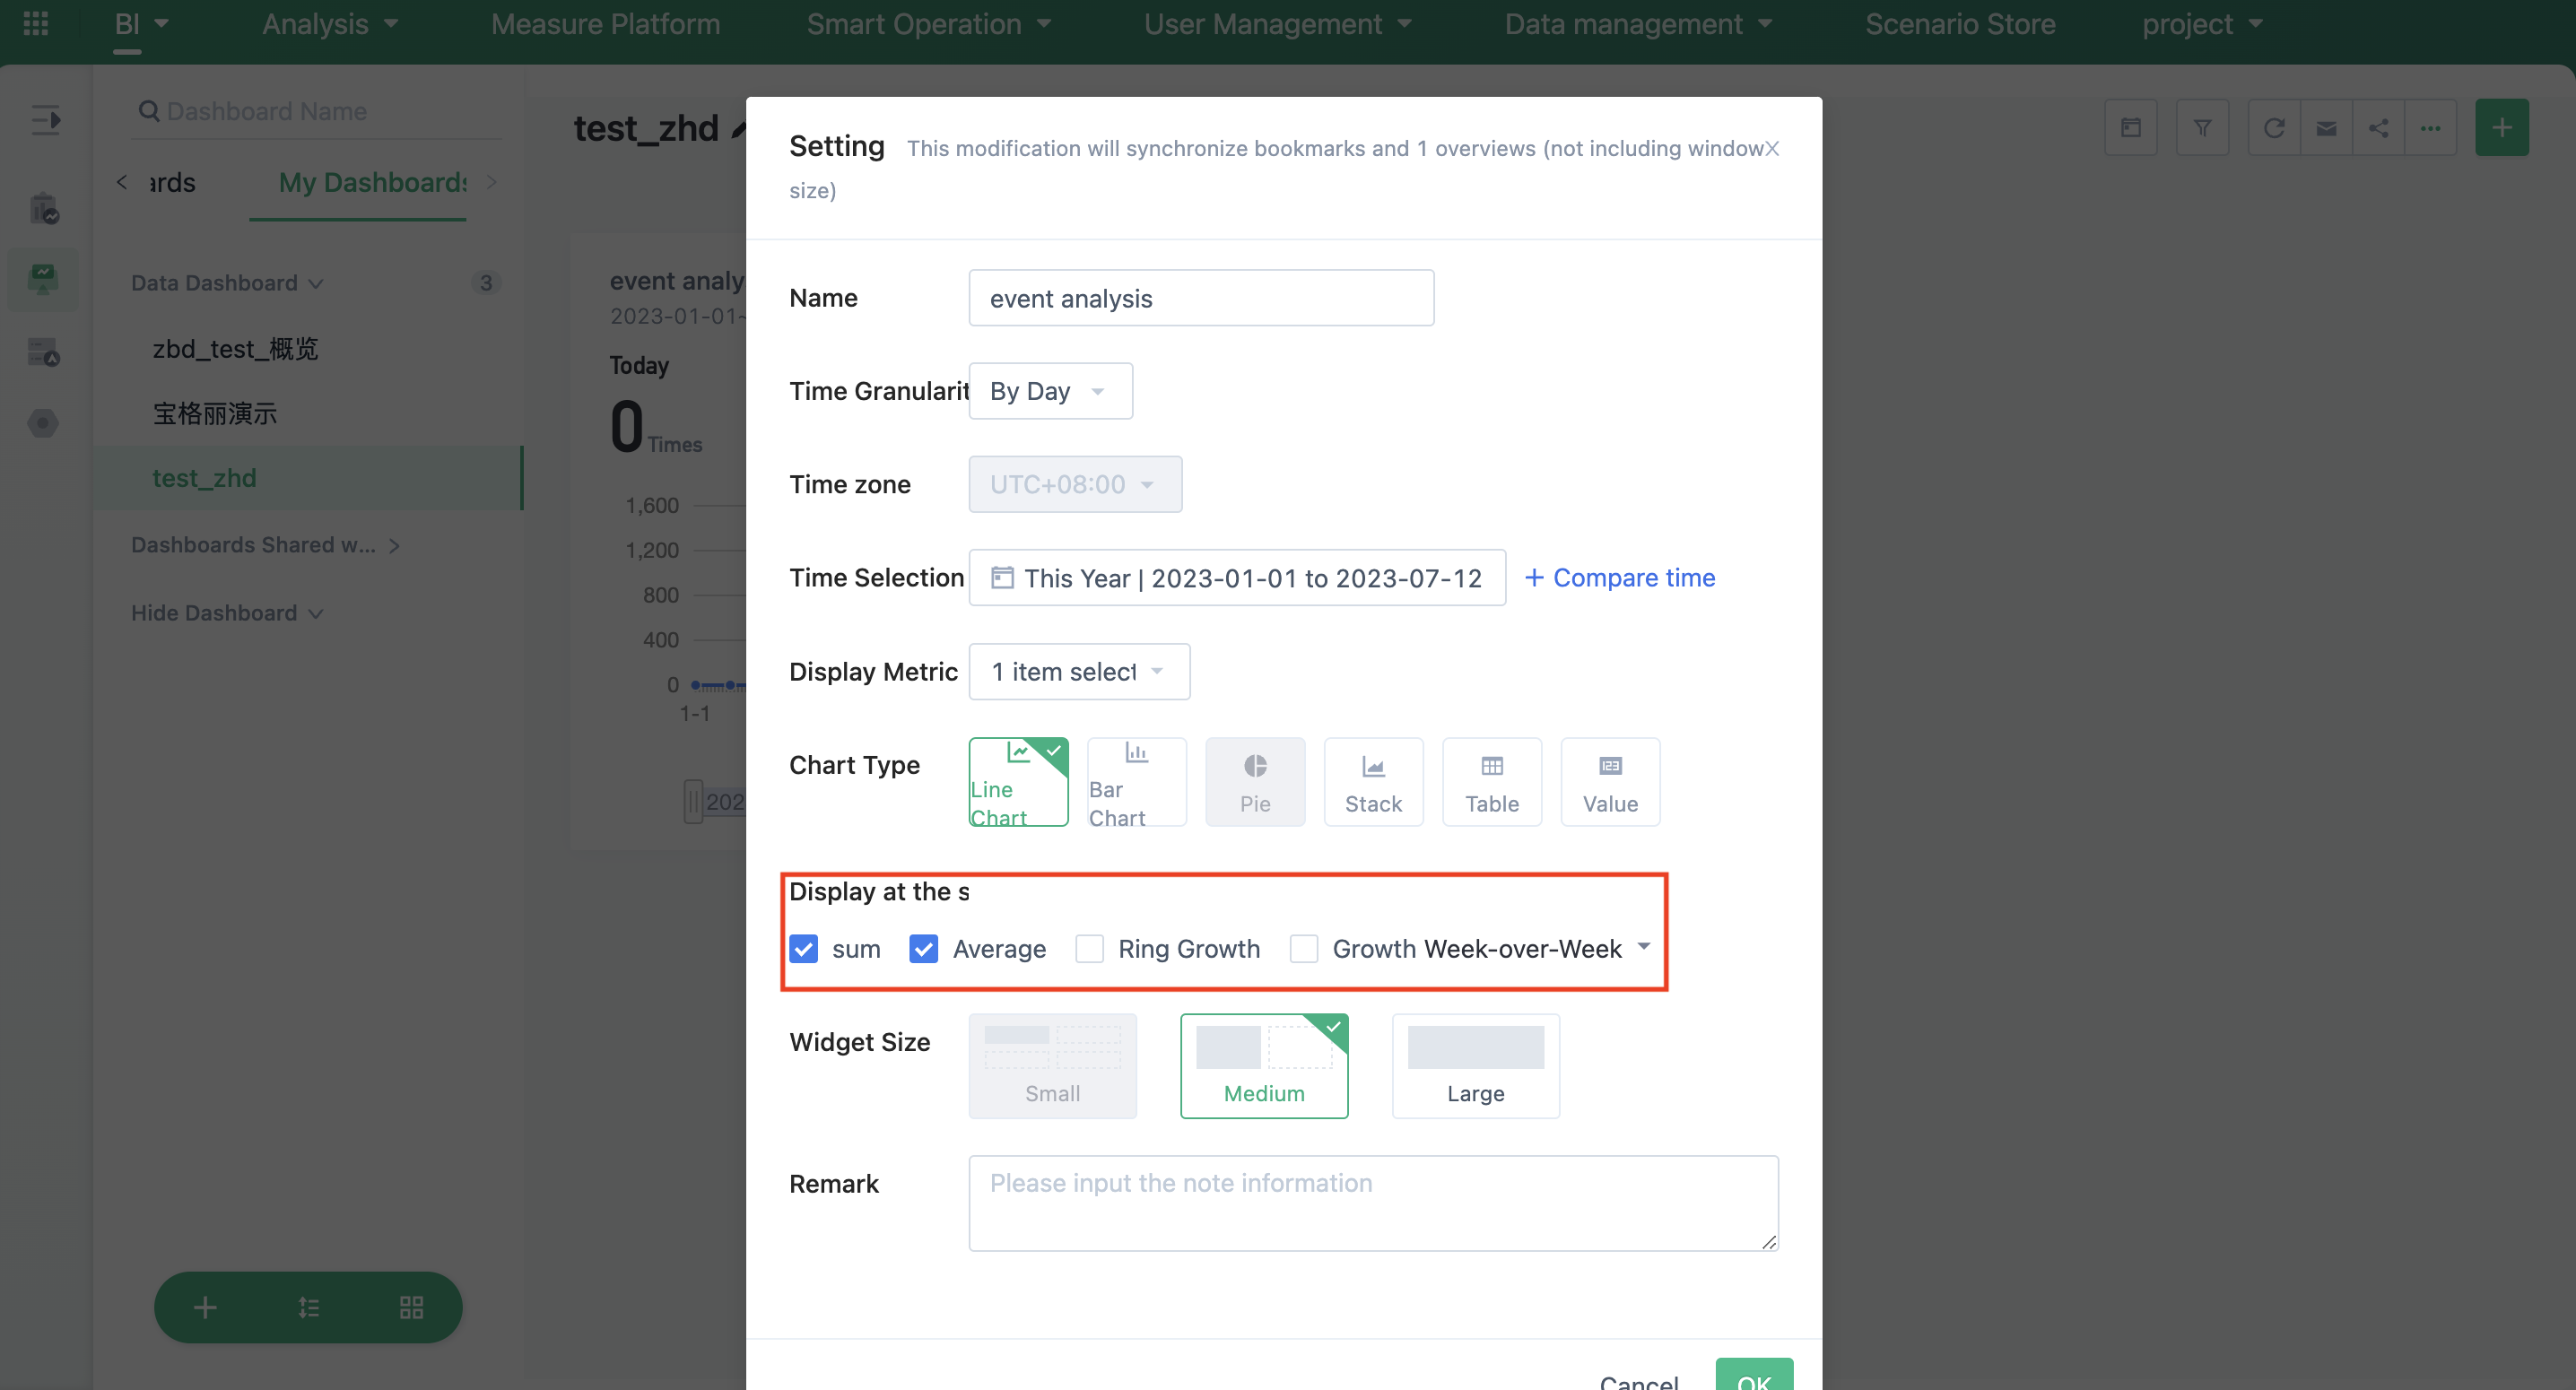
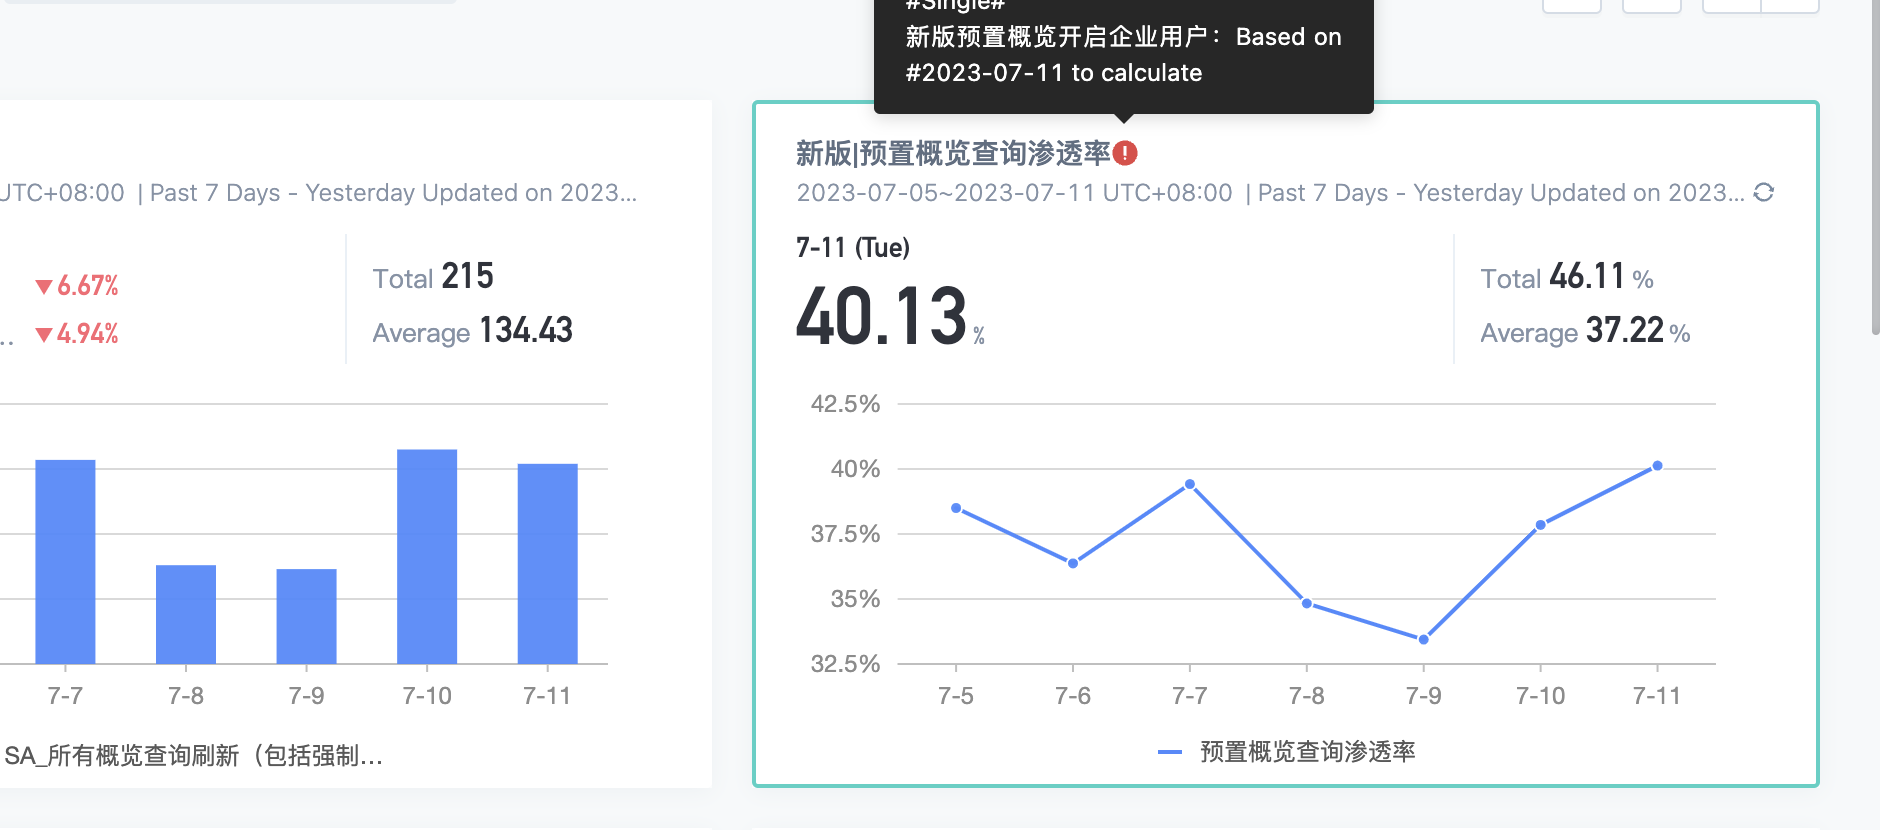
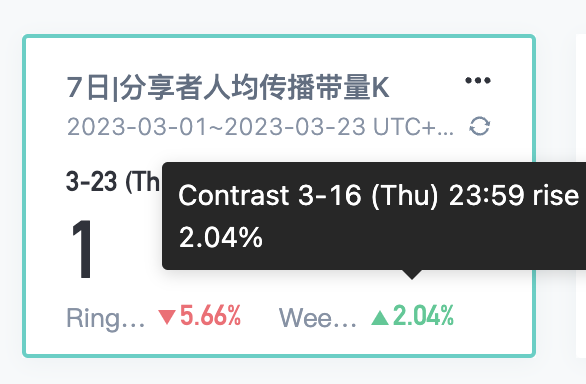
5. Custom Display Information
1. For event analysis with"single indicator without grouping" , when saving to the dashboards, you can customize whether to display the "total", "average", “Ring Growth”and "Growth week-over-week" information.
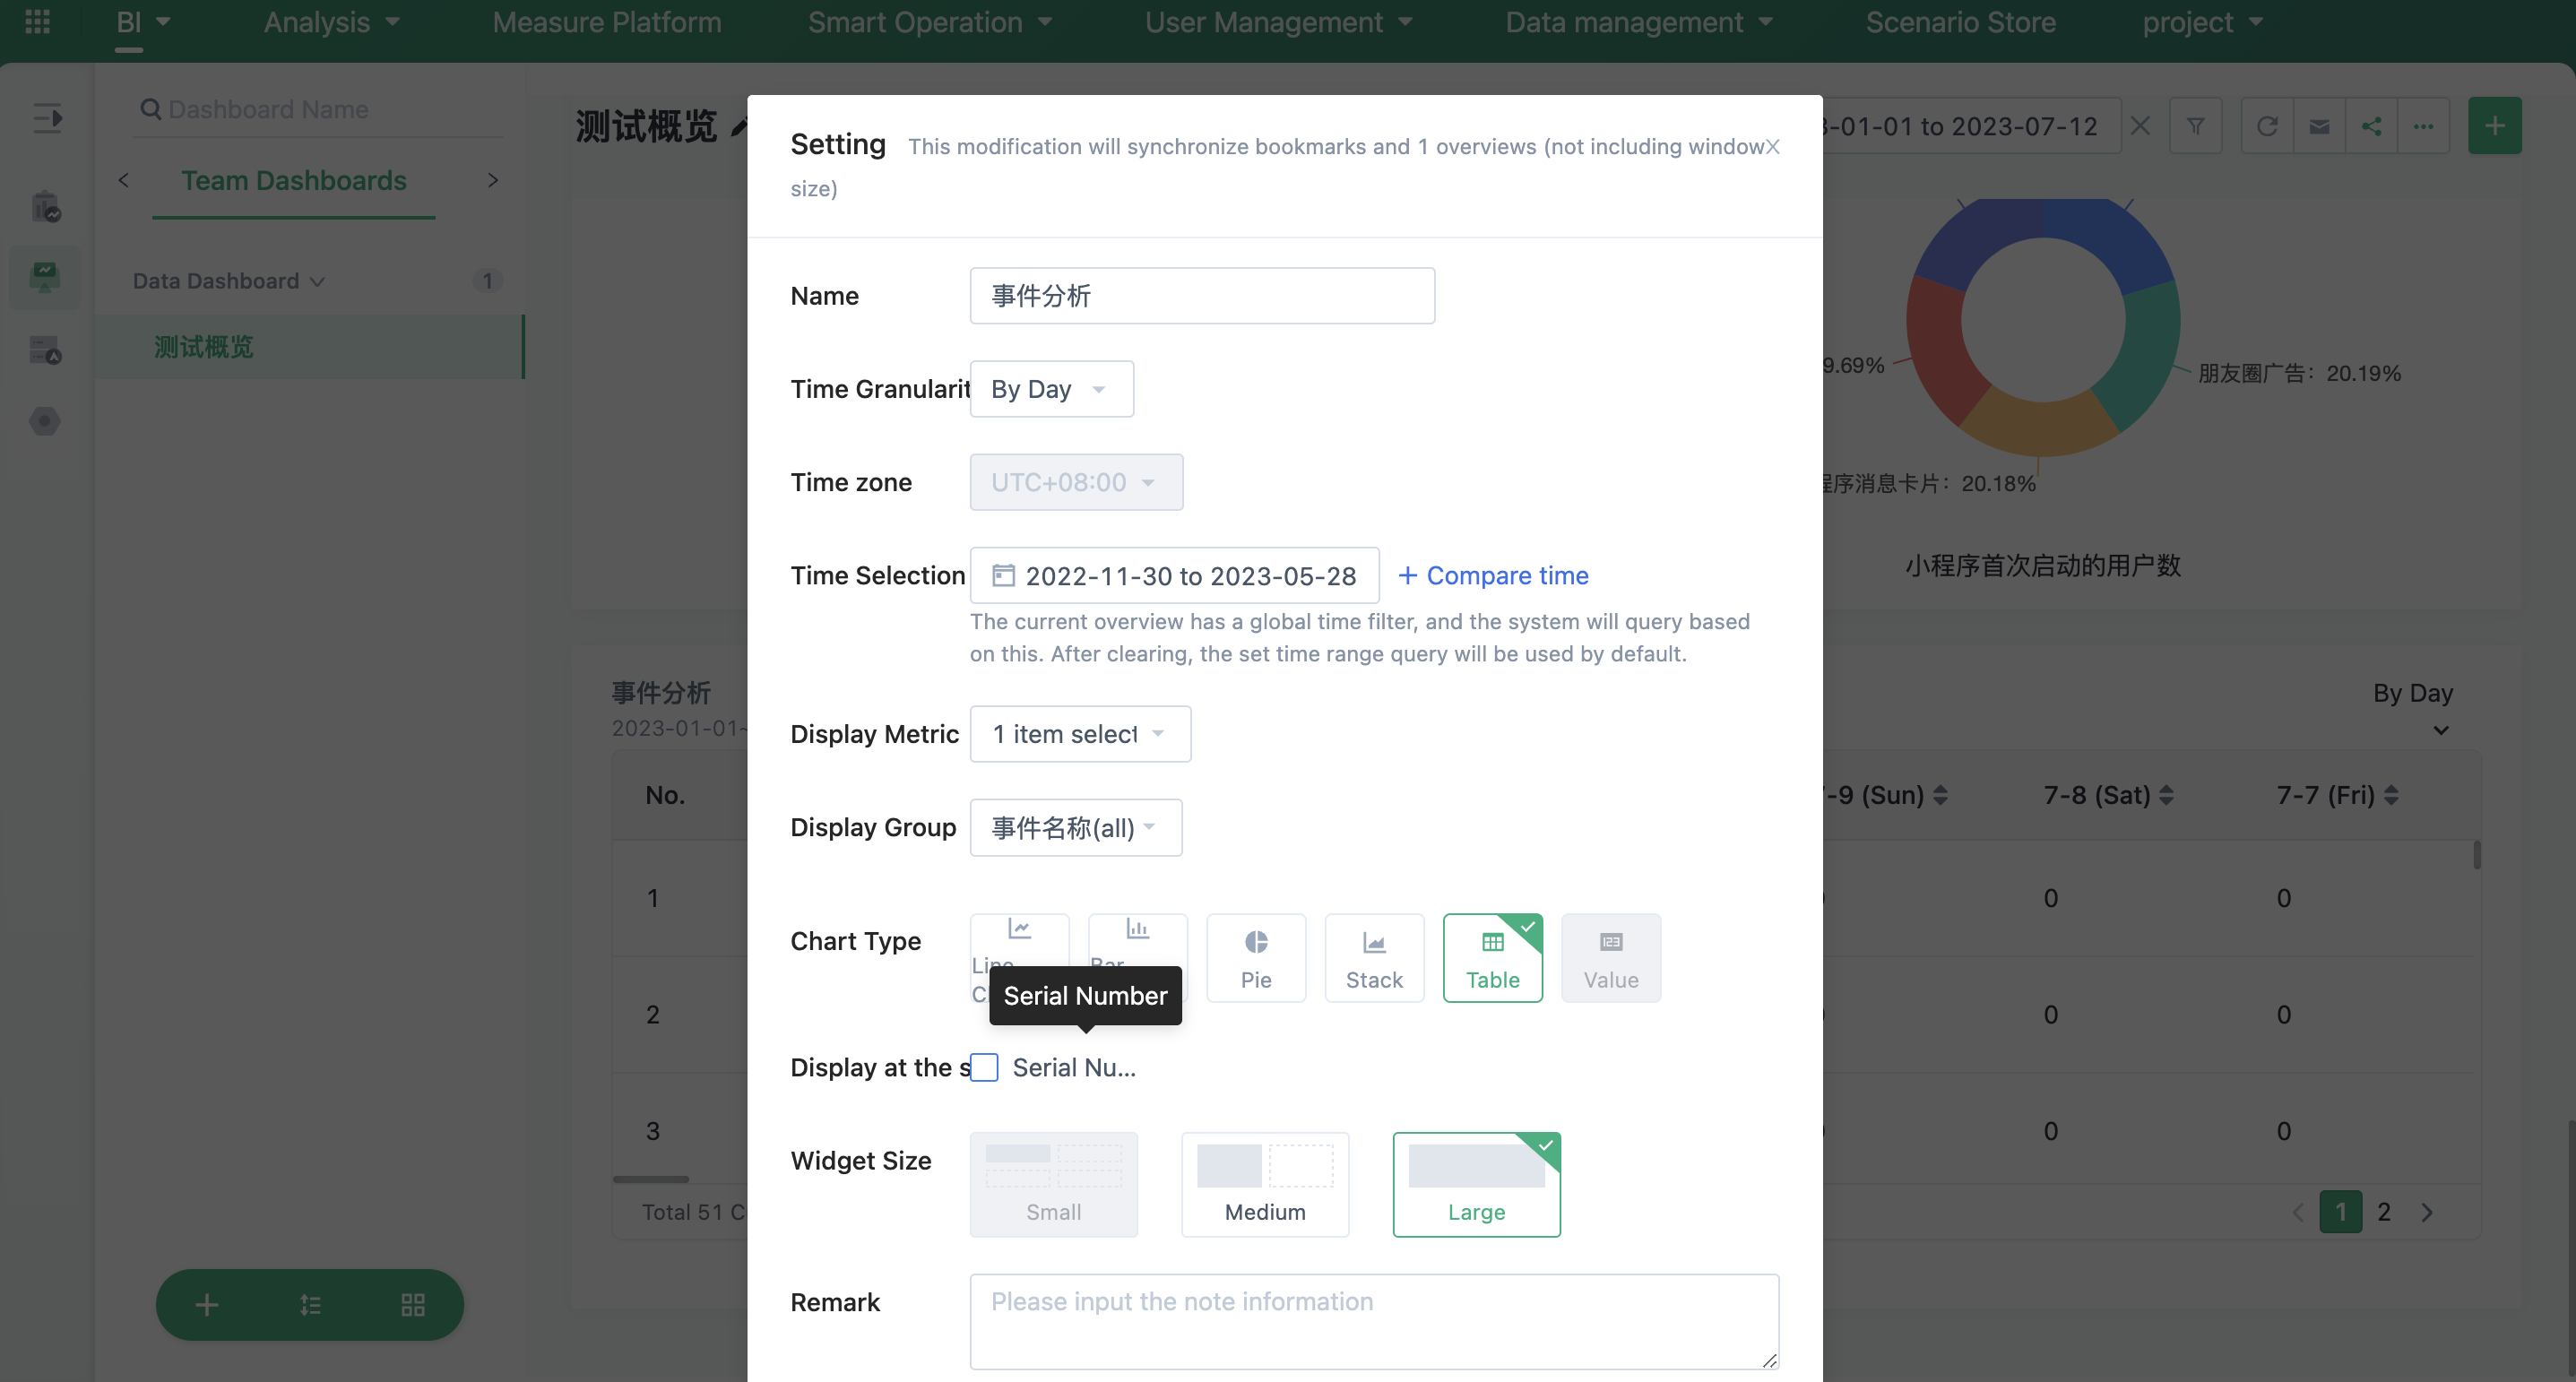
2. In "table" mode, it supports customizing the display of "table serial numbers" to locate the current row information in the current ranking situation.
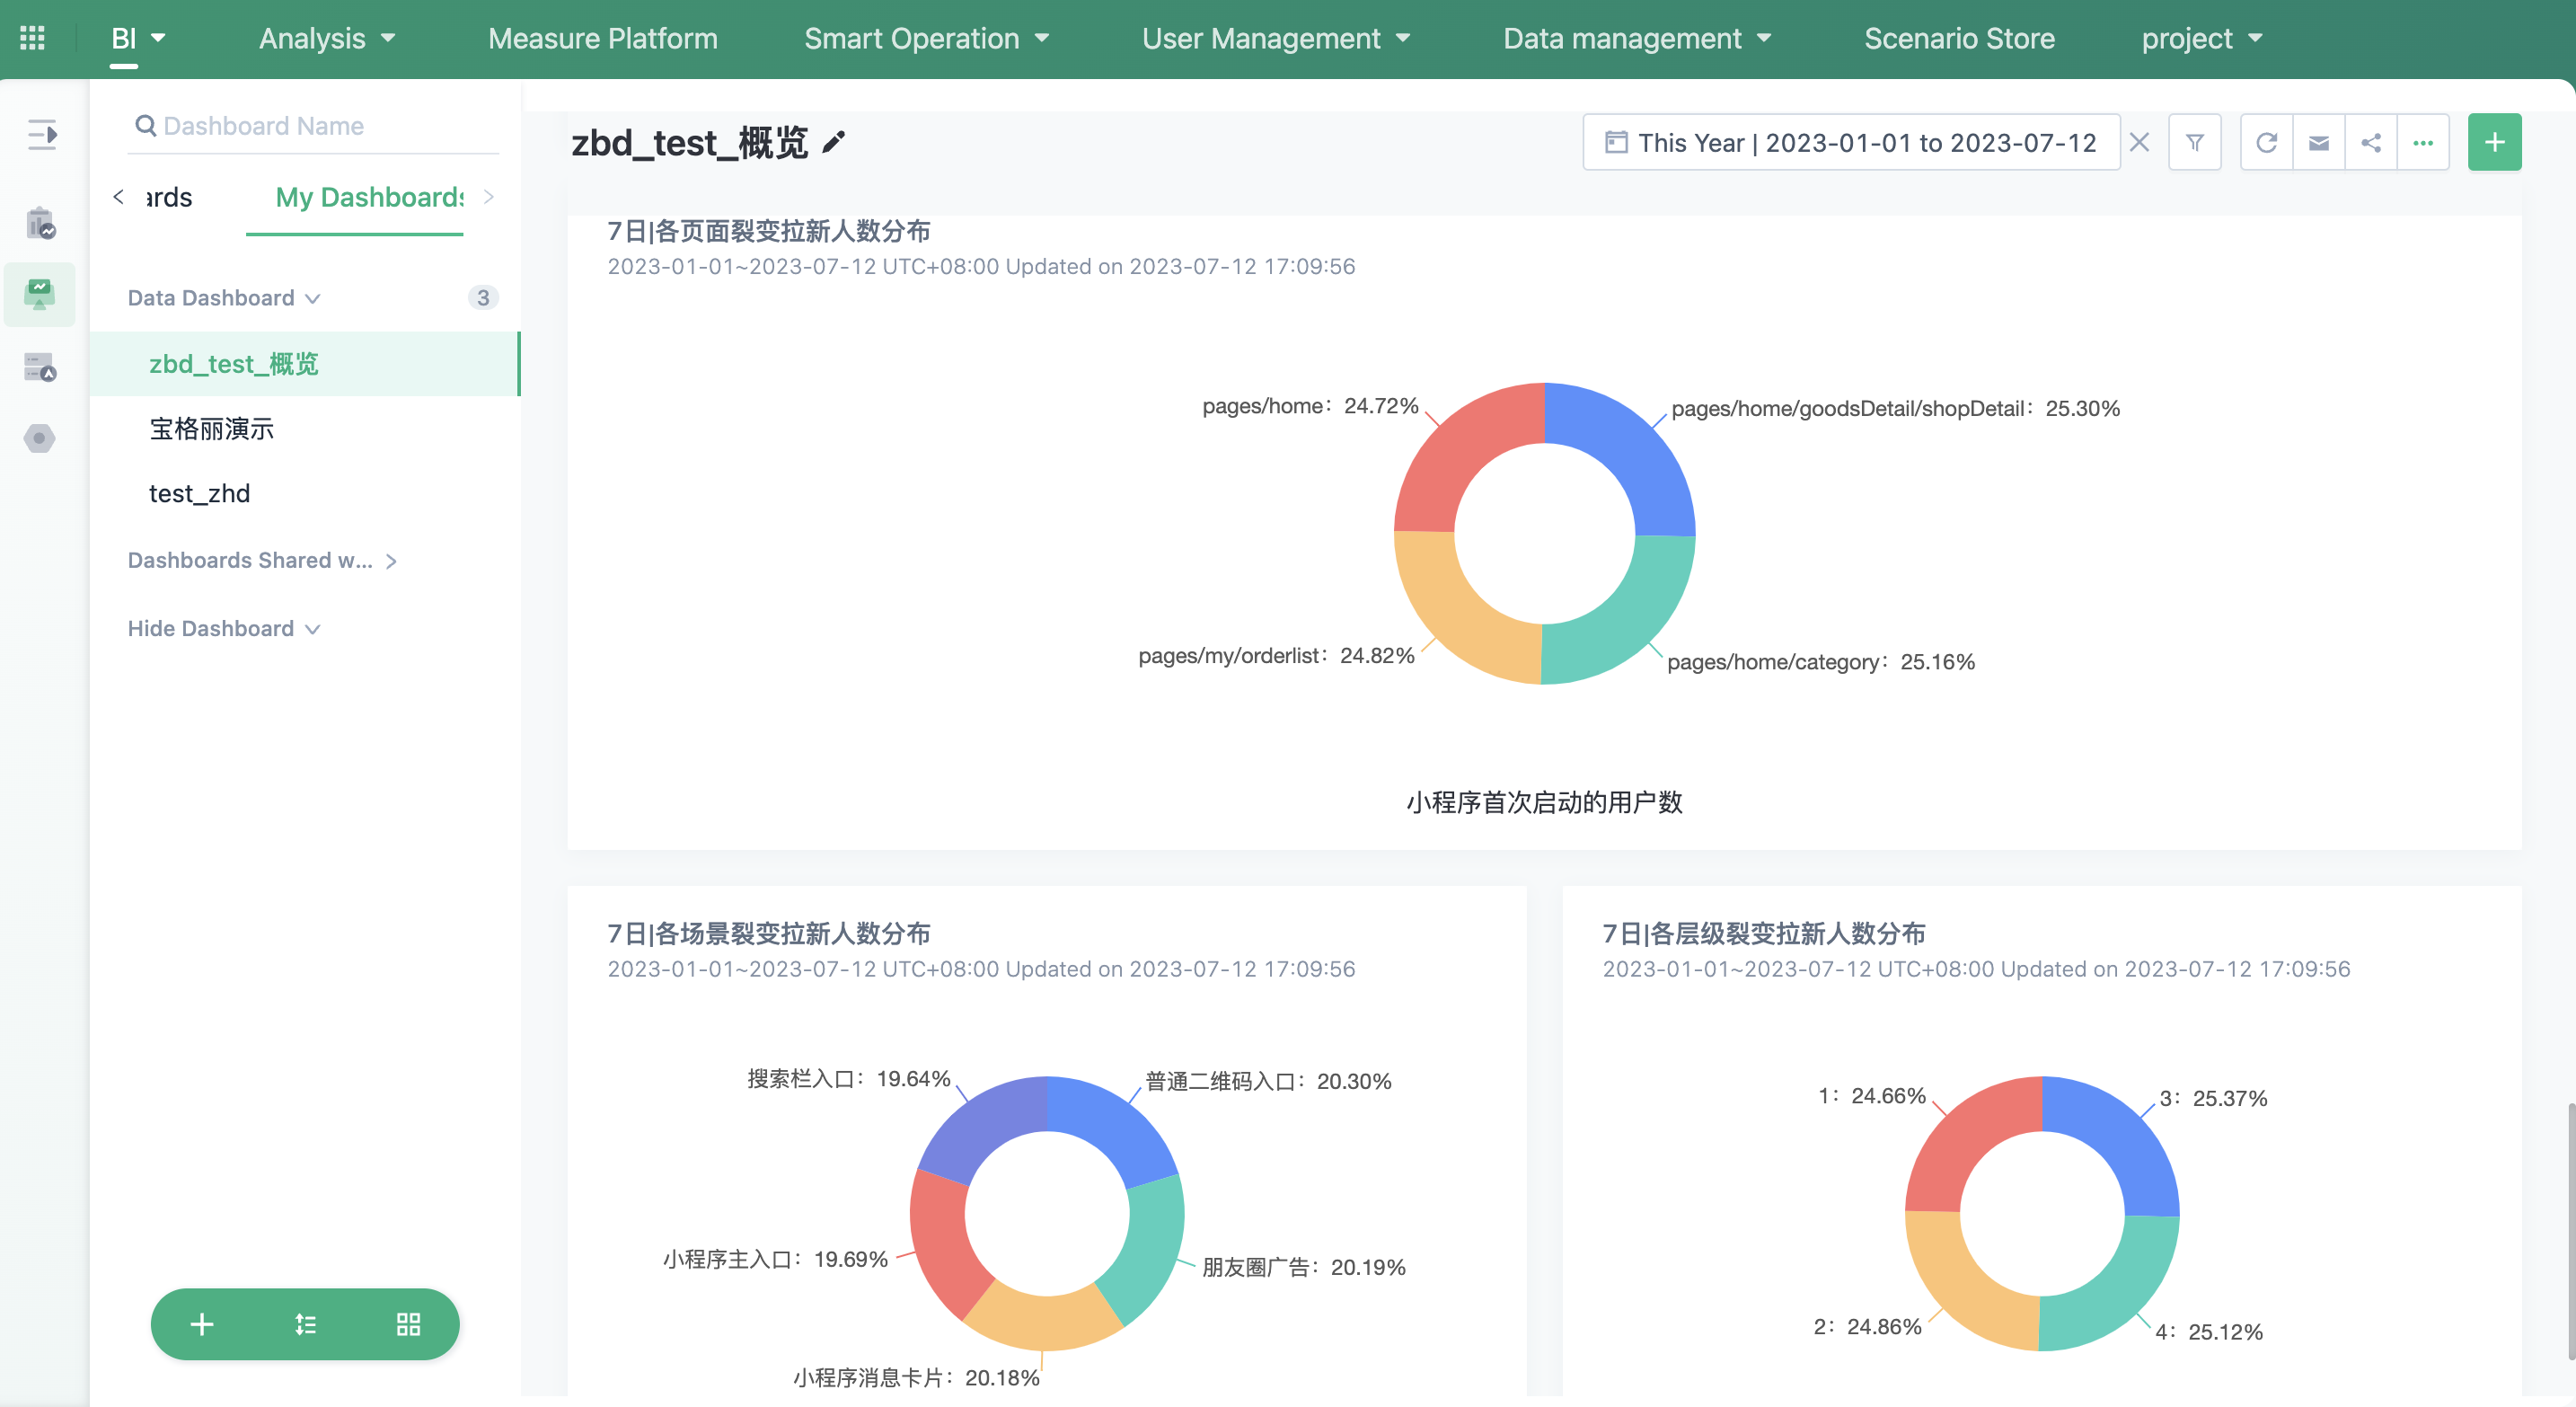
6. Event Analysis-Pie Chart Extension
For "single or multiple indicators with multiple groups" in event analysis, the use of "pie chart" for comparative analysis is supported. Currently, up to 6 indicators can be compared.
7. Segmentation Tips
During the analysis process, we often use user segmentation or user tags (available after purchasing user portrait products) for analysis and calculation. To ensure that users who check the data accurately understand the calculation/calibration of the current data, if the current latest data result (the user data result calculated in the early morning of the current day) is not used for analysis of the "routine" type of "segmentation" or "tag", we will provide a prompt to describe the current situation of the segmentation and tags used in the analysis result.
# Routine # type will be prompted under the following two conditions:
Today's data calculation is not complete: using the xxx-day calculation result, the segmentation calculation result for today has not been completed yet.
Today's data calculation failed: using the xxx-day calculation result, the segmentation calculation result for today failed to calculate.
# Single # type will prompt you which day's data is used in detail.
Note: This prompt function is also available in the analysis model.
8. Growth Ratio Rules
Time Granularity | Ring Growth | Year-over-year(YOY)/MOM/WOW/DOD/HOH | Data Accuracy |
|---|---|---|---|
| By Minute | Compared to Last Minute | Compared to Last Hour: Compared to the same minute of the last hour Compared to Yesterday: Compared to the same minute of yesterday Compared to Last Week: Compared to the same minute of the same hour of the same day of the week last week Compared to Last Month: Compared to the same minute of the same hour of the same day of the month last month Compared to Last Year: Compared to the same minute of the same hour of the same day of the year last year | Accurate to Second |
| By Hour | Compared to Last Hour | Compared to Yesterday: Compared to the same hour of yesterday Compared to Last Week: Compared to the same hour of the same day of the week last week Compared to Last Month: Compared to the same hour of the same day of the month last month Compared to Last Year: Compared to the same hour of the same day of the year last year | Accurate to the Current Minute of the Current Hour |
| By Day | Compared to Yesterday | Compared to Last Week: Compared to the same day of the week last week Compared to Last Month: Compared to the same day of the month last month Compare to Last Year: Compare with the same date last year | Accurate to the current hour of the day |
| By week | Compare to last week | - | Accurate to the current hour of the day of the week |
| By month | Compare to last month | Compare to last year: Compare with the same month last year | Accurate to the current hour of the day of the month |
| By quarter | Compare to last quarter | Compare to last year: Compare with the same quarter last year | Accurate to the current hour of the day of the quarter |
| By year | Compare to last year | Compare to last year: Compare with the same period last year | Accurate to the current hour of the day of the year |
Note: The accuracy of the same ring ratio in the dashboards is different from that in the event analysis, and all the data in the event analysis is queried and complemented according to the time granularity.
For example: It is now October 17, 2022, 12:05 PM. The time range selected is from October 1, 2022, to October 17, 2022. View by month. The month-on-month comparison in the dashboards is the data from October 1 to October 12, 12 noon compared to the data from last month, September 1 to September 17, 12 noon. The year-on-year comparison is the data from October 1 to October 12, 12 noon compared to the data from October 1, 2021, to October 17, 2022, 12 noon. The month-on-month comparison in event analysis is the data from the whole month of October 2022 compared to the whole month of September 2022.
9. FAQ
9.1. How are English number units (Thousand, Million, etc.) converted in the numerical area of the dashboards card?
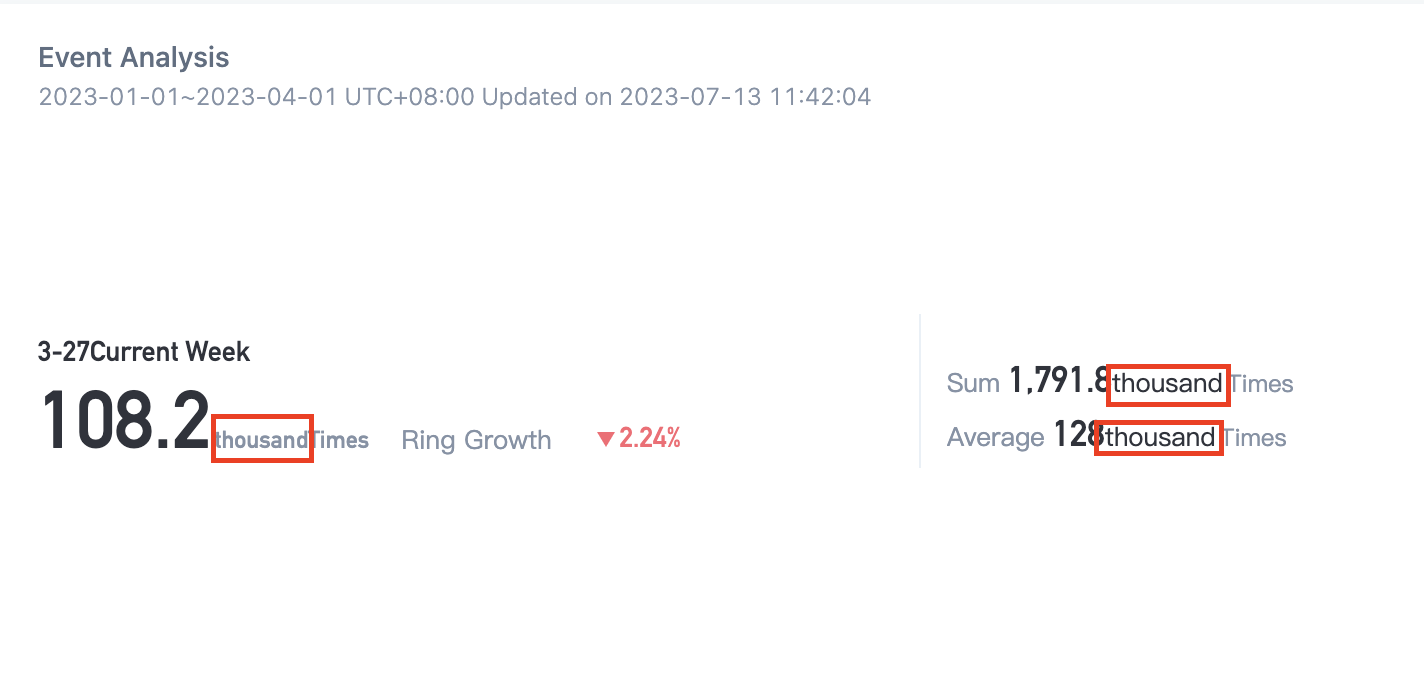
When the absolute value of the number in the numerical area of the dashboards card belongs to the interval [0–100,000), the raw value will be displayed; when it belongs to the interval [100,000–10,000,000), the number unit "thousand" will be displayed; when it belongs to the interval [10,000,000–100,000,000), the number unit "million" will be displayed; when it belongs to the interval [100,000,000–1,000,000,000,000), the number unit "billion" will be displayed; and when it is greater than or equal to 1,000,000,000,000, the number unit "trillion" will be displayed. At the same time, up to two decimals will be retained in the conversion. If the second decimal place after rounding is 0, it will be truncated. For example, 111.10 thousand will be displayed as 111.1 thousand.
Note: The content of this document is a technical document that provides details on how to use the Sensors product and does not include sales terms; the specific content of enterprise procurement products and technical services shall be subject to the commercial procurement contract.
 Popular Searches