Debug Mode Dynamic Configuration
|
Collect
1. Overview
In the new version of the Sensors Analytics Android SDK (v3.0.4+) and iOS SDK (v1.10.23+), the debug mode is preset to be turned off. If manually enabled, it will be reset to off after the app process is closed.
In Sensors Analytics, you can enable the "Debug Mode" for a device by scanning the web page QR code.
2. How to enable Debug Mode?
Before using this feature, please ensure that the Scheme is configured in your app. Refer to the following documentation:
- Android: Integration Documentation
- iOS: Integration Documentation
2.1. Step 1: Open the Debug Mode QR Code
Open the "Set Device Debug Mode" QR code in Sensors Analytics.
QR code location: "Sensors Analytics" - "Data Center" - "Data Access" - "Debug Real-time Data Query" - "Set Device Debug Mode"
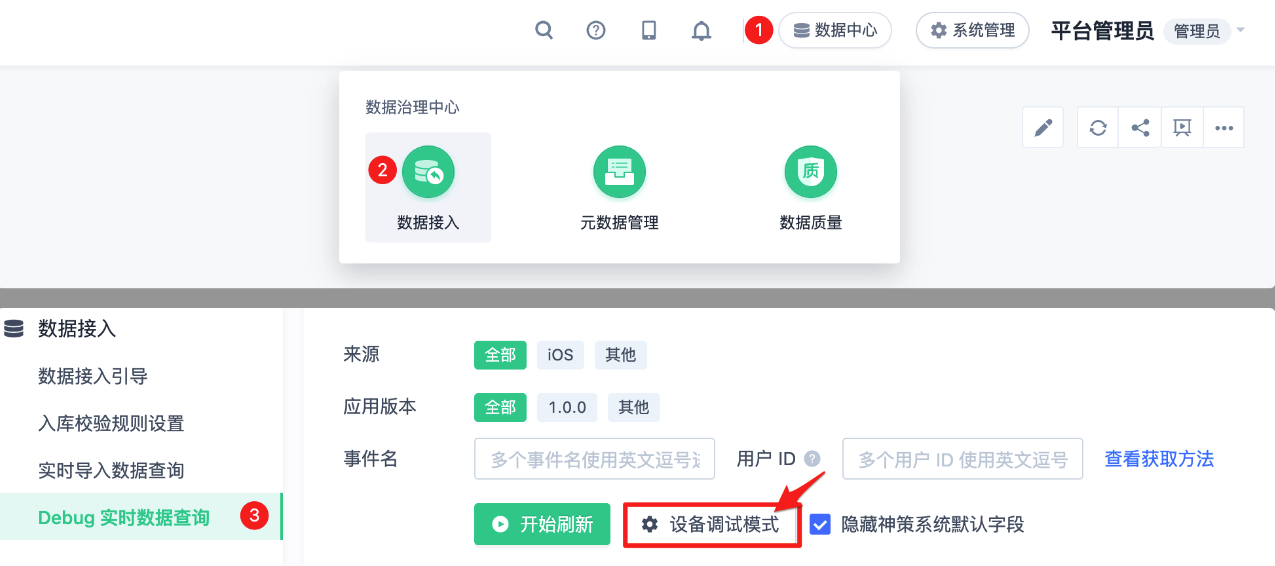
2.2. Step 2: Scan the QR Code/Pairing Code to Connect
Prerequisite: The phone is required to have the corresponding app installed and the SDK integrated correctly.
Prerequisite: Your phone needs to have the corresponding app installed and the SDK integrated correctly.
Click on "Set Device Debug Mode" and use the device that needs to enable the debug mode to scan the QR code with a scanning tool. Open the QR code URL in a browser.
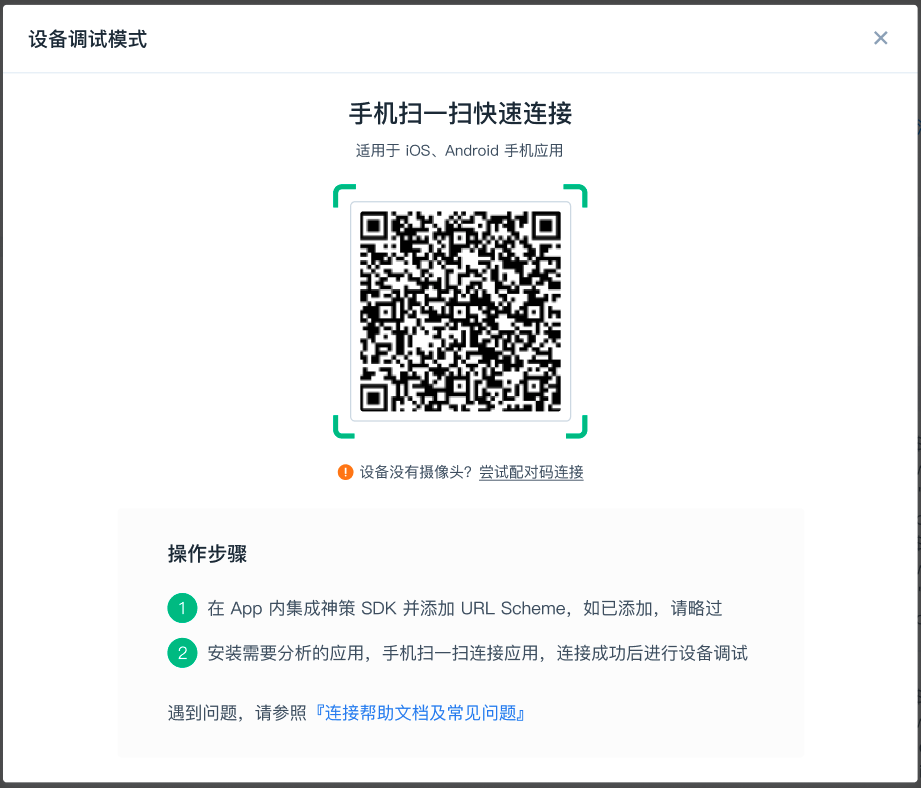
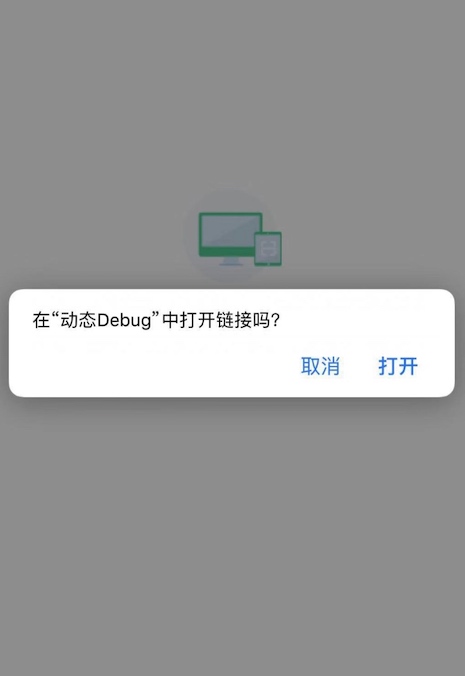
If the app has successfully integrated the SDK, it will directly trigger the app or prompt whether to trigger the app.
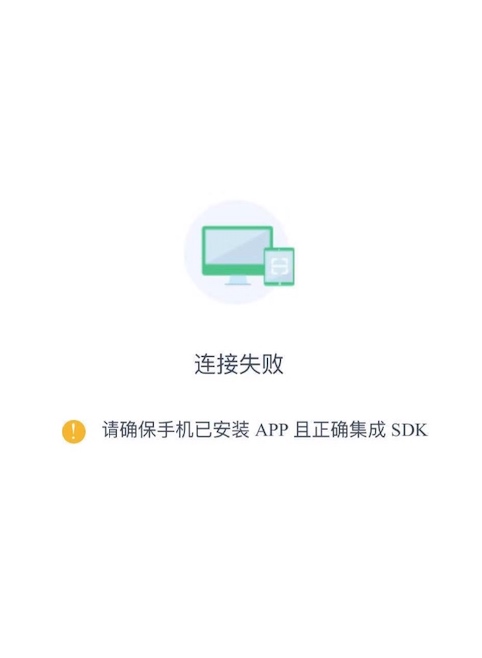
If there are any issues with the App integration SDK or the App is not installed, the following error page will be displayed. Please check your App configuration.
Prerequisites: Required to have the corresponding App and 『Sensors Analytics SDK Assistant』 installed on the device, and correctly integrated the SDK
Click "Set Device Debug Mode" and then "Try Pairing Code Connection" to switch to pairing code connection mode. Open the Sensors Analytics SDK Assistant, click the app name, and then click "Enable Pairing Code Connection". Launch the target app and enter the pairing code in the target app to pair successfully.

2.3. Step 3: Select Debug Mode
After successful connection, a popup will appear in the App.
In the popup, select the desired debug mode.
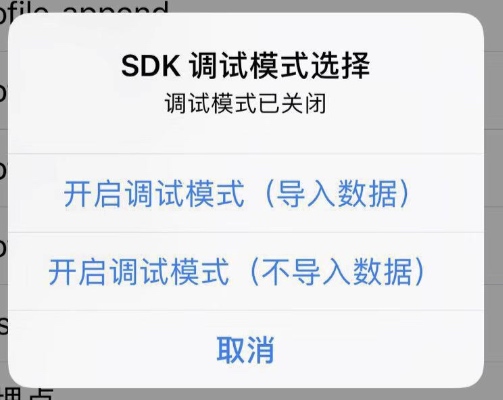
Debug Mode (Data Import): Open the debug mode, verify the data, and import the data into Sensors Analytics
Debug Mode (No Data Import): Open the debug mode, verify the data, but do not import the data into Sensors Analytics
2.4. Step 4: Obtain the device id for enabling debug mode
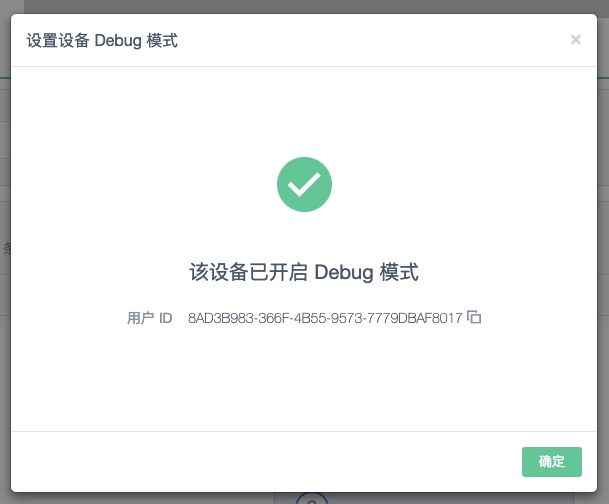
After selecting the debug mode, you can receive your device id in Sensors Analytics.
Click Copy: Click the Copy button to copy the device id to the clipboard.
Click Confirm: Directly fill in the device id in the "Debug Data" user ID input box.
2.5. Step 5: Use the device id to perform import query
Click "Start Refresh" to synchronize the data reported by the device in debug mode in real-time.
The data will be displayed in JSON format to facilitate viewing.

3. How to exit debug mode?
When the App exits the background process or is closed by a tool, the SDK will automatically close the debug mode.
4. FAQ
4.1. The QR Code/Pairing Code has expired.
A: Please refresh the QR Code/Pairing Code after it has expired.
4.2. After waking up the App, the App prompts for inconsistent projects, etc.
A: The App you are trying to connect is inconsistent with the scheme of the Sensors Analytics project. Please check the scheme of the current project.
4.3. Which applications are suitable for pairing code connection?
A: Pairing codes are only suitable for Android applications and do not currently support iOS applications.
4.4. How long is the validity period of the scanned QR code for connection?
A: The validity period is 20 minutes. After it expires, you need to refresh it again.
Note: The content of this document is a technical document that provides details on how to use the Sensors product and does not include sales terms; the specific content of enterprise procurement products and technical services shall be subject to the commercial procurement contract.
 Popular Searches