Interval Analysis
|
Collect
Video explanation
Video explanation of interval analysis
Overview of Interval Analysis
In version 1.11 and later, Sensors Analytics provides "interval analysis".
Daily work of product, operation, and marketing personnel requires monitoring the conversion of certain businesses. In addition to the conversion rate using the funnel, measuring the distribution of conversion duration also requires interval analysis. Interval analysis is to solve such problems and needs. By calculating the time interval of two events in the user behavior sequence, the transformation time distribution of the service transformation link is obtained.
Interval analysis helps you answer the following questions:
For registration processes that include complex operations such as real-name authentication, we want to determine the duration distribution from the beginning of registration to the end of registration.
For e-commerce products, we want to analyze the duration distribution from the time users first open the app or complete registration to the first completed order.
For investment and wealth management products, we want to analyze the time interval distribution between new users completing card binding and completing their first investments.
View interval analysis function application examples.
Intro to the Interval Analysis Function
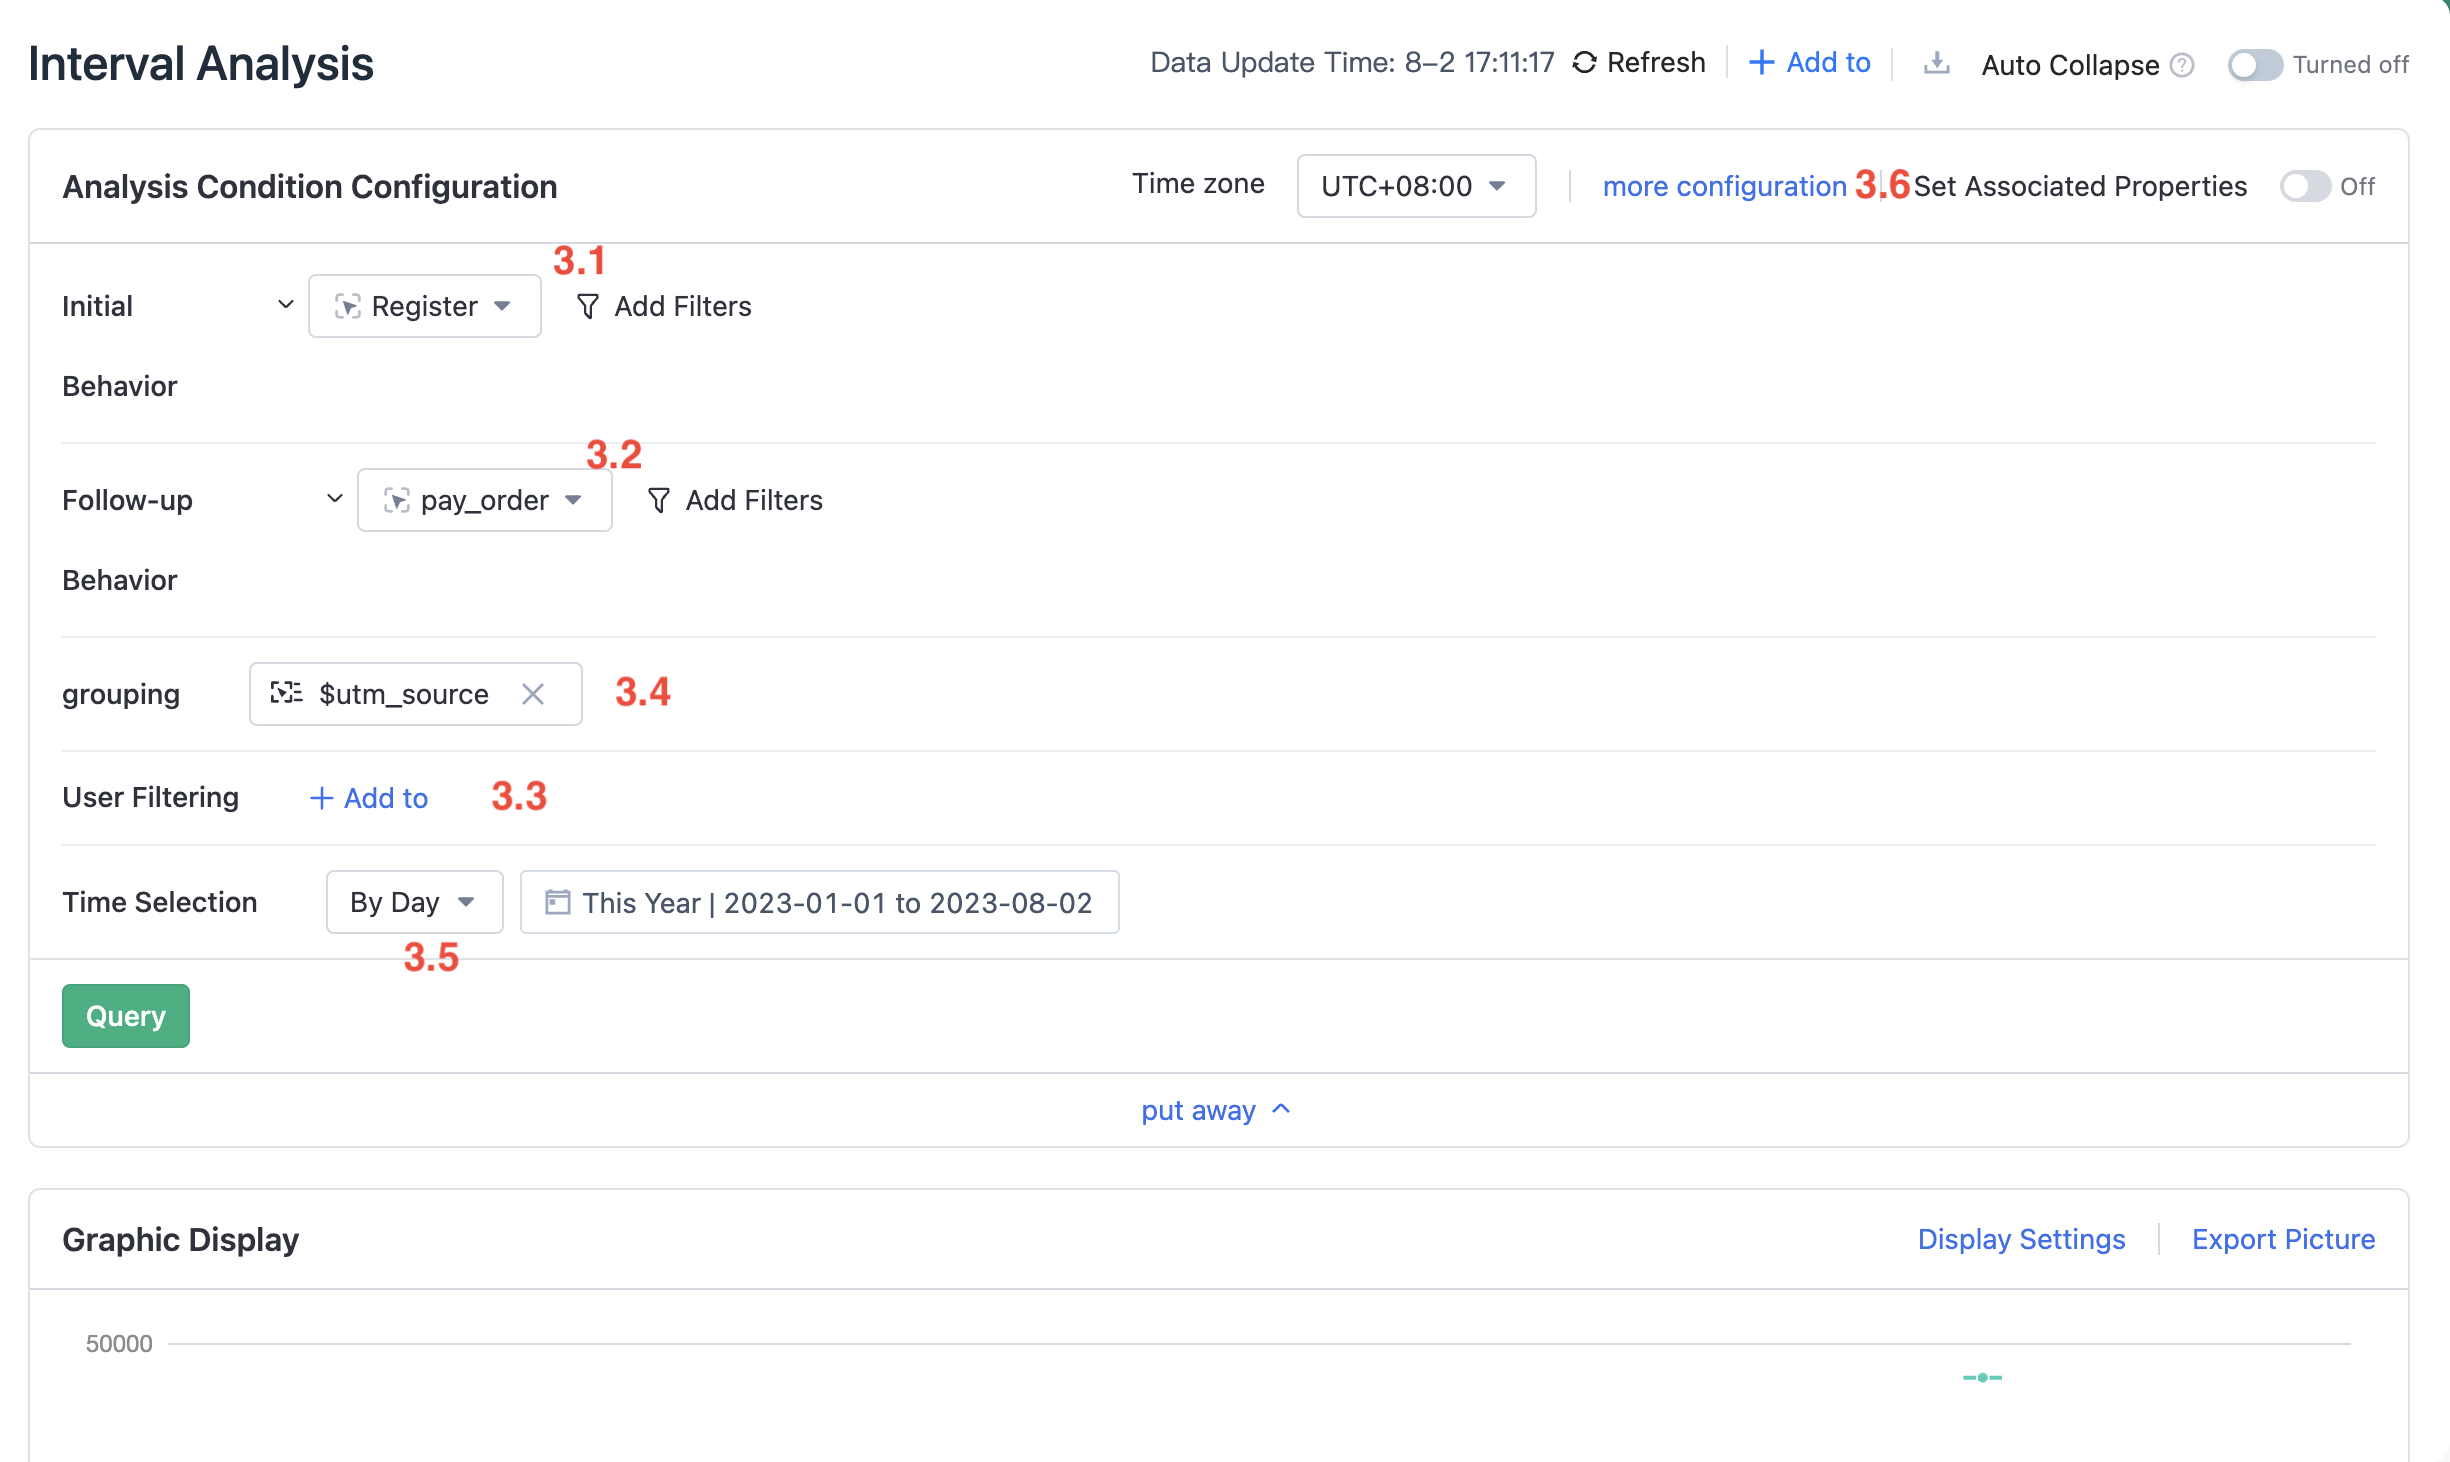
Select initial behavior and follow-up behavior.
Initial behavior and subsequent behavior fall into two categories:
- Initial behavior and follow-up behavior are different events. For example, for internet finance products, "successful registration" and "successful investment" are chosen, and for e-commerce products, "add to cart" and "submit an order" are chosen. Interval analysis is used to analyze the duration of user conversion in business processes, reflecting conversion willingness, and then optimizing product experience and operational strategies.
- The initial behavior and follow-up behavior are the same event. For example, in online education products, analyzing the time interval between a student's two classes to analyze their enthusiasm for learning. For e-commerce products, analyzing the time interval between a user's repeated purchases of household items to predict their next purchase and provide accurate recommendations.
Setting filtering conditions for initial and follow-up behaviors
According to actual analytical needs, filtering conditions can be added to either the initial or subsequent behaviors. For example, for luxury e-commerce, we want to analyze whether users who spent over 10,000 yuan on their previous order will quickly place another order.
Our hypothesis is that users who spend more on orders have higher trust in the platform and are richer than others, and therefore will be willing to place another order soon after their previous one. By analyzing this, we can offer them a discount coupon to encourage them to complete the next purchase sooner.
At this time, "Pay order" is selected for both the initial behavior and subsequent behavior, and the screening condition "order amount greater than 10000" is added to the initial behavior to meet the analysis requirements.
Setting user filtering conditions
Filter out the desired analytical objects based on user attributes. For example, only look at the time interval between behavior of female users in Zhejiang Province.
View by attribute grouping
There are three grouping methods for interval analysis.
- User Grouping by Behavior at First
- User Grouping by Behavior Later
- User Grouping by User Attributes
If you choose to view the segments by first behavior, for example, Registration Channel of Registration Success, then group users by the property values of Registration Channel associated with the event of Registration Success triggered by each user, and each user will only appear in one group.
Select Aggregation Time Unit
Available data aggregation time units:
- By day
- By week
- By month
Note that interval analysis does not support hour-level aggregation. This is because "by hour" requires the user's first and subsequent behaviors to occur within the same natural hour. Otherwise, the behaviors cannot be associated, resulting in inaccurate analysis results. See the calculation rules for first and subsequent behavior pairing in Calculation Rules below.
Set Associated Properties
It supports setting properties of the two events before and after to associate. The associated properties between different events can be the same or different, but they must have the same data type. Example: An e-commerce site has launched a marketing campaign and, in addition to monitoring the behavior flow of users from the product details page to completing the purchase, it also needs to accurately locate the user's behavior related to this marketing campaign. Therefore, the marketing activity ID is added as a property to the events View Product Details and Complete Payment. At this point, this property can be used as the association ID to ensure that the user is strictly paired according to this pattern.
View Analysis Results
The analysis result of interval analysis is presented in the form of a box plot, which provides a simple summary of the data set using only five points. It can display the maximum value, minimum value, median, and upper and lower quartiles of a set of data.
- You can see the maximum, minimum, median, and average interval time from
Event A→Event Bduring the entire time period.
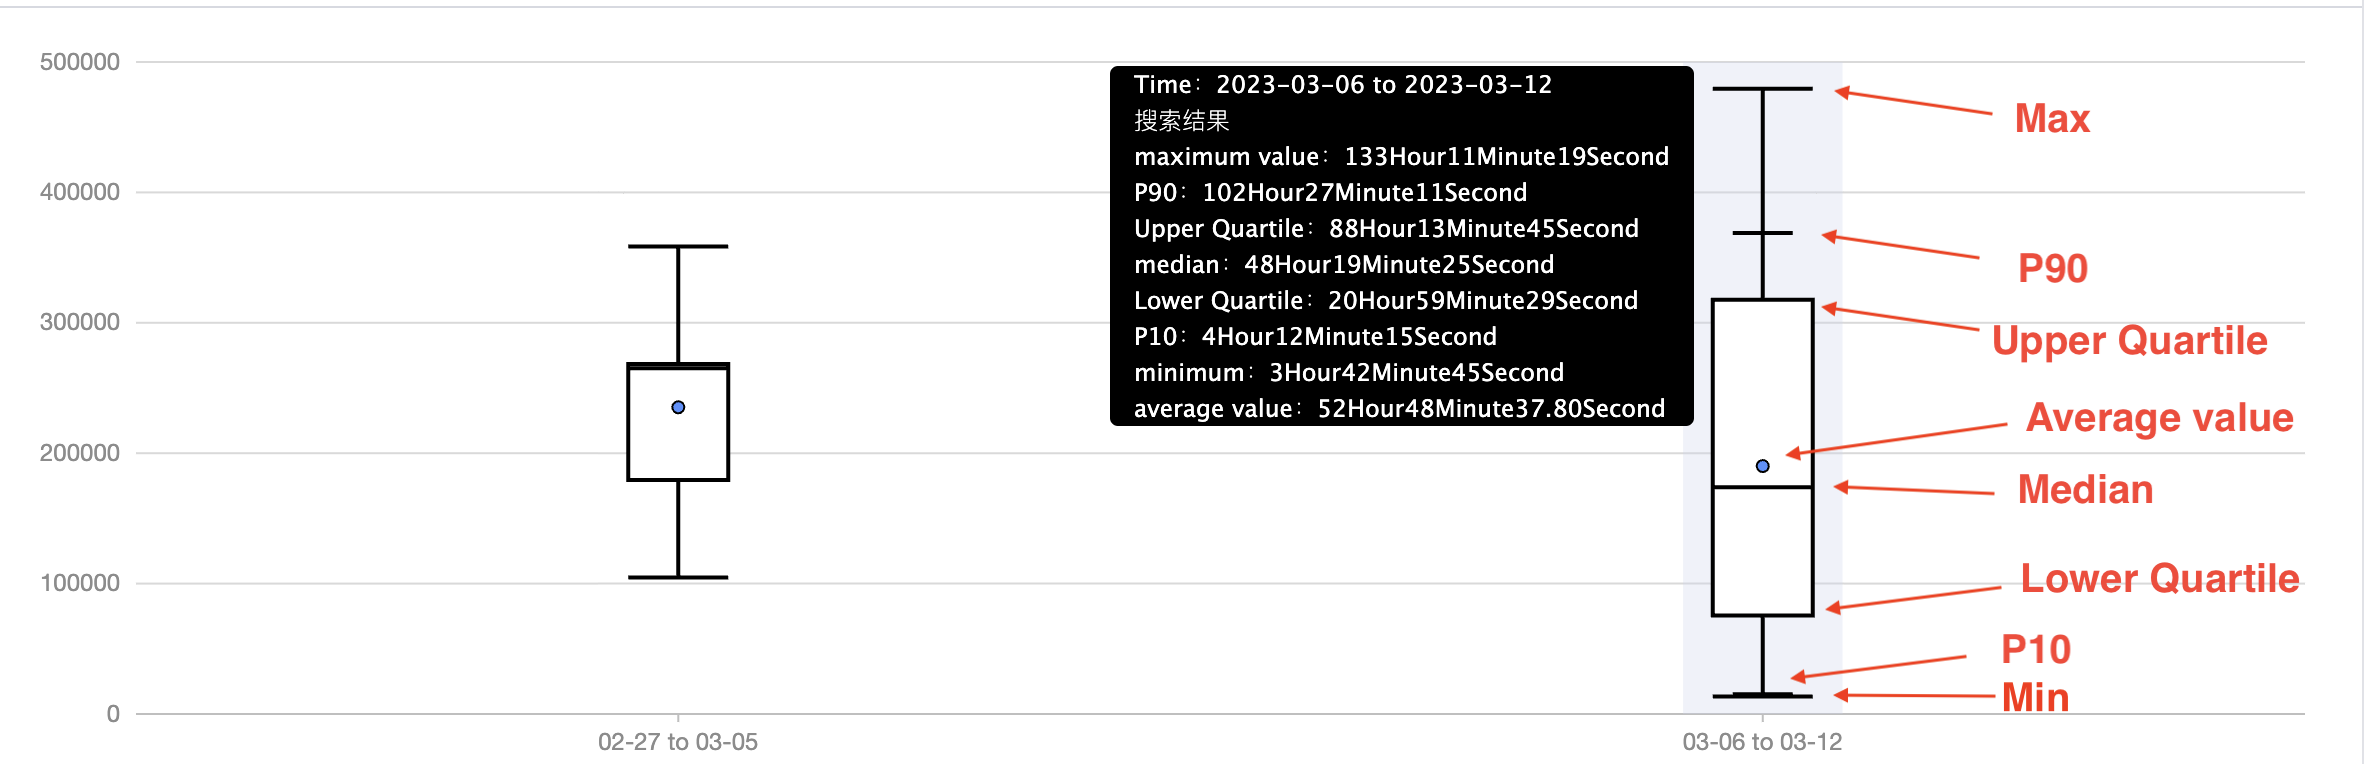
- Calculation rules of each metric in the analysis result:
- Interval count: The number of paired interval conversions completed according to the rules in the interval analysis in the selected time range (field in the download data).
- Converted user count: The total number of people who completed the interval conversion in the selected time range, and one person may complete multiple interval conversions.
- Average interval count per user: Interval count / Converted user count (field in the download data).
- Interval conversion duration: After the pairing of interval conversions is completed according to the rules in the interval analysis in the selected time range, the conversion time of each pair is calculated and counted.
- Maximum value: The maximum value of interval conversion duration.
- Minimum value: The minimum value of interval conversion duration.
- Median: Sort the average interval duration of each user from large to small and take the middle value.
- Upper quartile: Sort the average interval duration of each user from large to small and take the value at 1/4.
- Lower quartile: Arrange the average time interval for each user in descending order and take the value at 3/4 of the way through the list.
- P90: Arrange the average time interval for each user in descending order and take the value at 1/10 of the way through the list.
- P10: Arrange the average time interval for each user in descending order and take the value at 9/10 of the way through the list.
- Average: Total interval conversion time / number of intervals.
- Average conversion time per person: Total average interval time for each person / number of converted users.
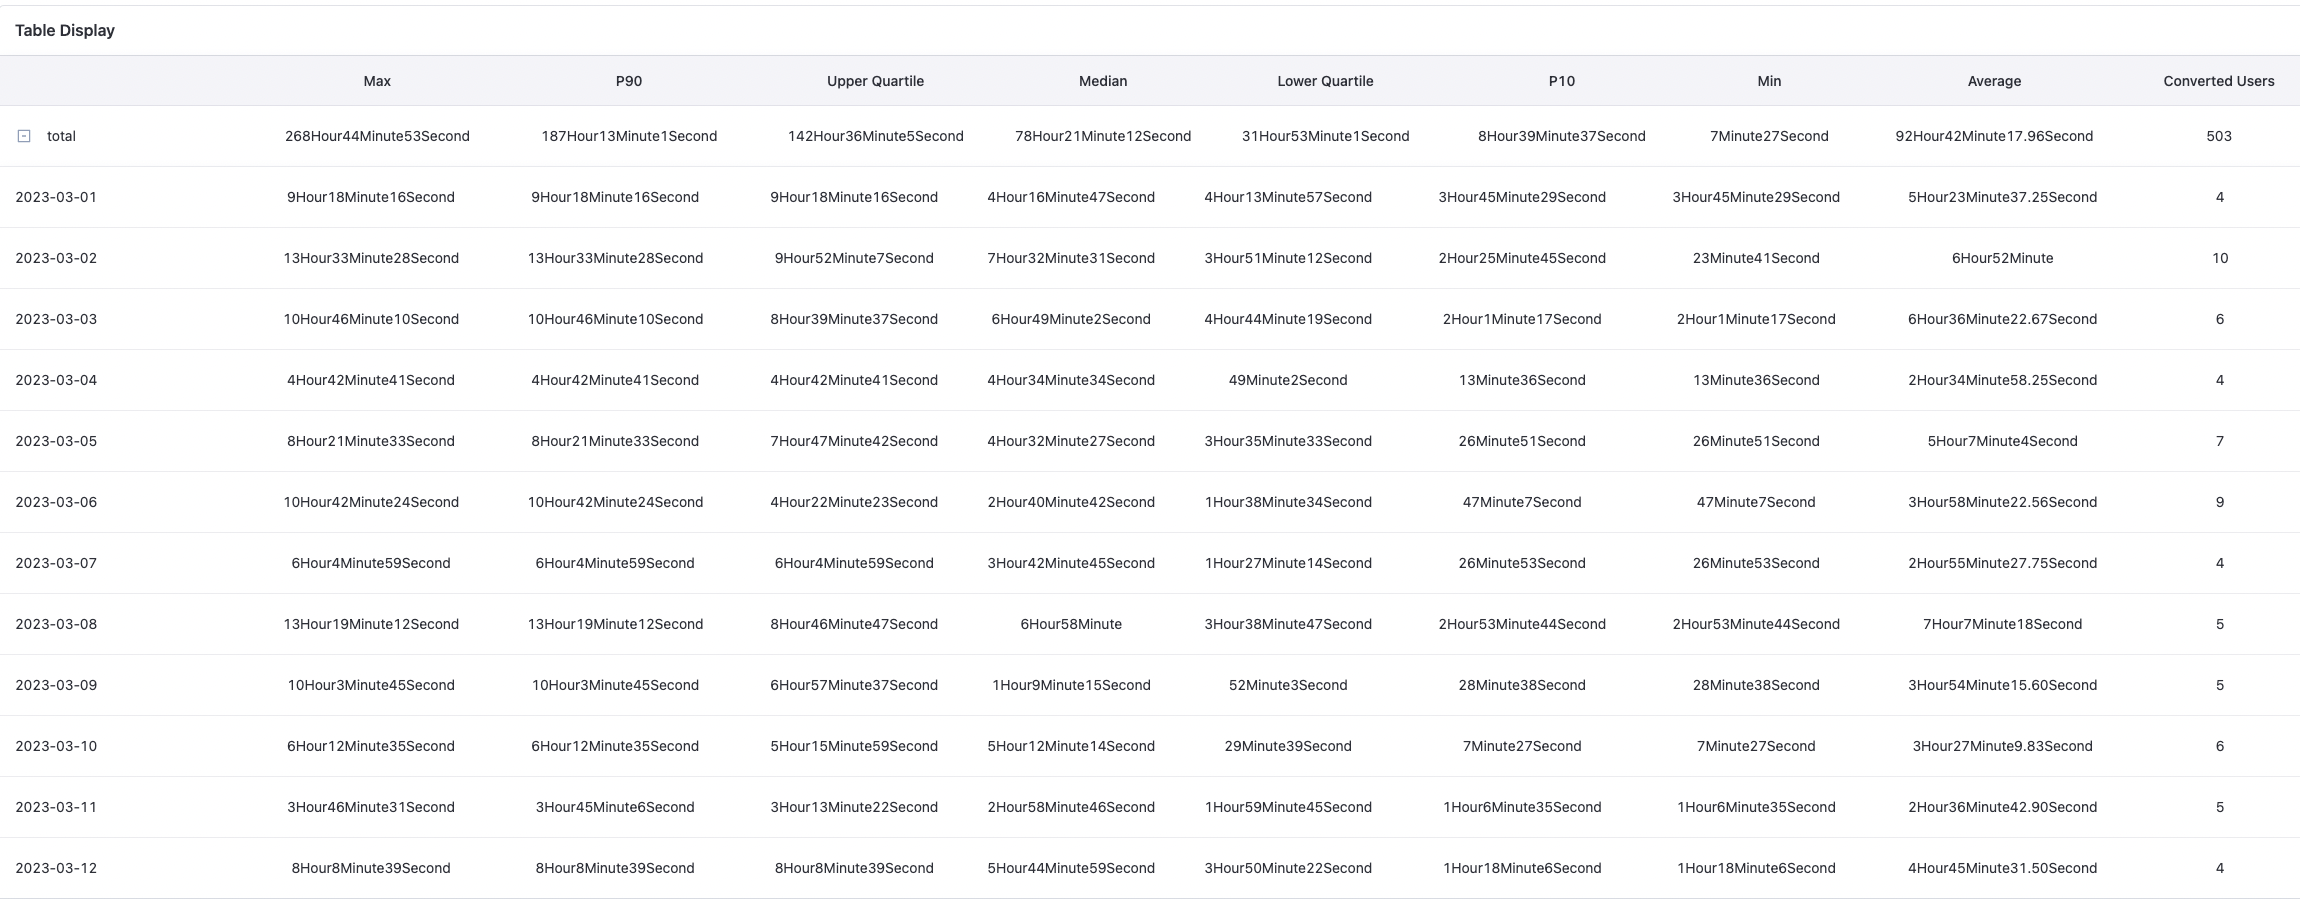
View the details of each grouping in the expanded table to understand the time interval details for each grouping.
How to pair initial and subsequent actions:
Assuming that a user's behavior sequence in some past time period is:A → C → A → B → B → A → B → B → A → A → C → D → A → B
If we analyze A Event和 B events of the time interval, the calculation rule will be as follows:
- After the
A eventoccurs,find theB eventnearest toA event, (closest to the time of the A event), which is the first interval. Continue to pair A and B events, and the intervals should not overlap, and so on. - Select the aggregation Time Unit, aggregation by day, week, month, will limit the pairing
A event和B eventoccur on the same day, week, or month, respectively. For example, if aggregated by day, the time of users occurA eventis 23:50, the time of users occurB eventof is 00:10 the next day. The two events cannot be paired. - At this time, if the aggregation time unit is not considered, the interval pairing result is: A → C → A → B → B → A → B → B → A → A → C → D → A → B
Typical use case example
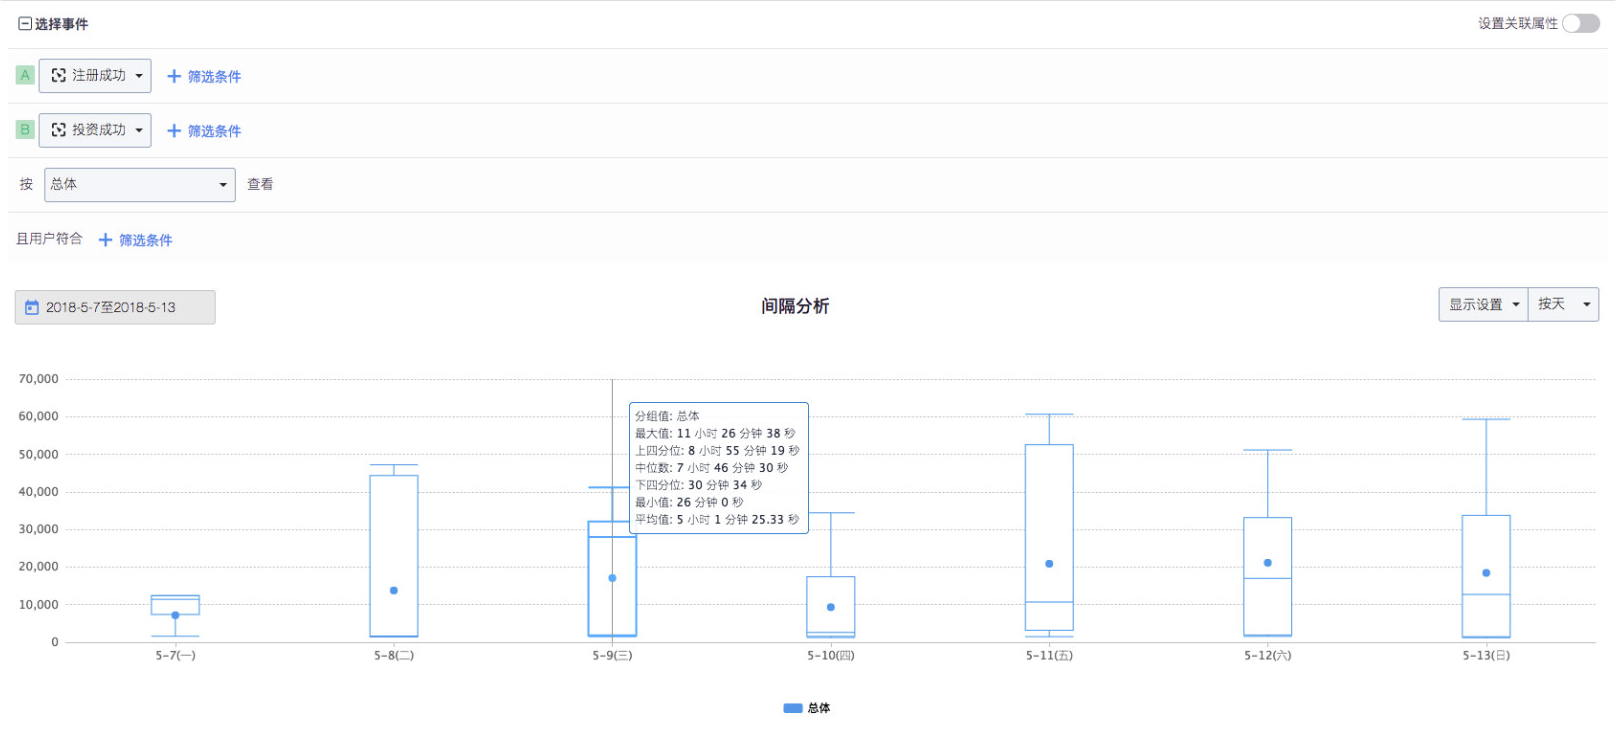
Take financial investment products as an example, whether the user has investment behavior is the key to the business. Therefore, in the product operation strategy, it will send red envelopes to new users to attract user investment. You can select a new user
registered successfullyandinvest successfullytwo events to obtain the time distribution of the user's first investment success. Meanwhile, the influence of various strategies on the conversion time was analyzed by configuring filtering conditions for event attributes.See the chart below for details:
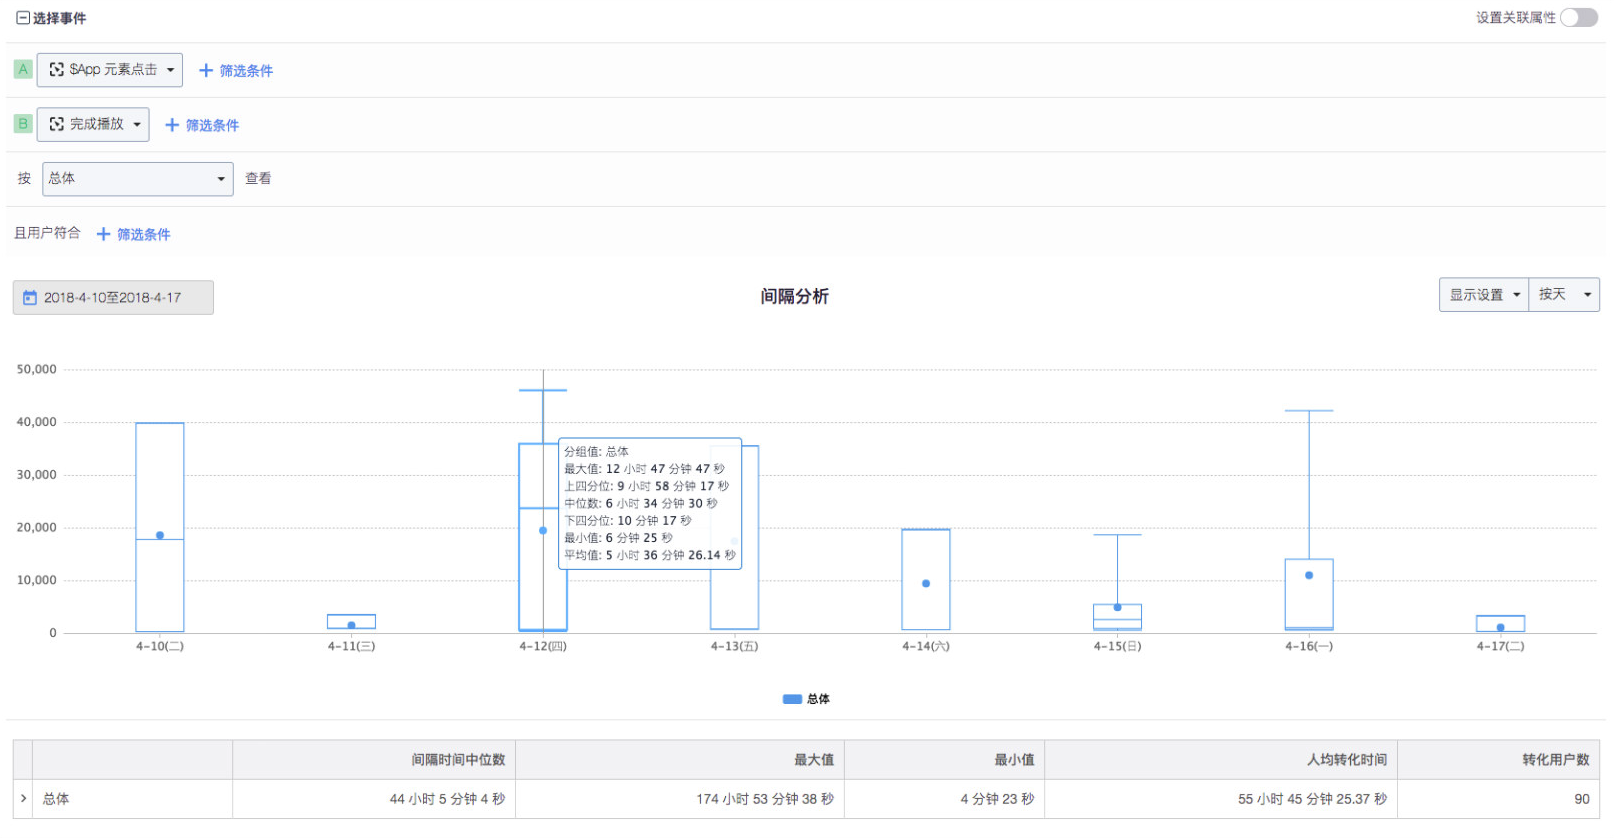
Take short video products as an example, which provide very rich video content for users to view. Content is the core value that short video apps provide to users. How to measure whether users feel this value. Here we choose Users watch a short video in its entirety as a judgment basis, while selecting the time spent for new users from
starting Appto finish playingas the analysis object. If the user generally takes a long time to complete the conversion, it means that the user needs to pay a high cost of video screening, and the user is likely to lose. So we select new users‘ time interval fromstarting App tofinish playingas the target of optimization.See the chart below for details:
Interval analysis is often a response to the business situation, and interval analysis is often not an indicator of optimization, but it can help us explore possible problems. If the median time between submitting an order and paying an order is 5 minutes, it means that half of users take more than 5 minutes to pay an order. At this time, we should take the initiative to think about the possible problems, whether it is the Bug of the payment function or other problems that lead to the payment failure, and we need to locate the problems by combining event analysis, funnel analysis and other functions.
FAQ
Can I use the interval analysis function to analyze the page stay time, and what is the difference between the time interval and the page stay time?
A: No. Assume that the registration process includes Mobile number registration, fill in the basic information, real name authentication three events. The time interval of fill in the basic information and real name authentication is not how long the user stays on the basic information page. Because there may be other actions between the two actions Fill in the basic information and real name authentication. And once Fill in the basic information and real name authentication is triggered,you can use "interval analysis" to calculate.
Note: The content of this document is a technical document that provides details on how to use the Sensors product and does not include sales terms; the specific content of enterprise procurement products and technical services shall be subject to the commercial procurement contract.
 Popular Searches