Basic Metric Configuration Instructions
|
Collect
1. Web Daily Active Users (UV)
Definition: The number of unique users who access the website within a day (00:00-24:00). If the same visitor visits the website multiple times on the same day, it will only be counted once.
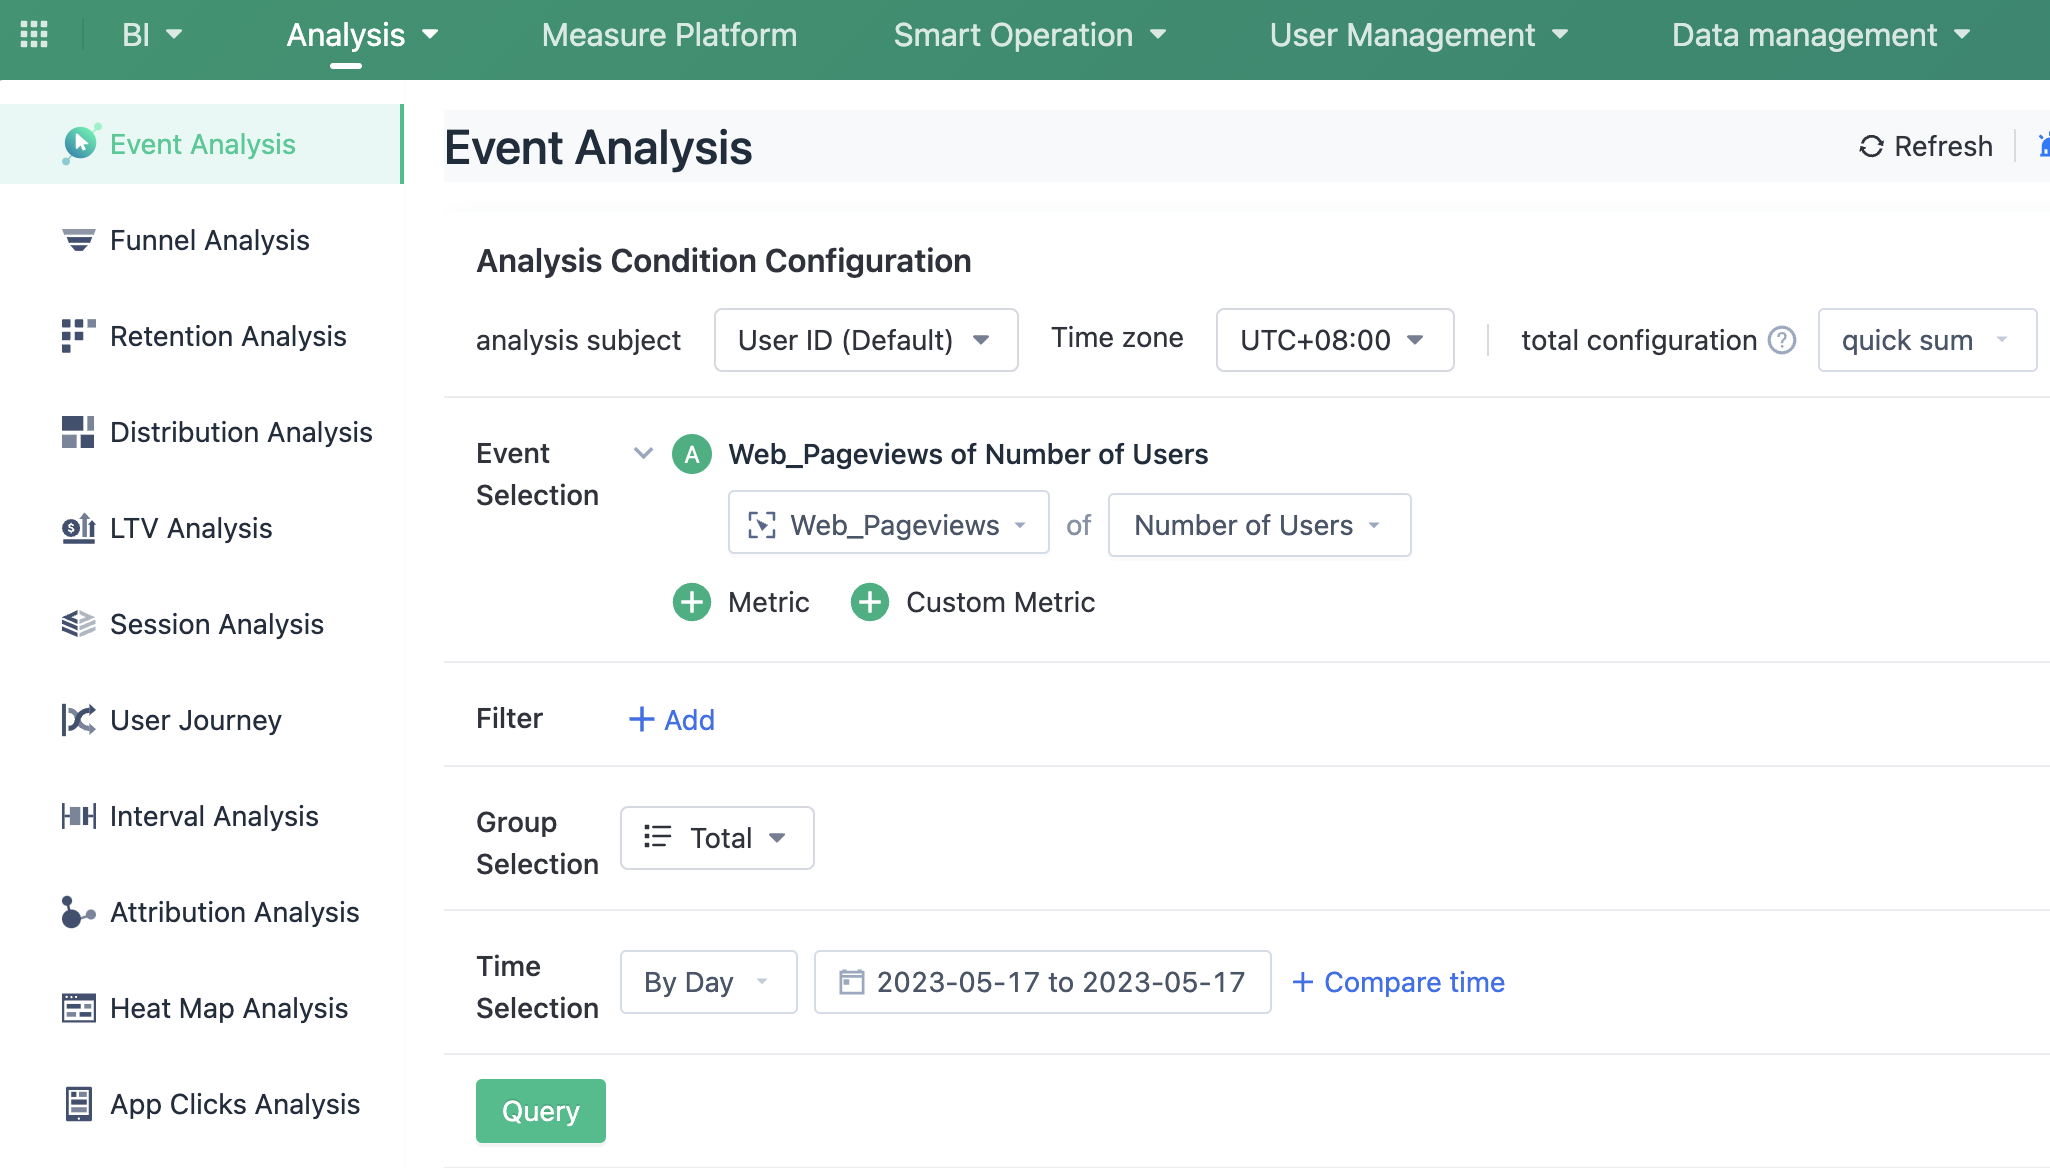
1. Select the "Event Analysis" function.
2. Select the event: Web Page Views.
3. Select the metric: Number of Users.
2. App Daily Active Users (UV)
Definition: The number of unique users who accesses the app within a day (00:00-24:00). If the same visitor visits the app multiple times on the same day, it will only be counted once.
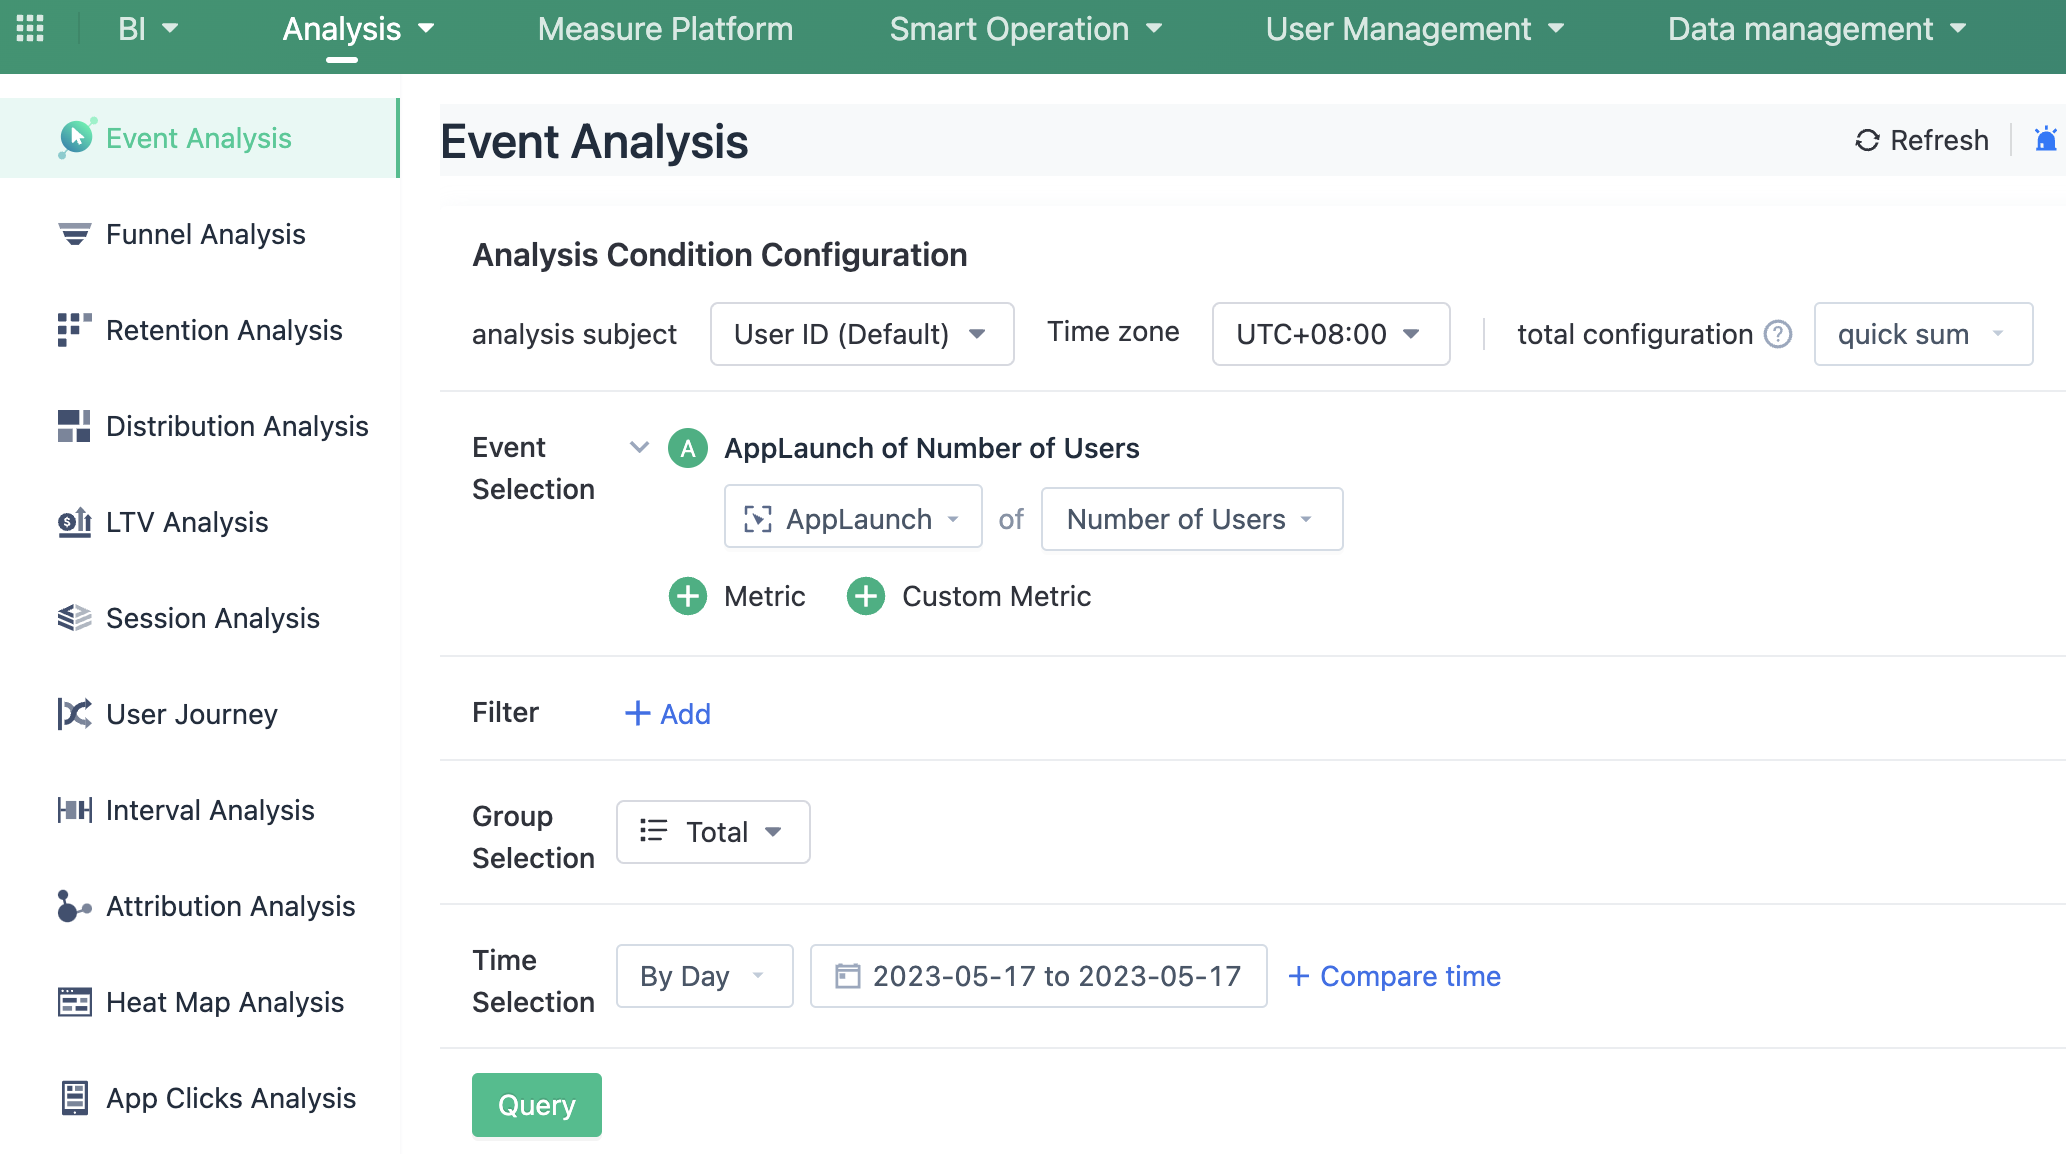
1. Select the "Event Analysis" function.
2. Select the event: App Launch.
3. Select the metric: Number of Users.
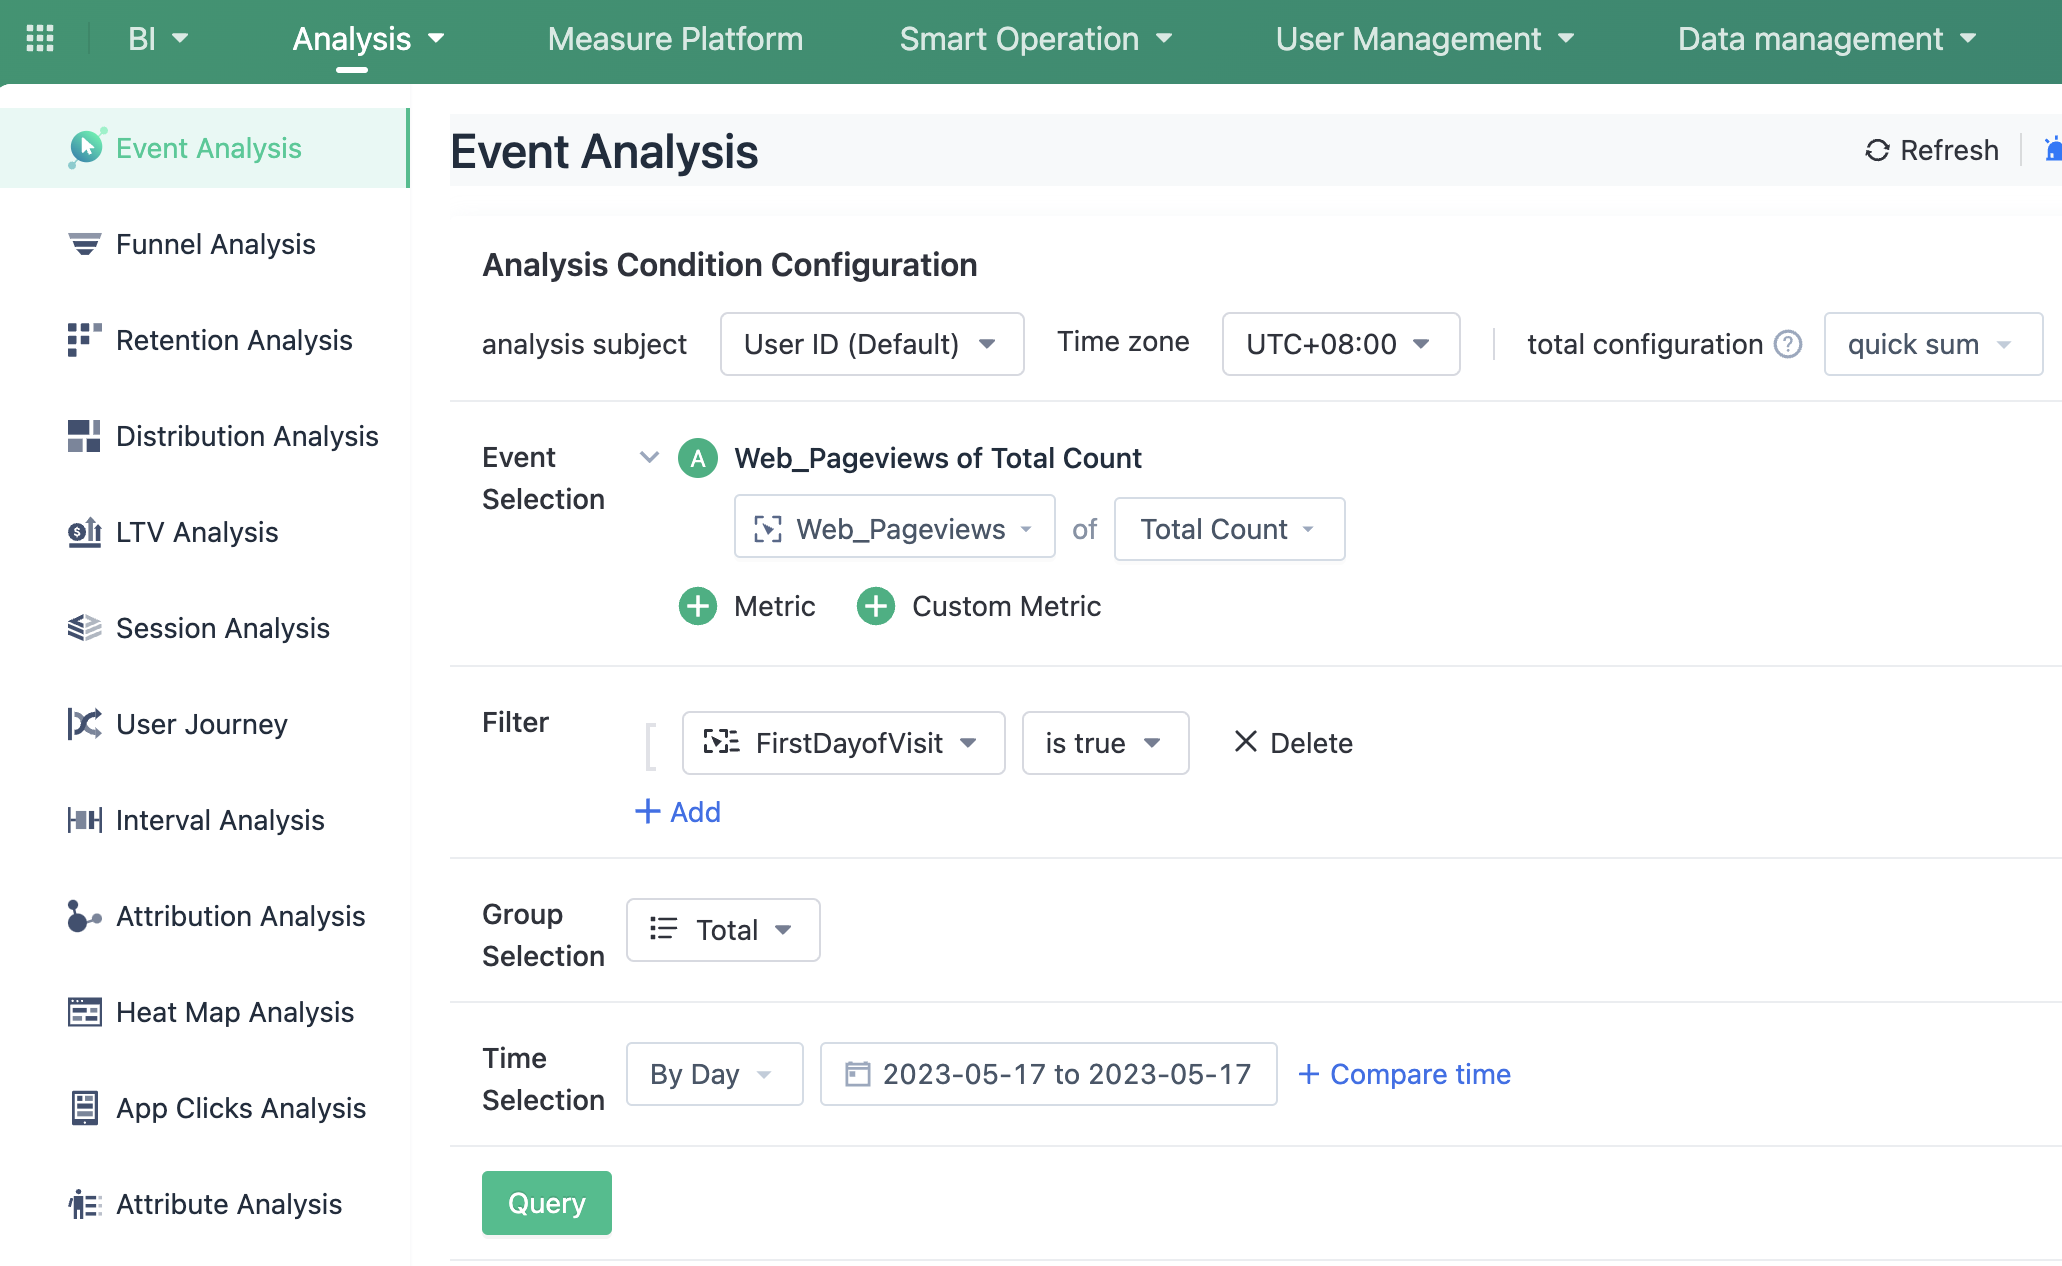
3. Page View (PV)
Definition: Page views refer to instances where a page is loaded (or reloaded) by a browser. Page views can be defined as a metric for the total number of page views.
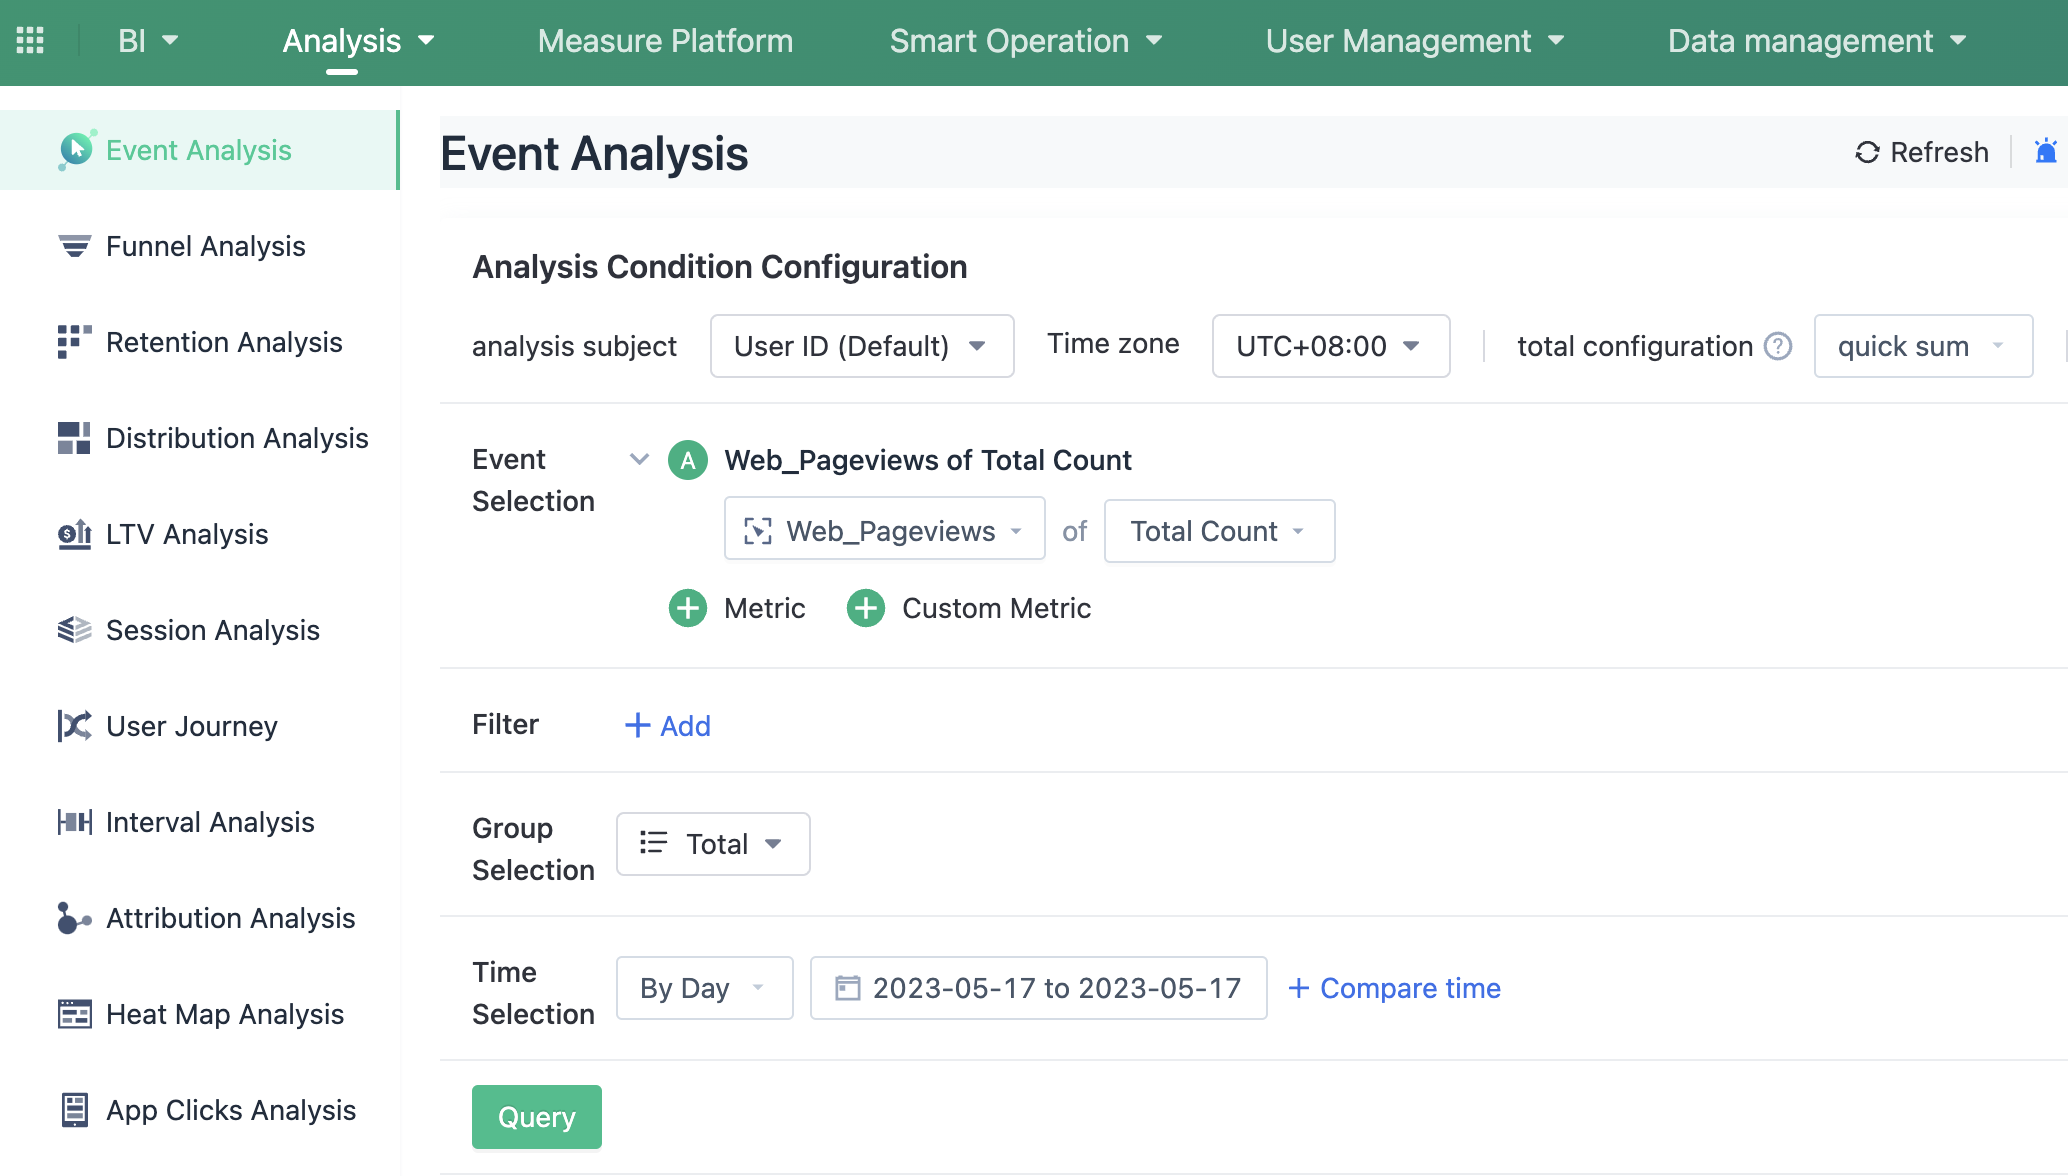
1. Select the "Event Analysis" function.
2. Select the event: Web Page Views.
3. Select the metric: Total Count.
4. Newly Registered Users
Definition: The number of registered users on the same day.
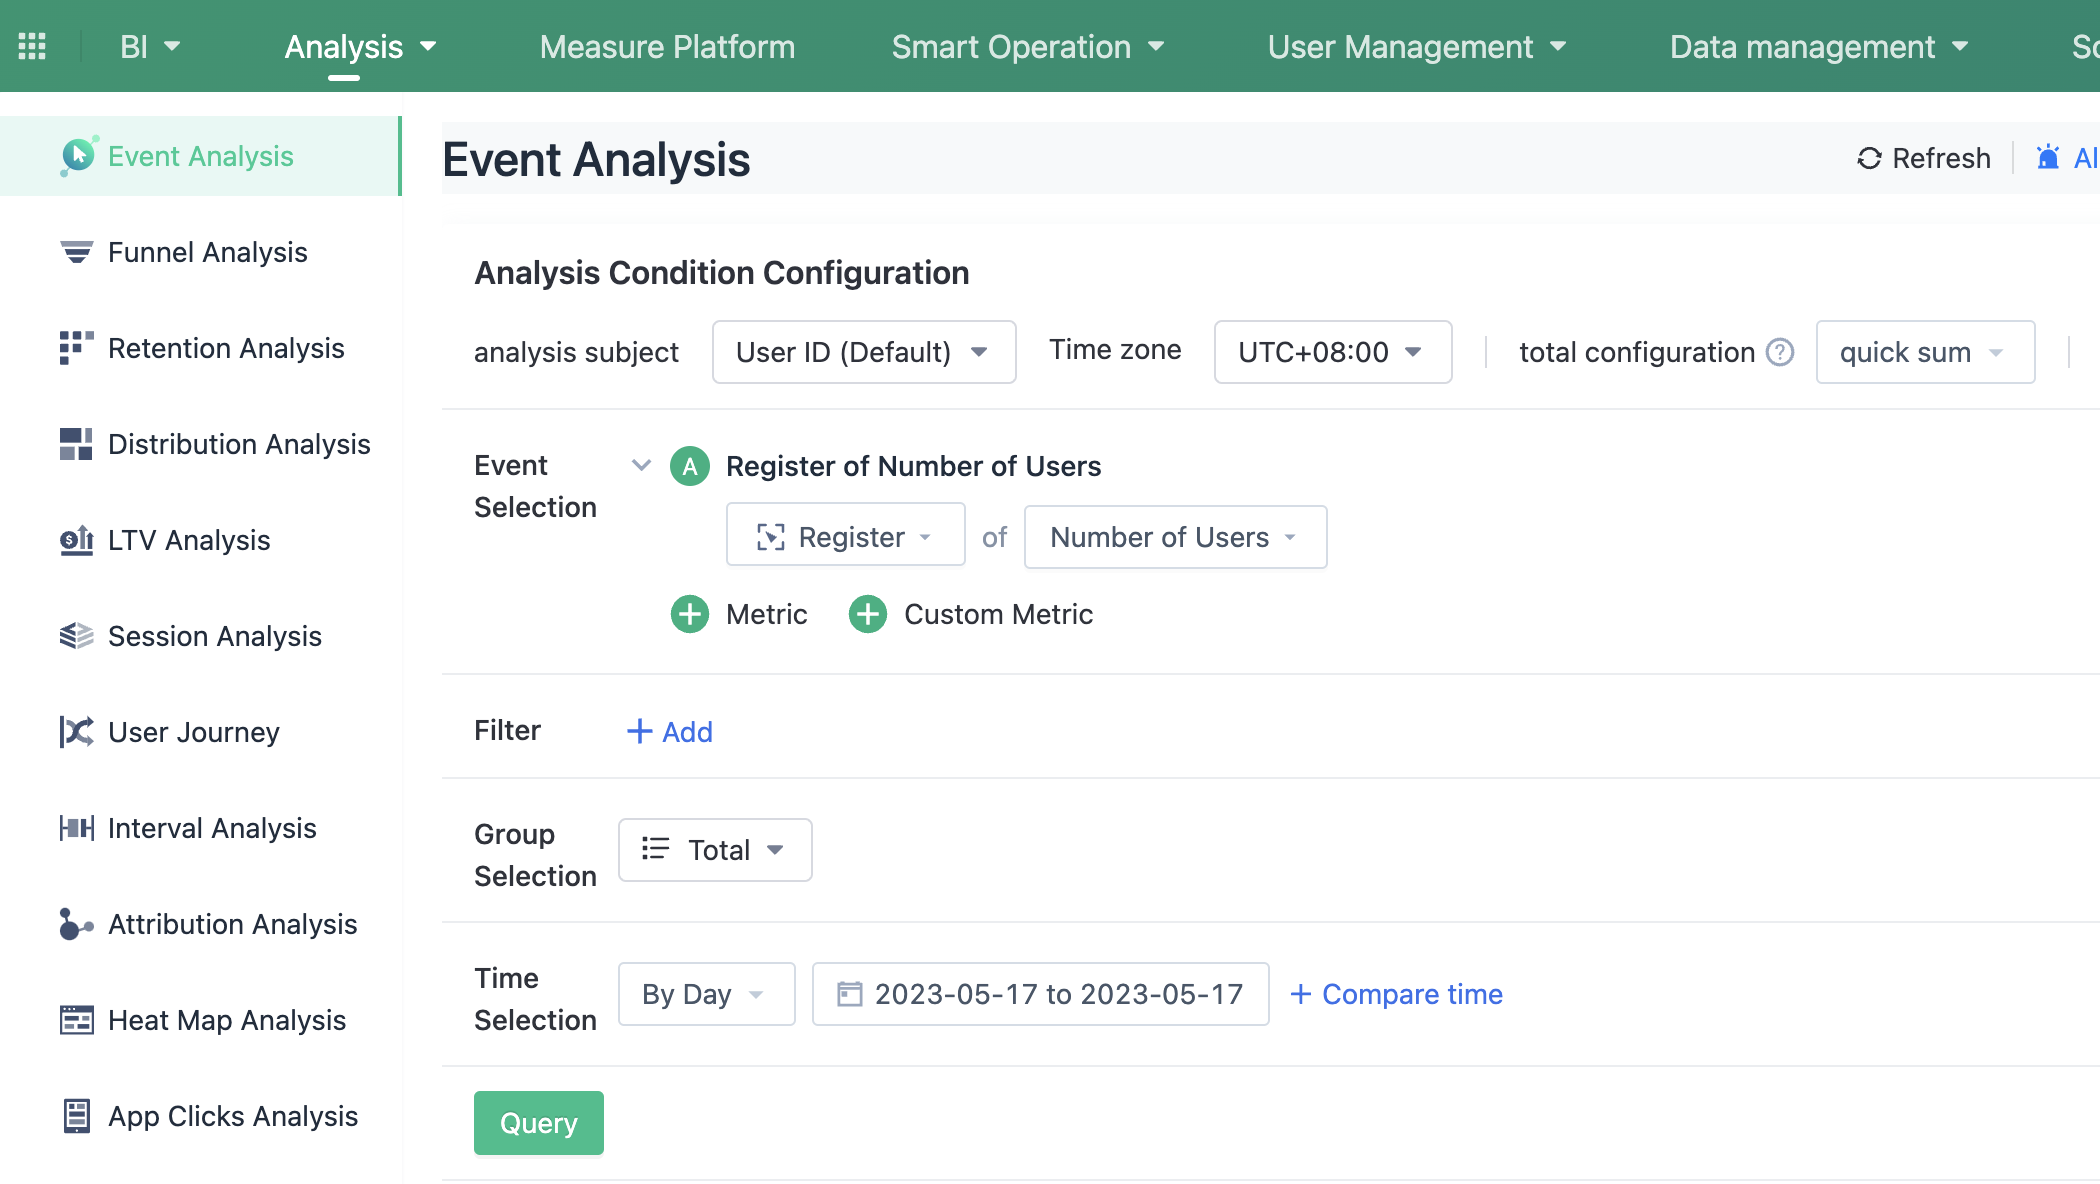
1. Select the "Event Analysis" function.
2. Select the event: Register.
3. Select the metric: Number of Users.
5. New Web Users
Definition: Among the Independent visitors on the same day, visitors who visit the website for the first time in history are defined as new users.
1. Select the "Event Analysis" function.
2. Select the event: Web Page Views.
3. Select the metric: Users.
4. Add filter: First Day of Visit is true.
6. New App Users
Definition: Among the users who starts up the app on the same day, users who starts up the app for the first time in history are defined as new users.
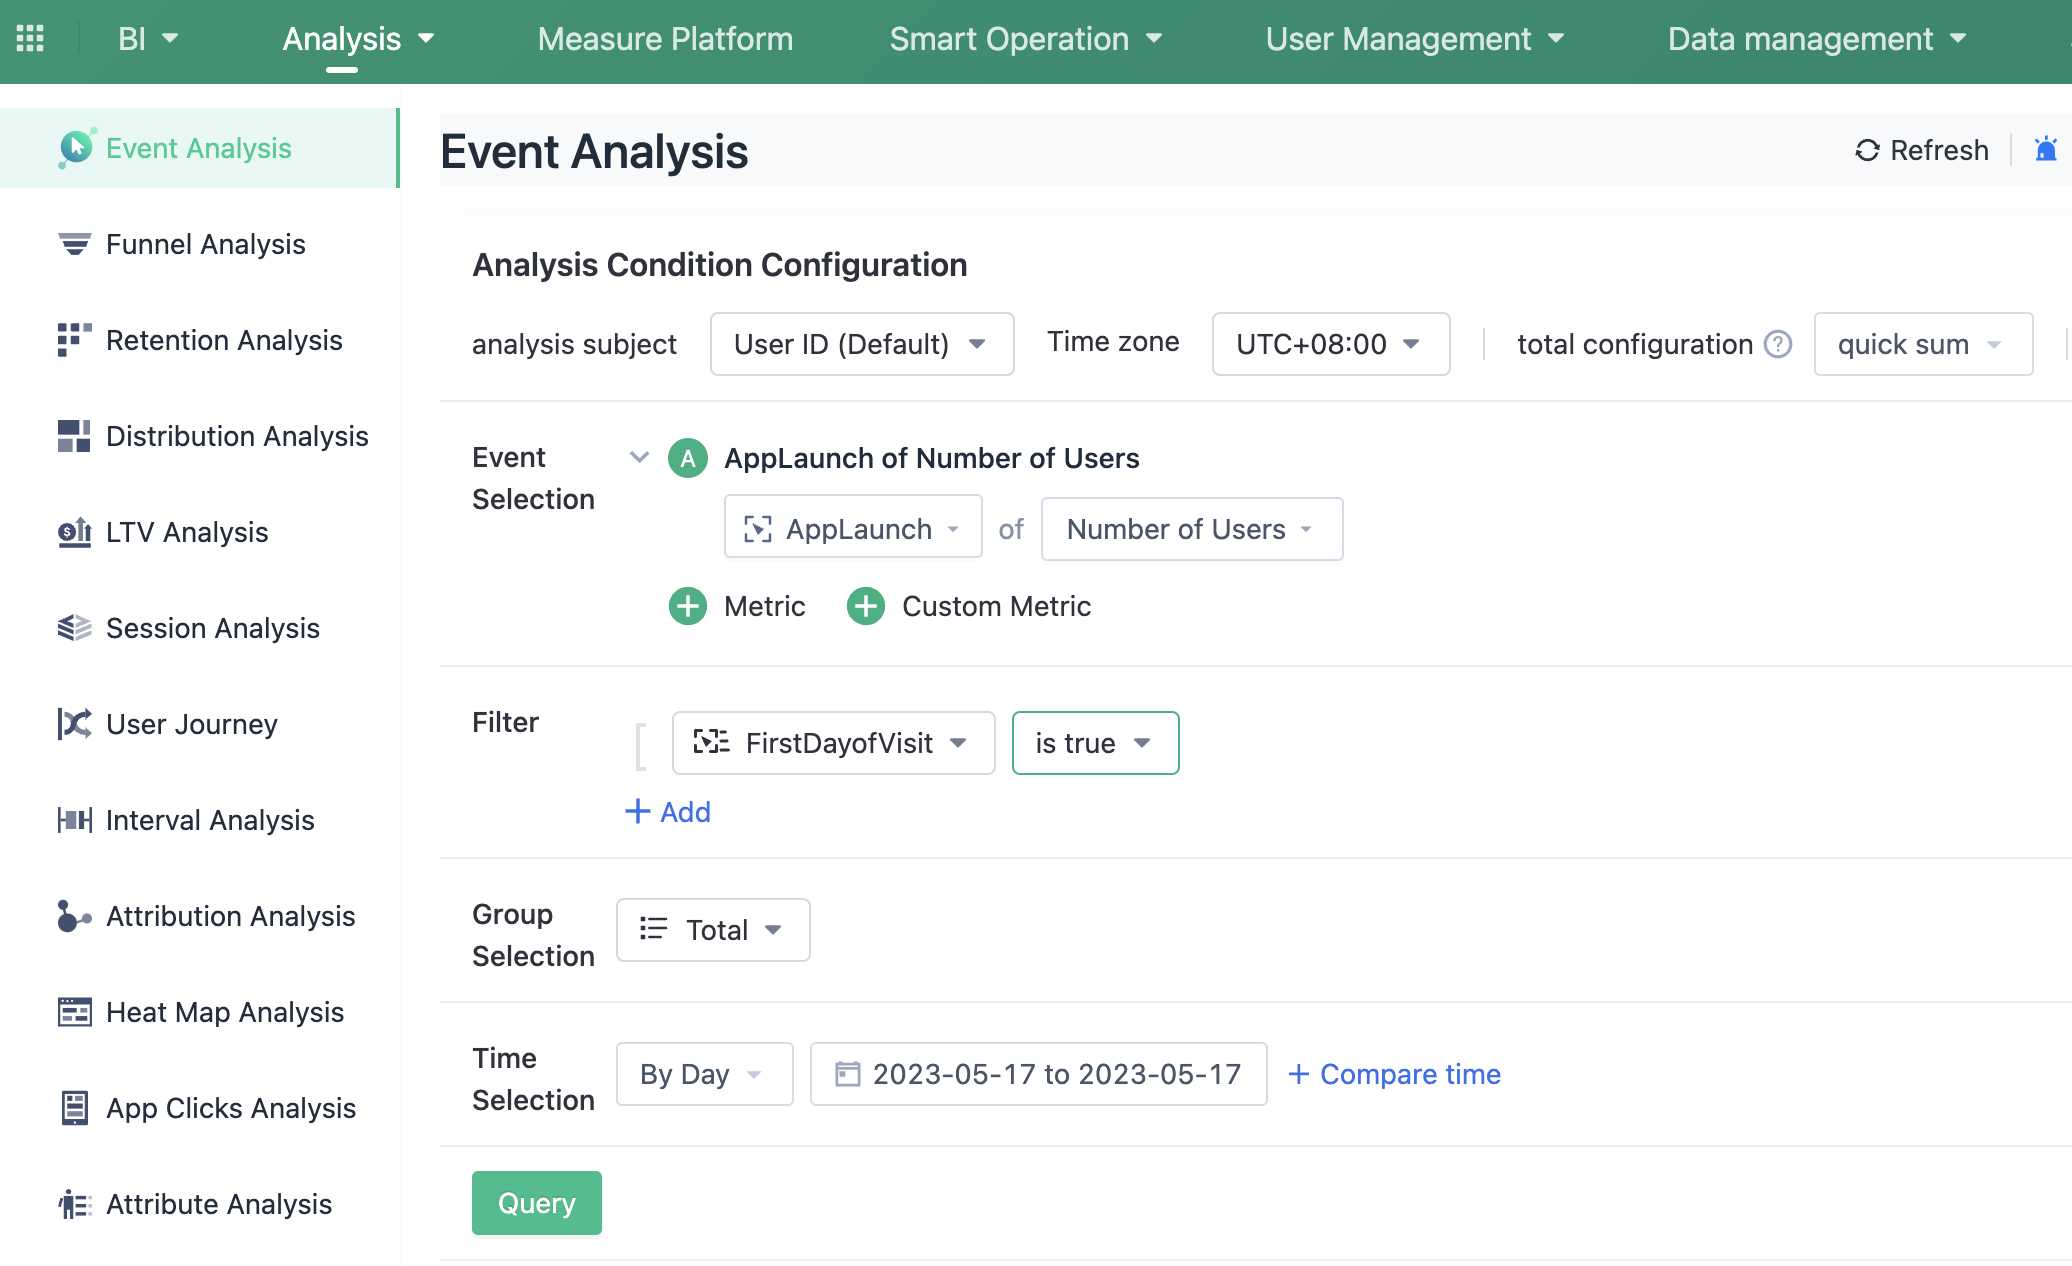
1. Select the "Event Analysis" function.
2. Select the event: App Launch.
3. Select the metric: Users.
4. Add filter: First Day of Visit is true.
7. Web New User Ratio
Definition: The proportion of new users among all visitors on the day.
* Firstly, create a virtual event: Web New User
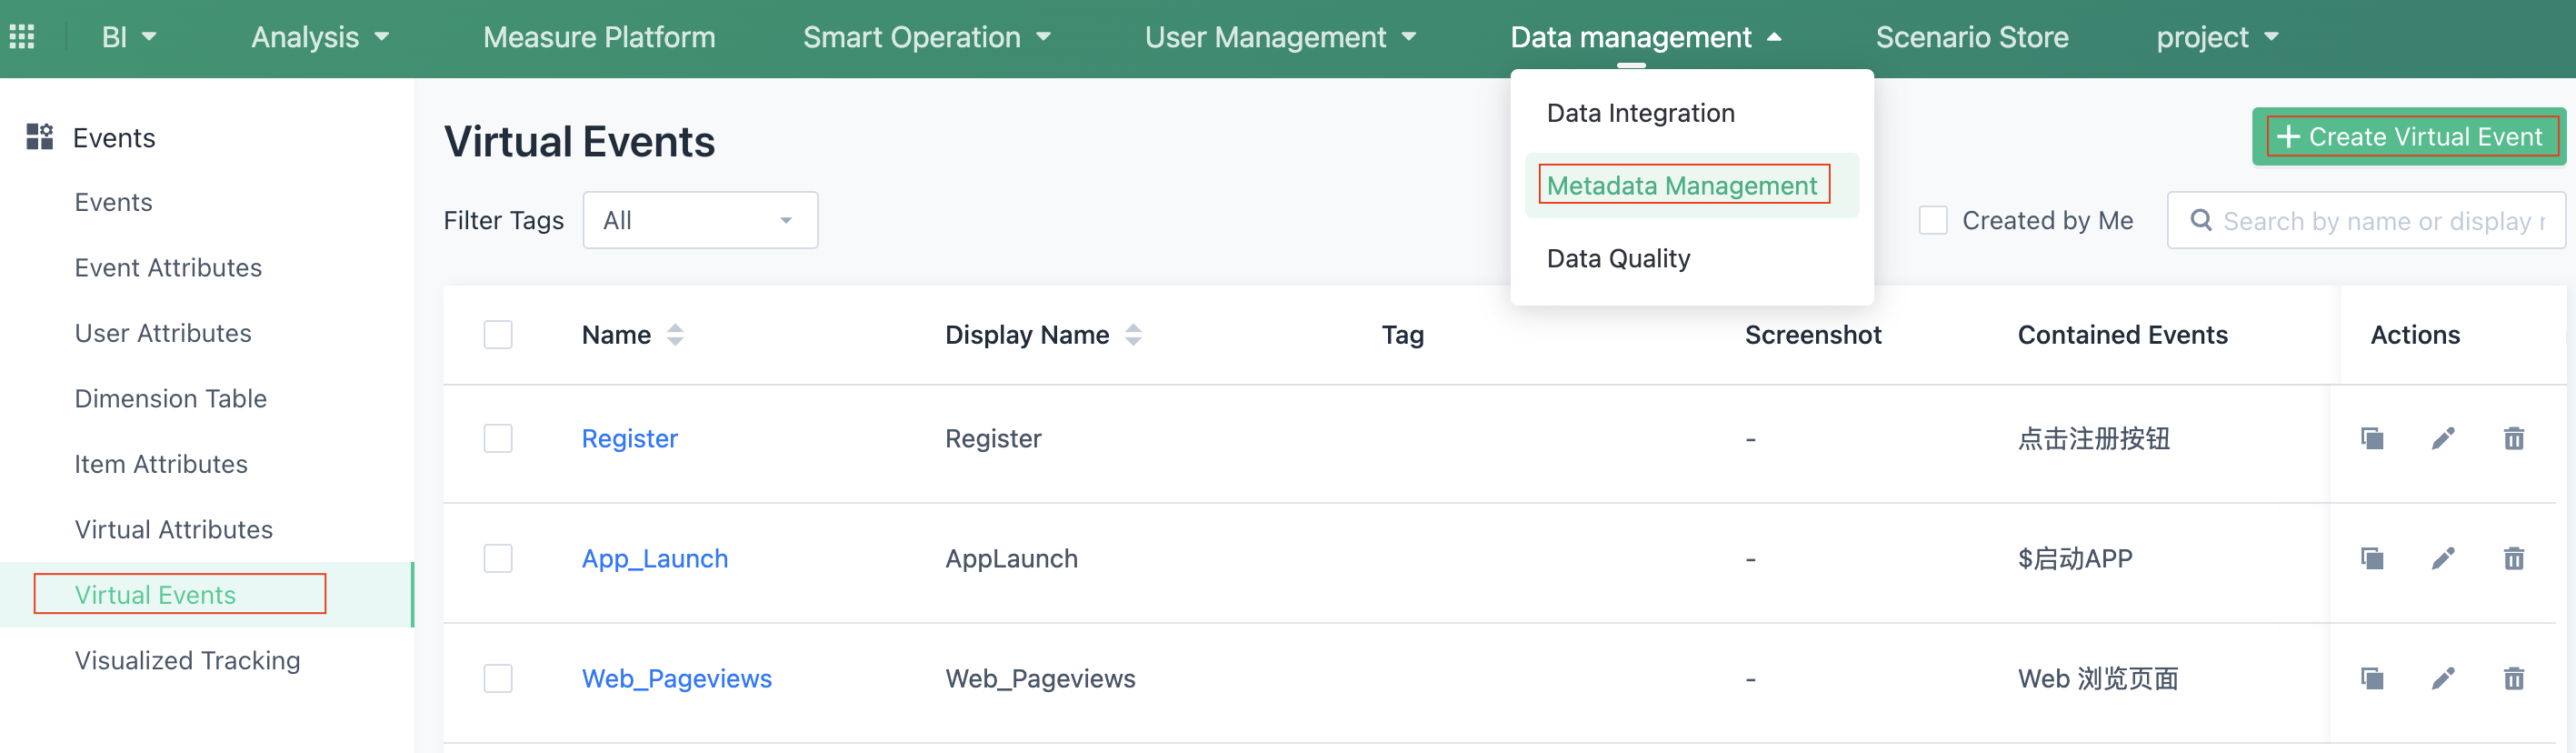
1. Click on the "Metadata" on the page and find the virtual events.
2. Create a virtual event.
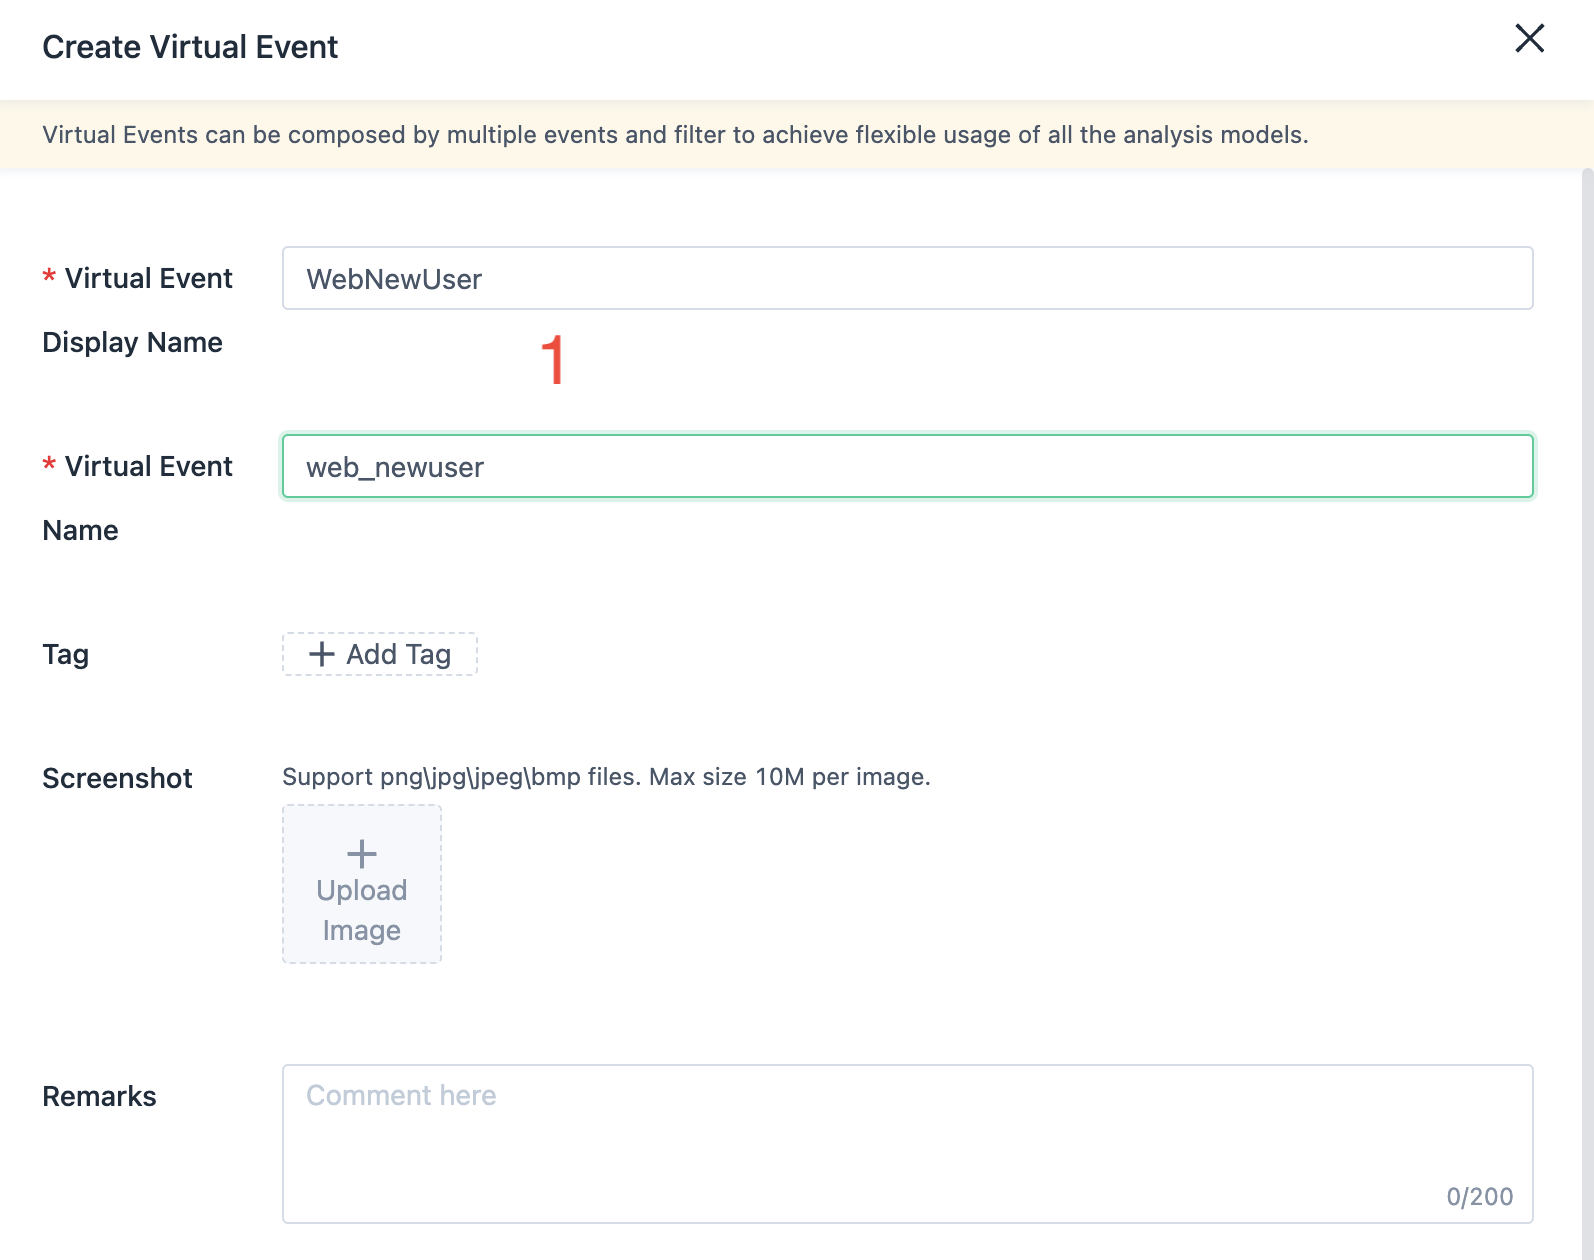
1. Set the virtual event name and display name, as shown above.
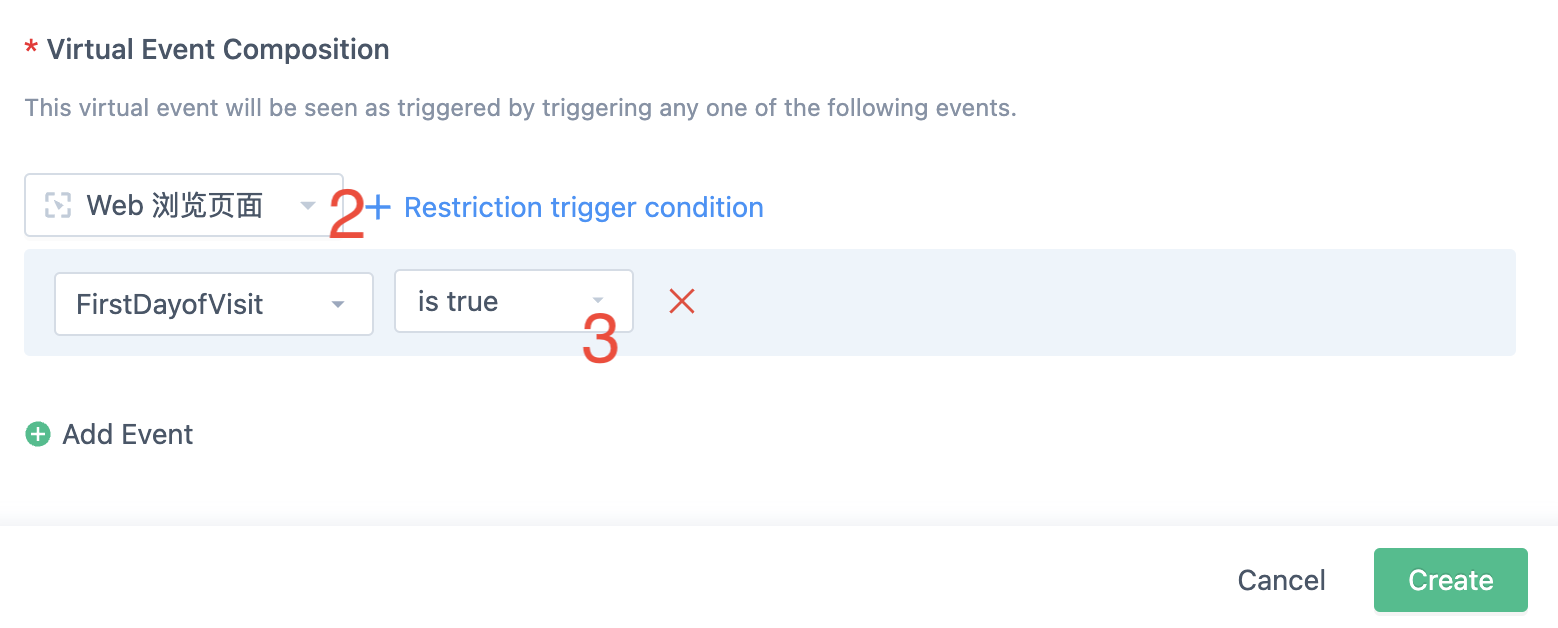
2. The composition of the virtual event selects the event: Web pageview.
3. Add restriction conditions: first-day of visit is true.
Next, let's calculate the new user proportion metric.
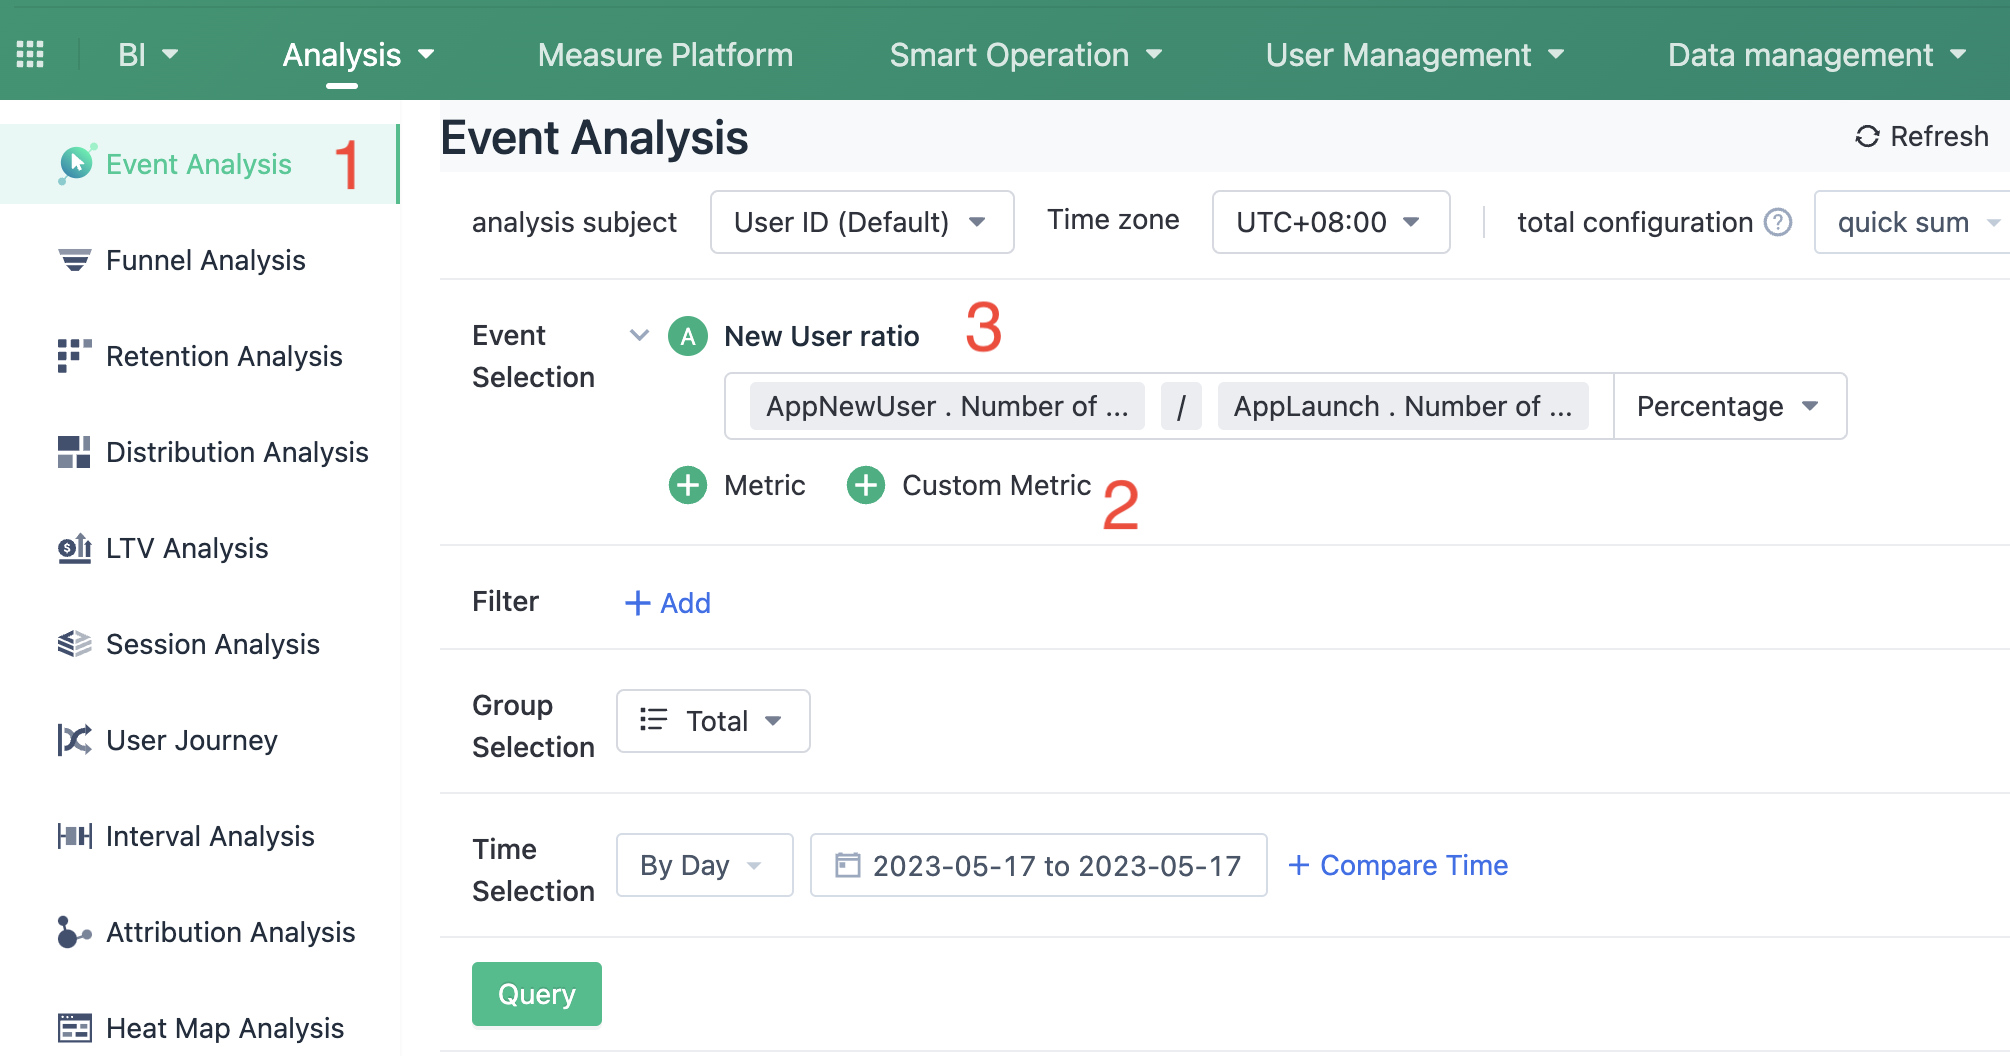
7.1. Switch to custom metrics
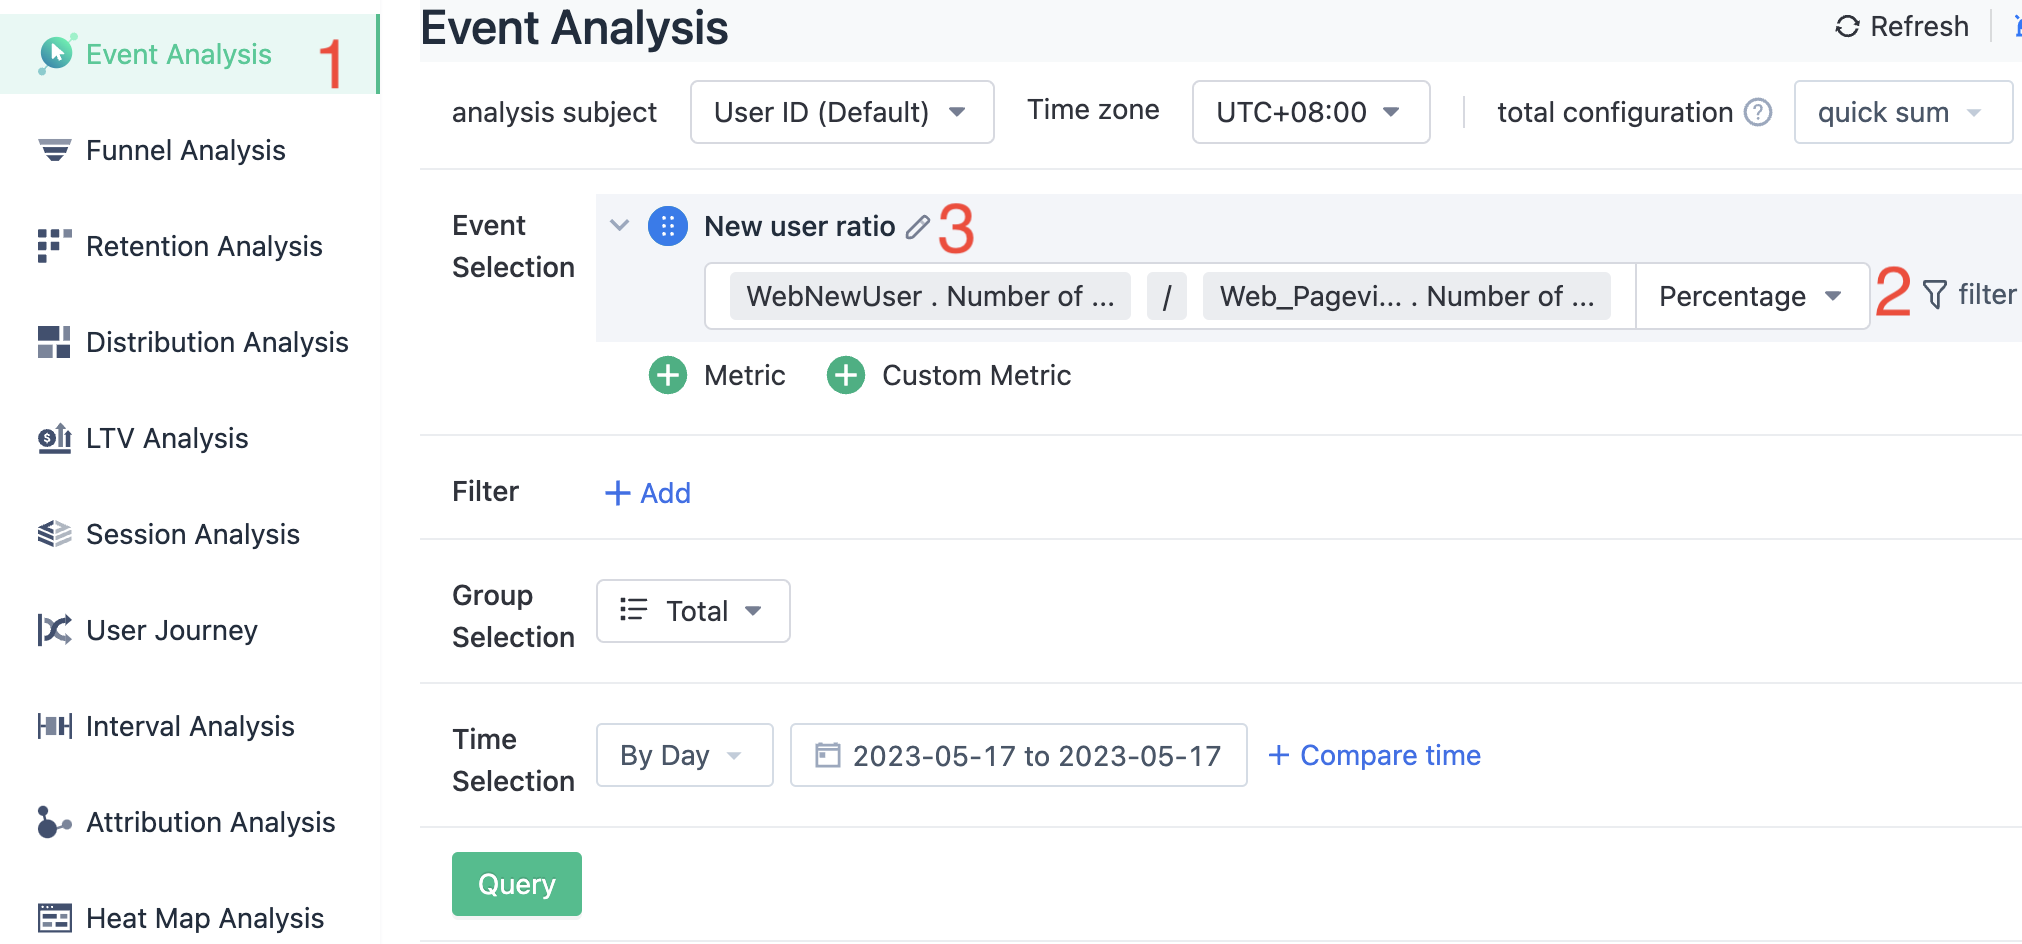
1. Click on the event analysis function on the left.
2. Click "Add Custom Metric" and enter the formula: [Web] New User Access.Number of Users/ Web Pageviews. Number of Users.
3. Name it "New User ratio".
4. Finally, click "Save".
8. App New User Ratio
The proportion of new users among all users who start the App on the day.
8.1. Create a virtual event: [App] New User Access first.
1. Click on the metadata on the page and find the virtual event.
2. Create a virtual event.
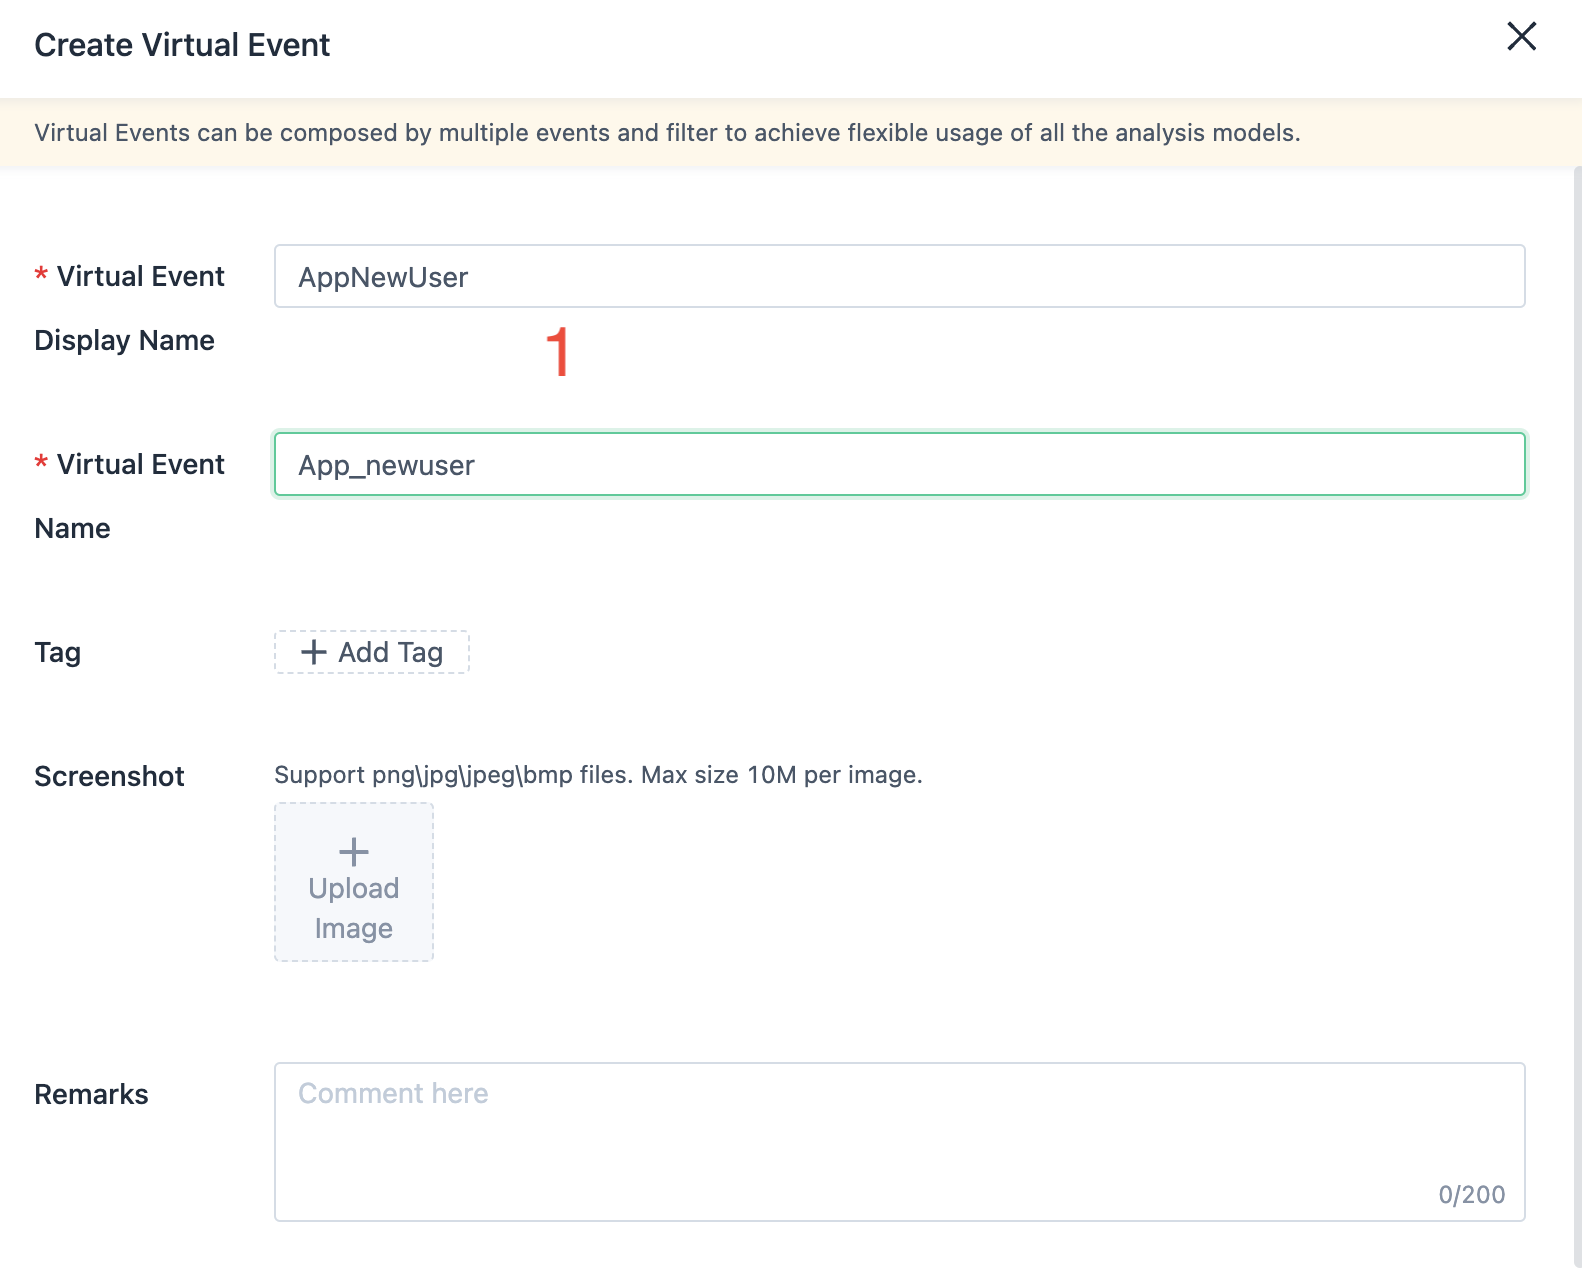
1. Set the virtual event name and display name, as shown above.
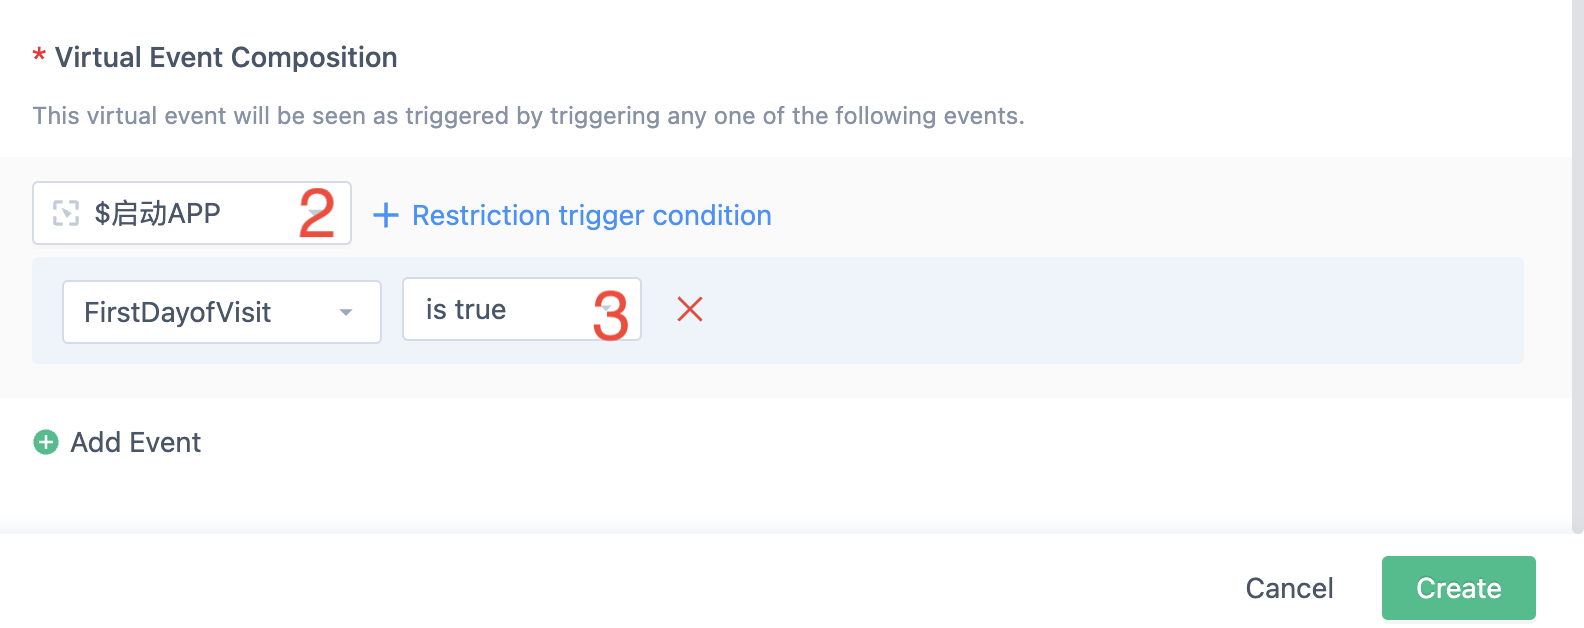
2. The composition of the virtual event selects the event: App start.
3. Add restriction conditions: Whether the first-day visit is true.
Next, let's calculate the new user proportion metric.
8.2. Switch to custom metrics
1. Click on the event analysis function on the left.
2. Click "Add Custom Metric" and enter the formula: [App] New User. Number of User/ App Launch. Number of User
3. Name it "New User ratio".
4. Finally, click "Save".
9. Number of App Starts
Definition: The number of App starts
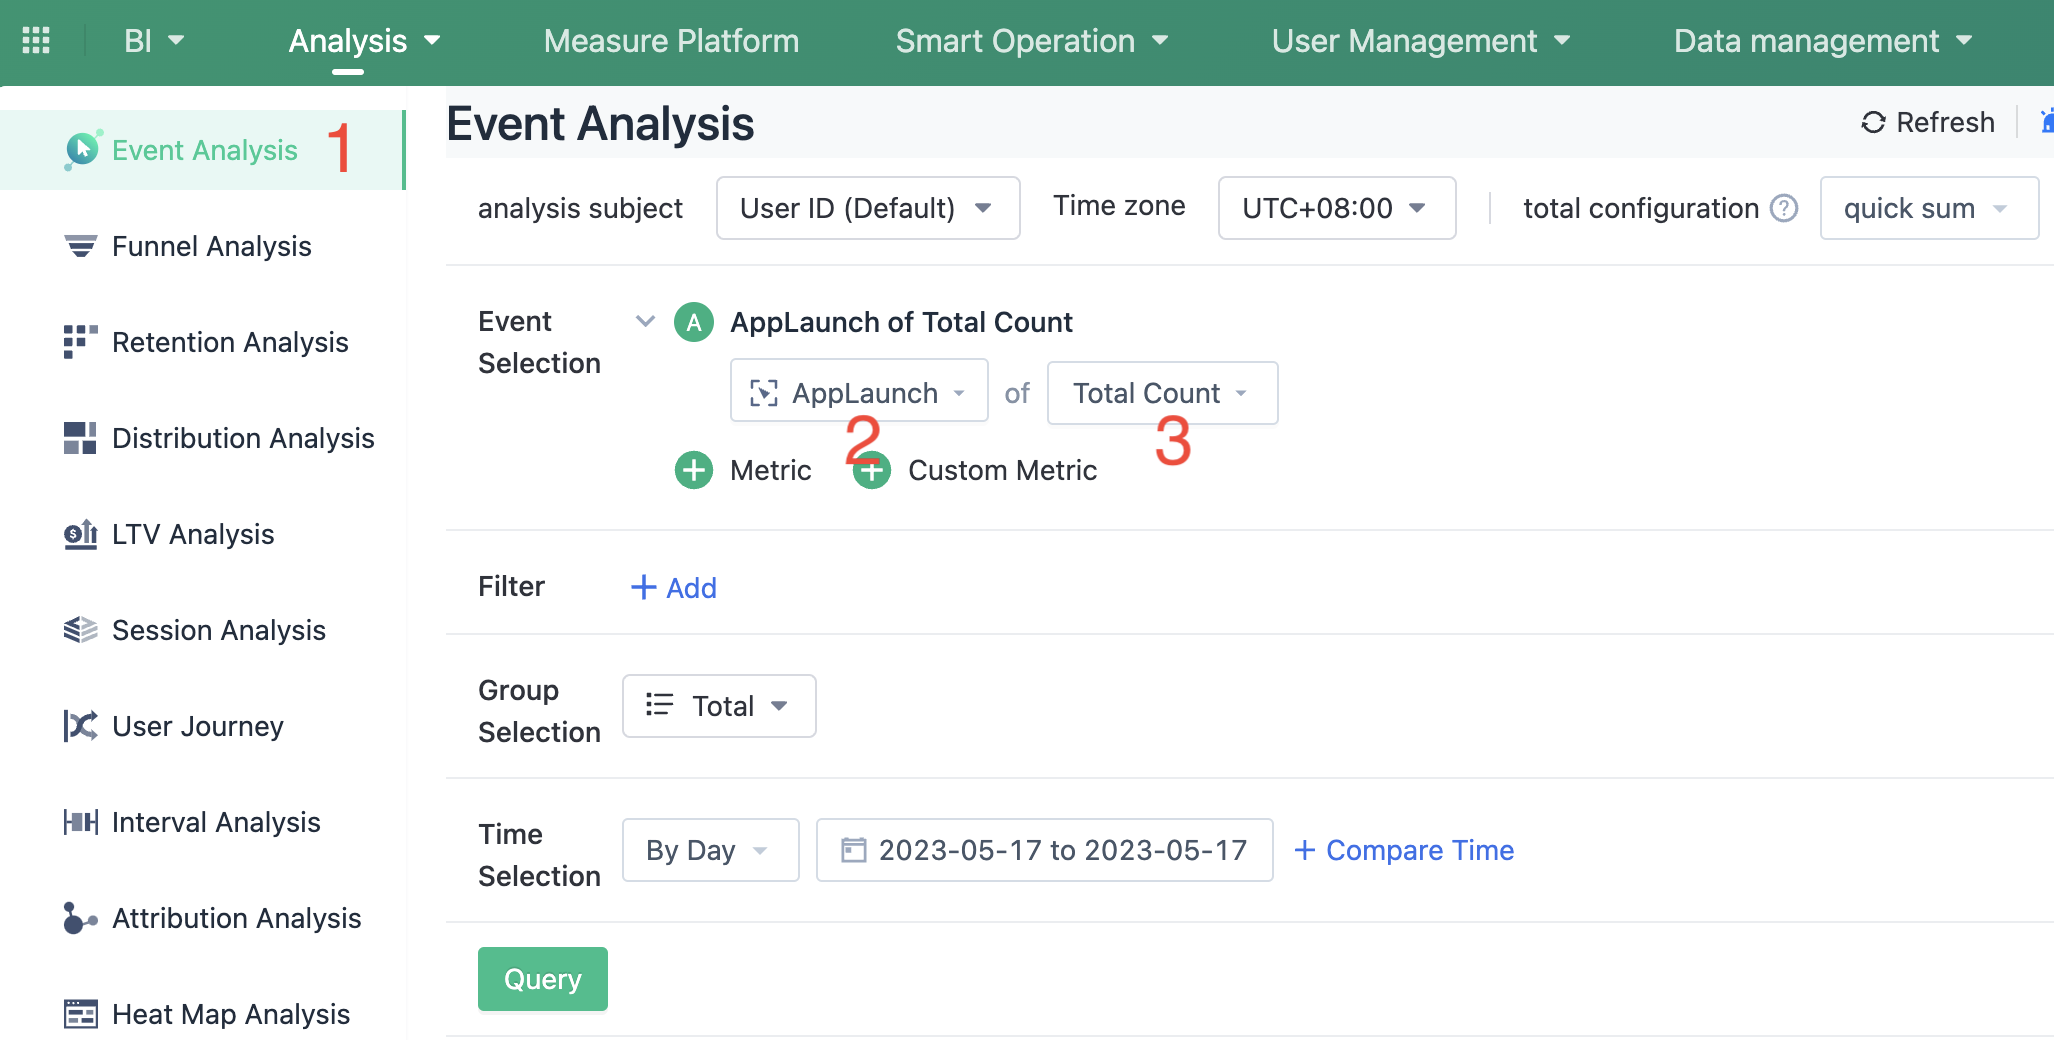
1.Click on the left-hand side event analysis function.
2. Select the event: App launch.
3. Select metric: Total Count.
10. New user retention on the Web
Definition: In the internet industry, users who start using an application within a certain period of time and continue to use it after a period of time are recognized as retained users. The proportion of these users to the number of new users at that time is the retention rate, which is calculated every 1 unit of time (e.g. day, week, month). Retention refers to "how many users stayed behind."
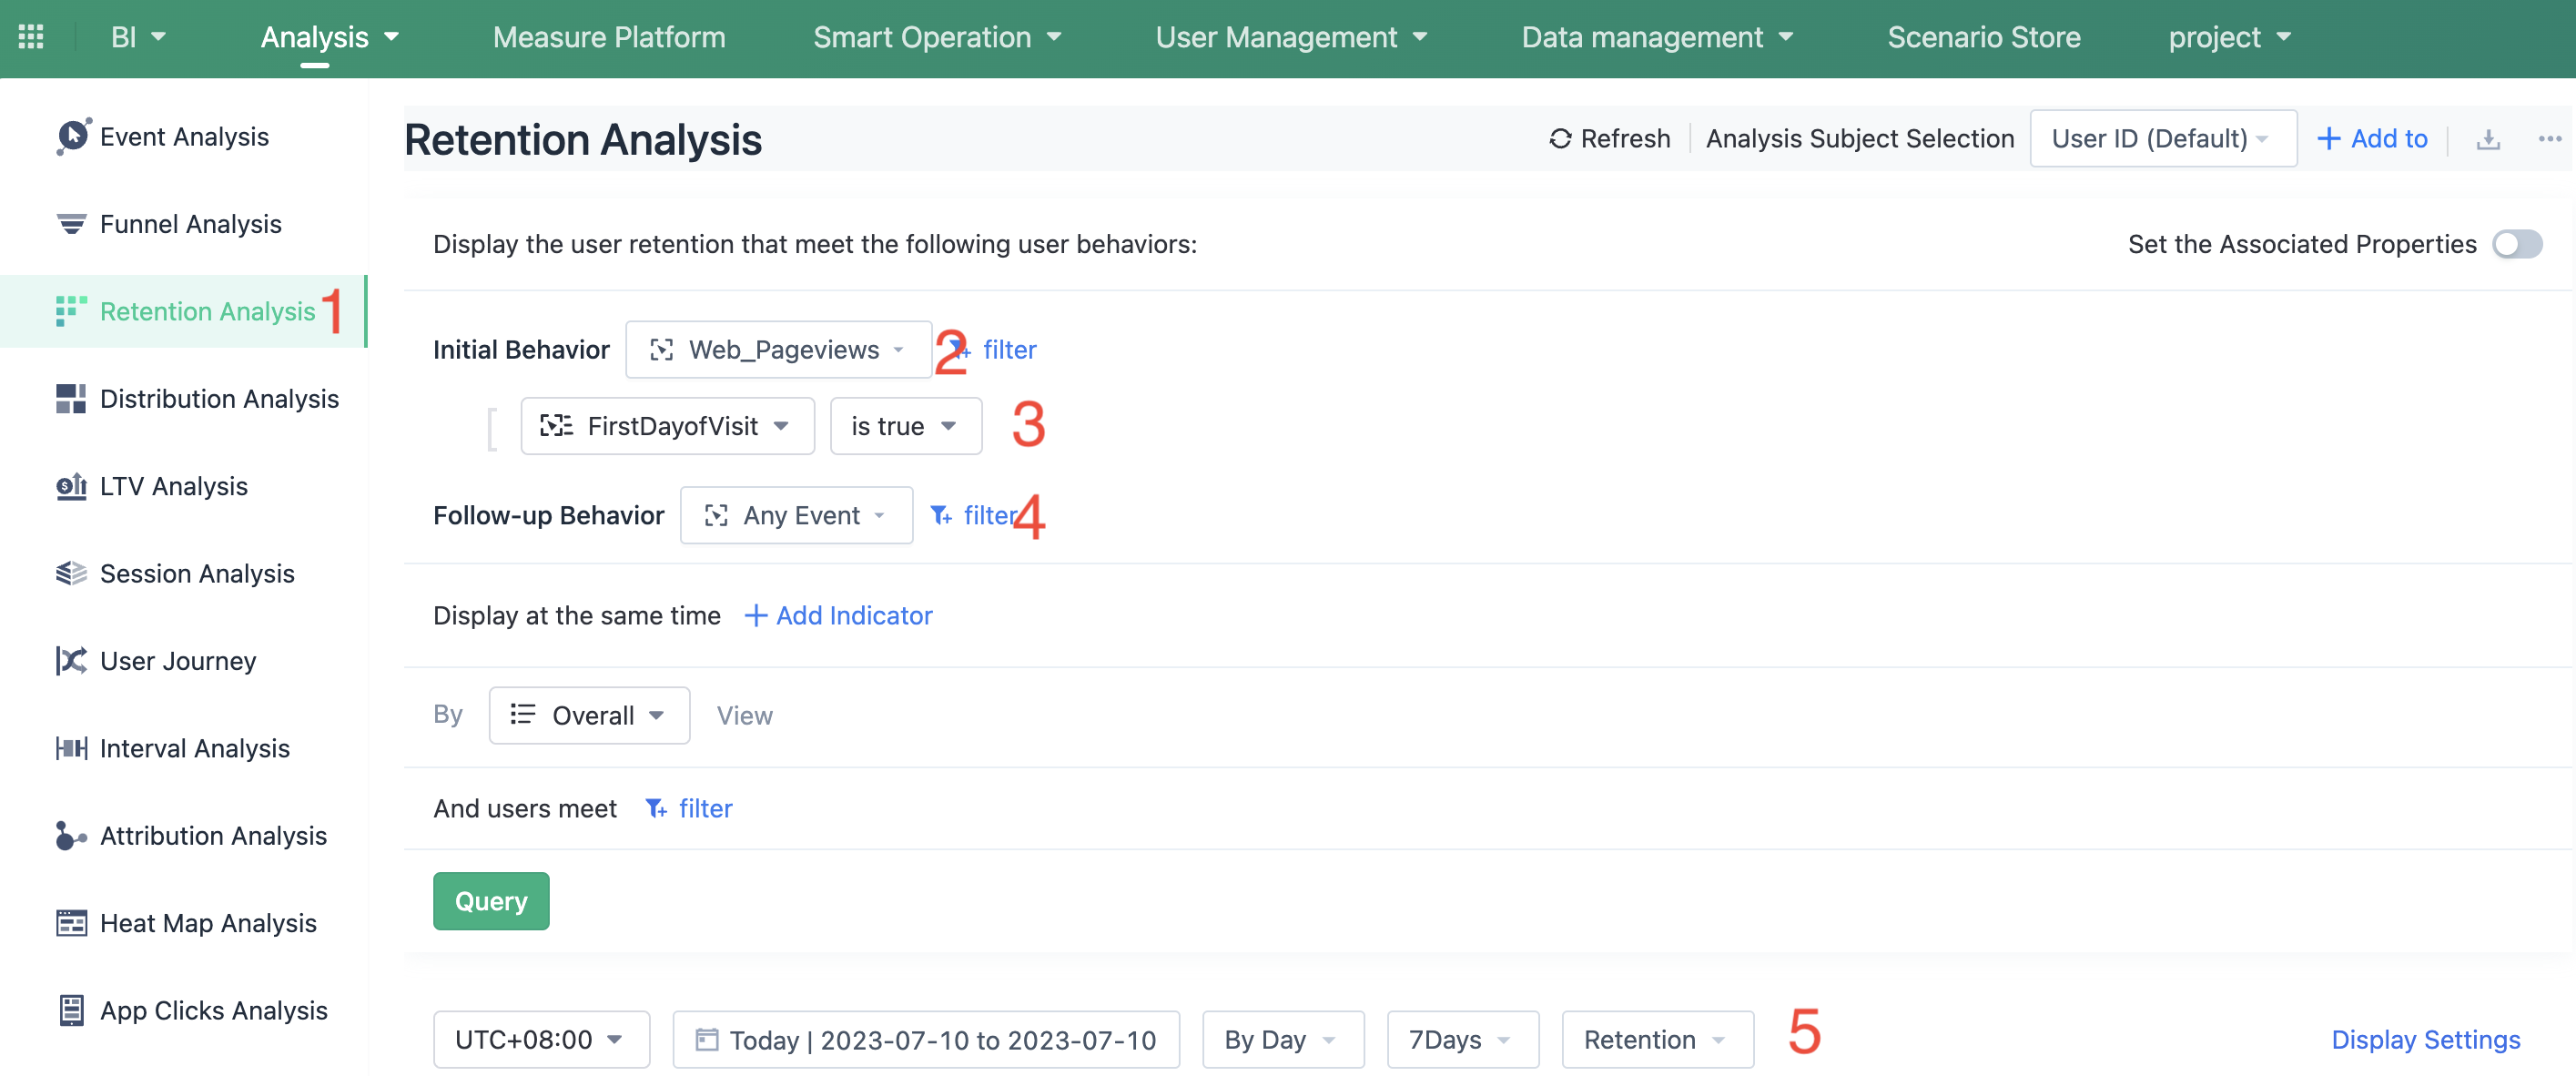
1. Select retention analysis function.
2. Initial behavior: select web Pageviews.
3. Add filter: first day of visit is true.
4. Follow-up behaviors: Select any event.
5. Choose day retention, week retention, or month retention.
11. New user retention on the App
Definition: In the internet industry, users who start using an application within a certain period of time and continue to use it after a period of time are recognized as retained users. The proportion of these users to the number of new users at that time is the retention rate, which is calculated every 1 unit of time (e.g. day, week, month). Retention refers to "how many users stayed behind."
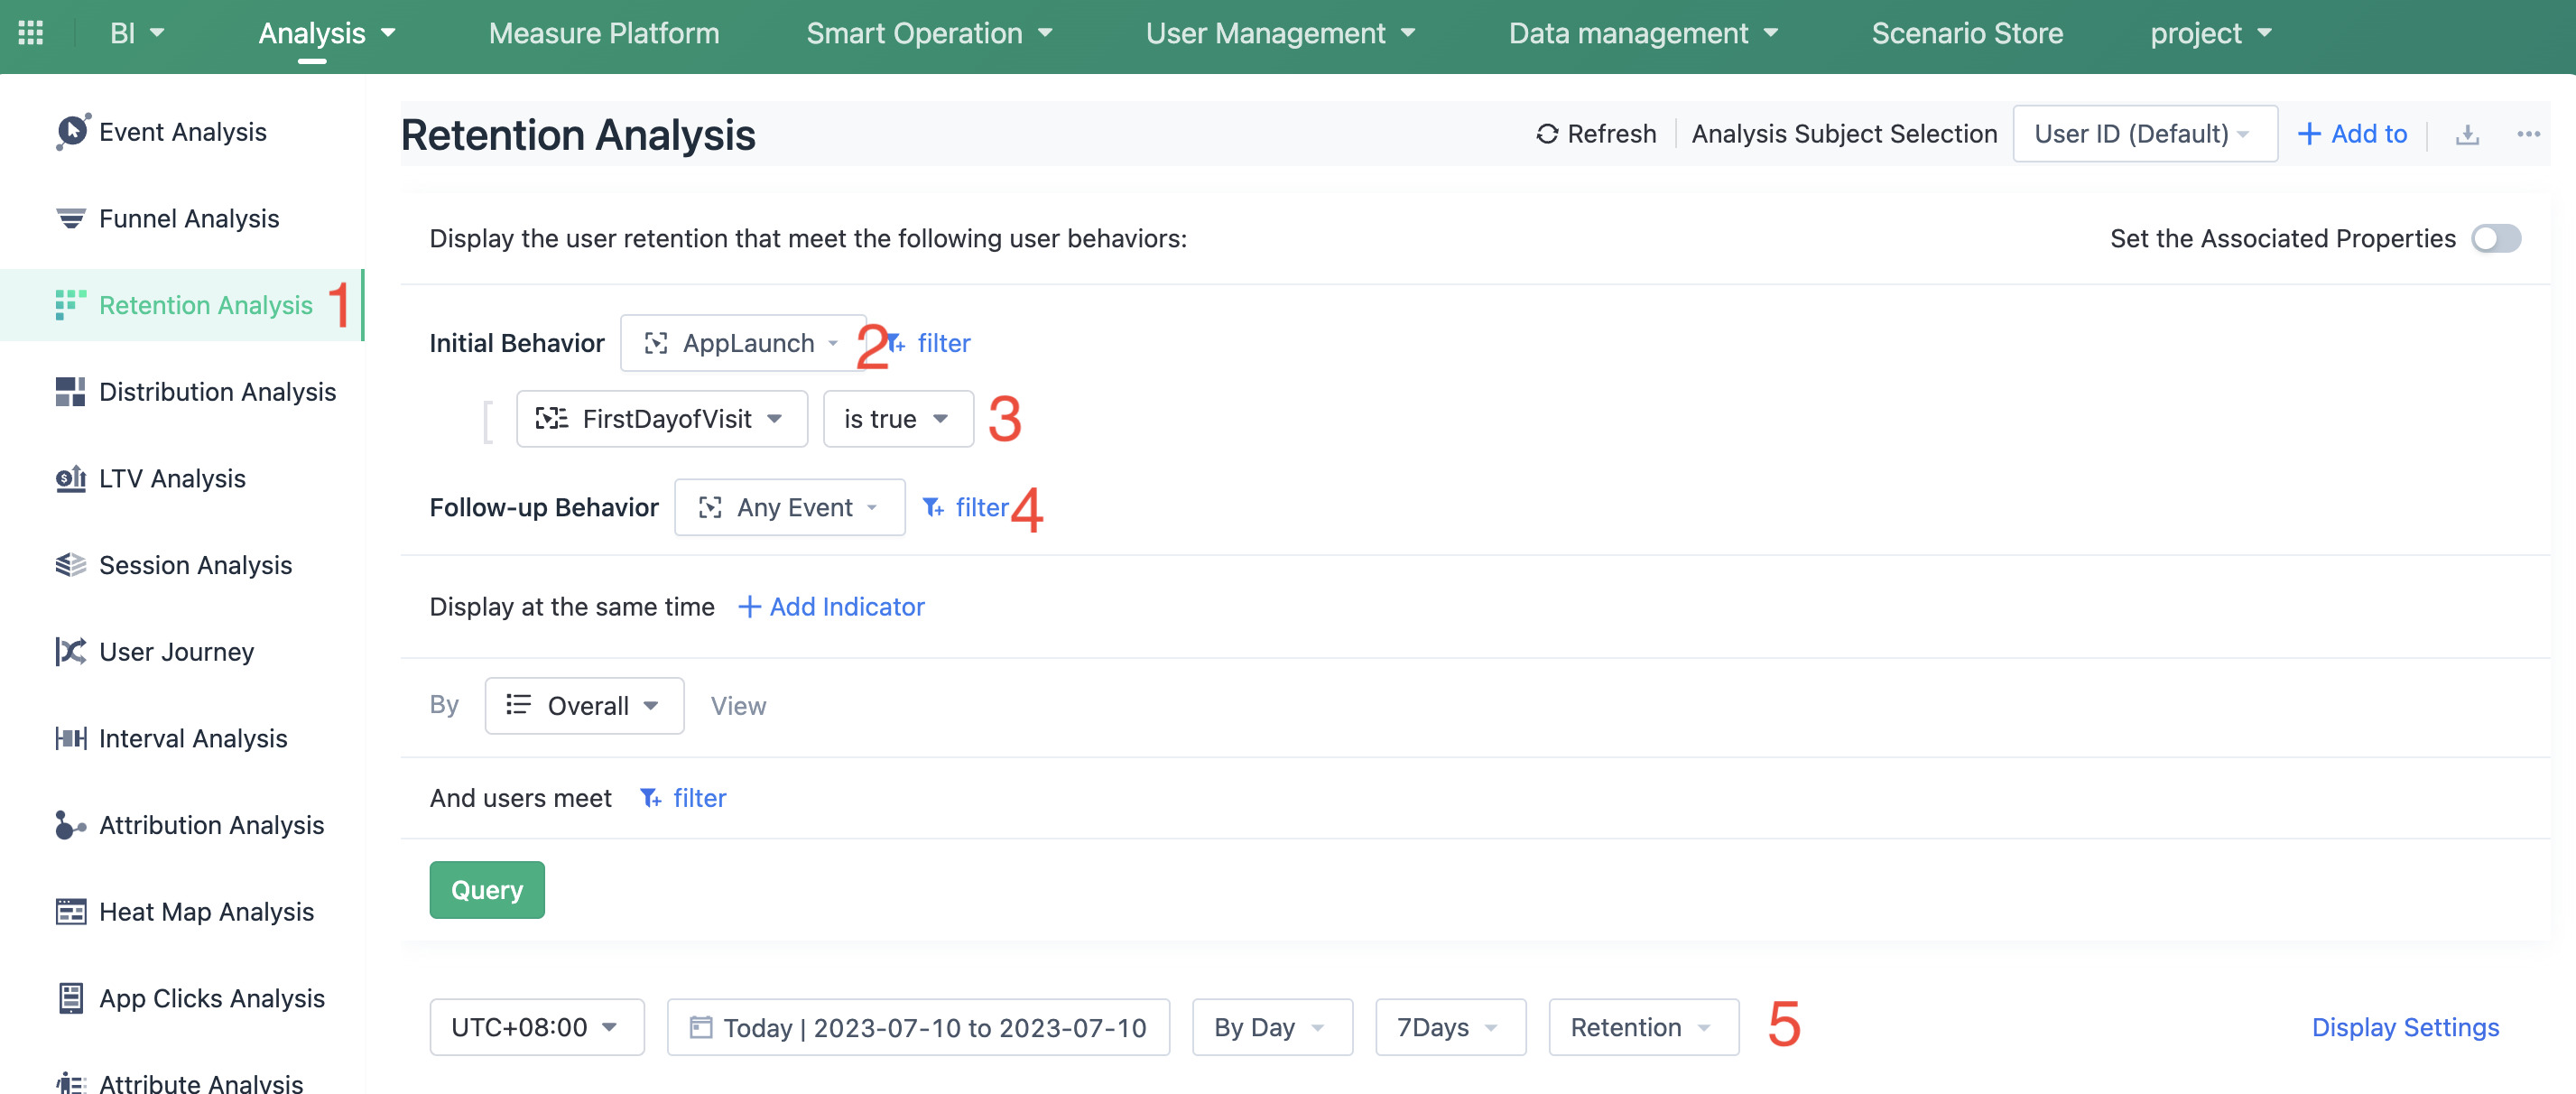
1. Select retention analysis function.
2. Initial behavior: select app launch.
3. Add filter: first-day of visit is true.
4. Follow-up behaviors: Select any event.
5. Choose day retention, week retention, or month retention.
12. Purchase conversion rate
Definition: Among the visitors of the day, what percentage of customers make purchases.
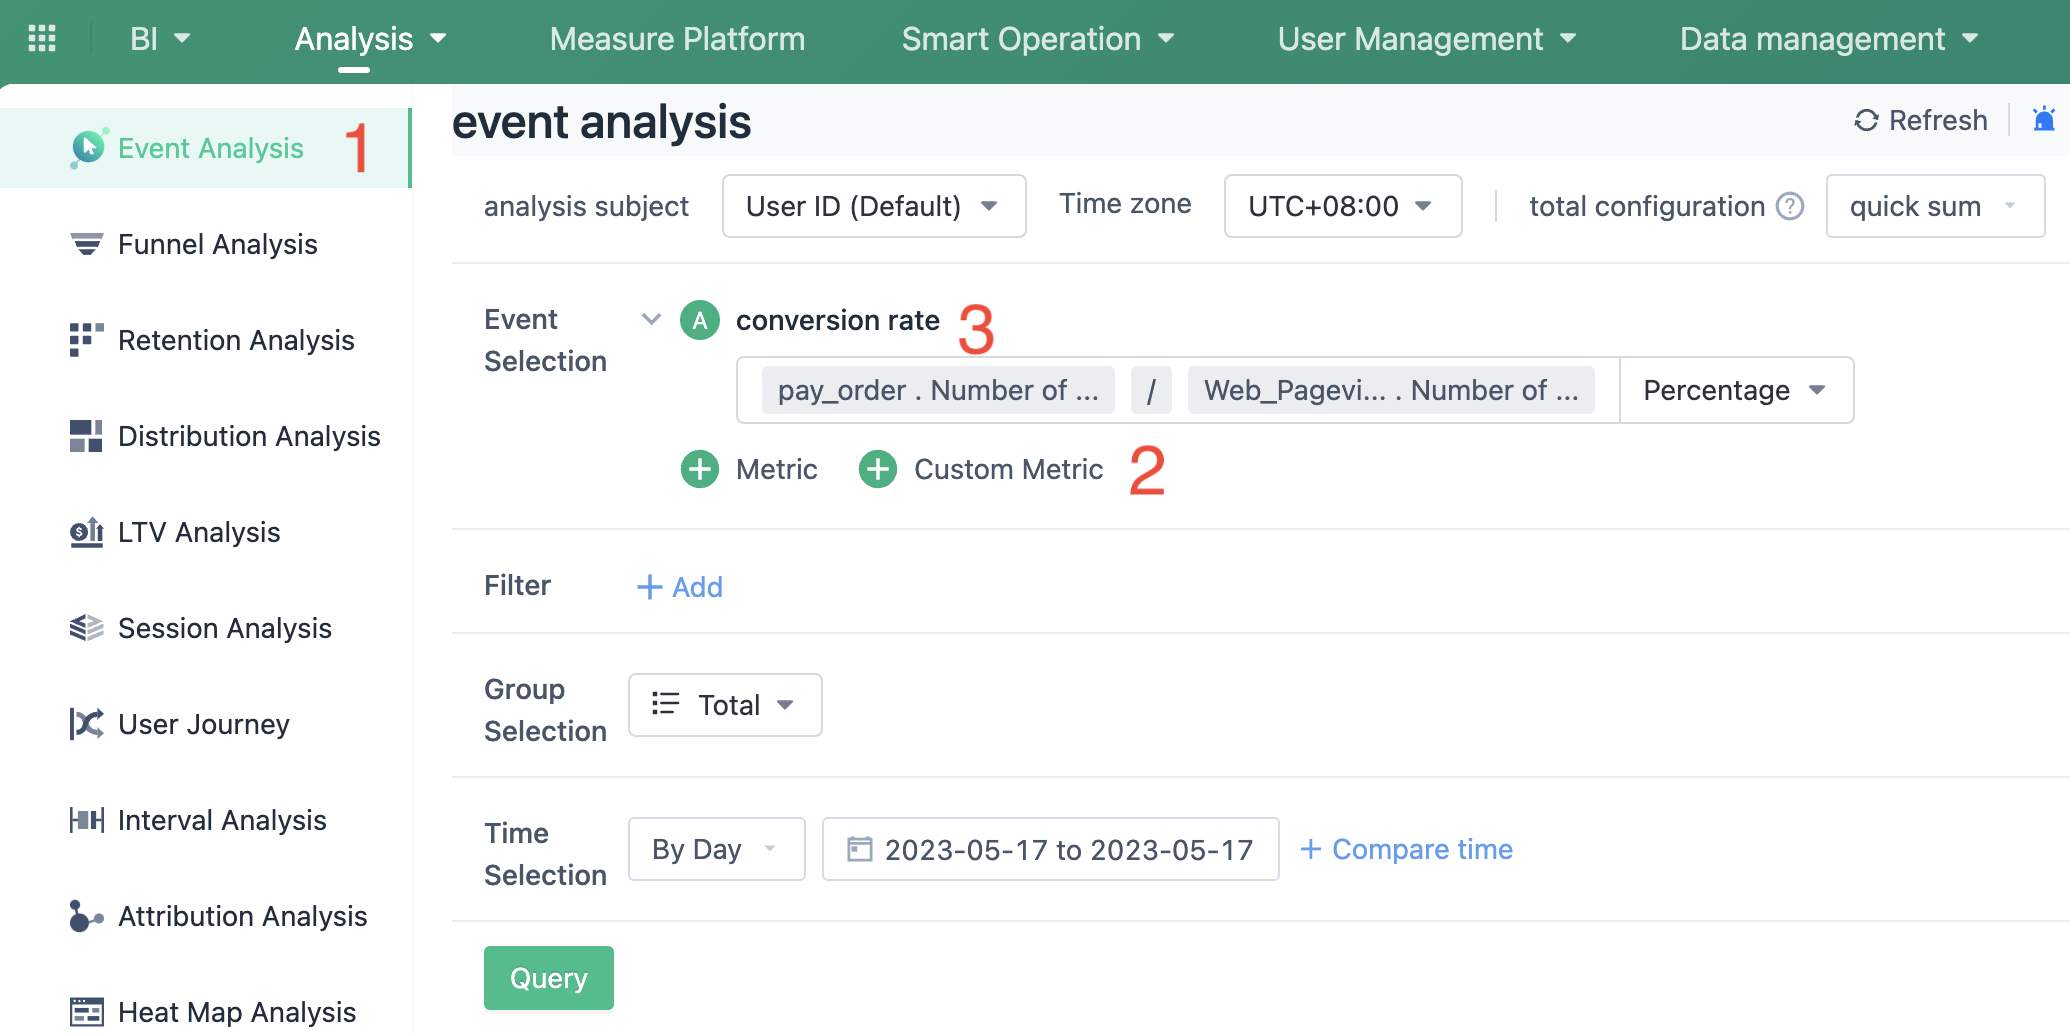
1. Click on the event analysis function on the left.
2. Click on "Add custom metric", input the formula "number of payment orders/number of users for web pageviews".
3. Name it "Conversion rate".
4. Finally, click "Save".
The following metrics "Visits, Average Interaction Depth, Average Session Duration, Average Time on Page, Bounce Rate, Exit Rate" need session data to be analyzed.
Session refers to a series of interactions that occur on your website during a specified period of time. For example, a session may include multiple page or screen views, events, social interactions, and e-commerce transactions.
We need to create a session first.
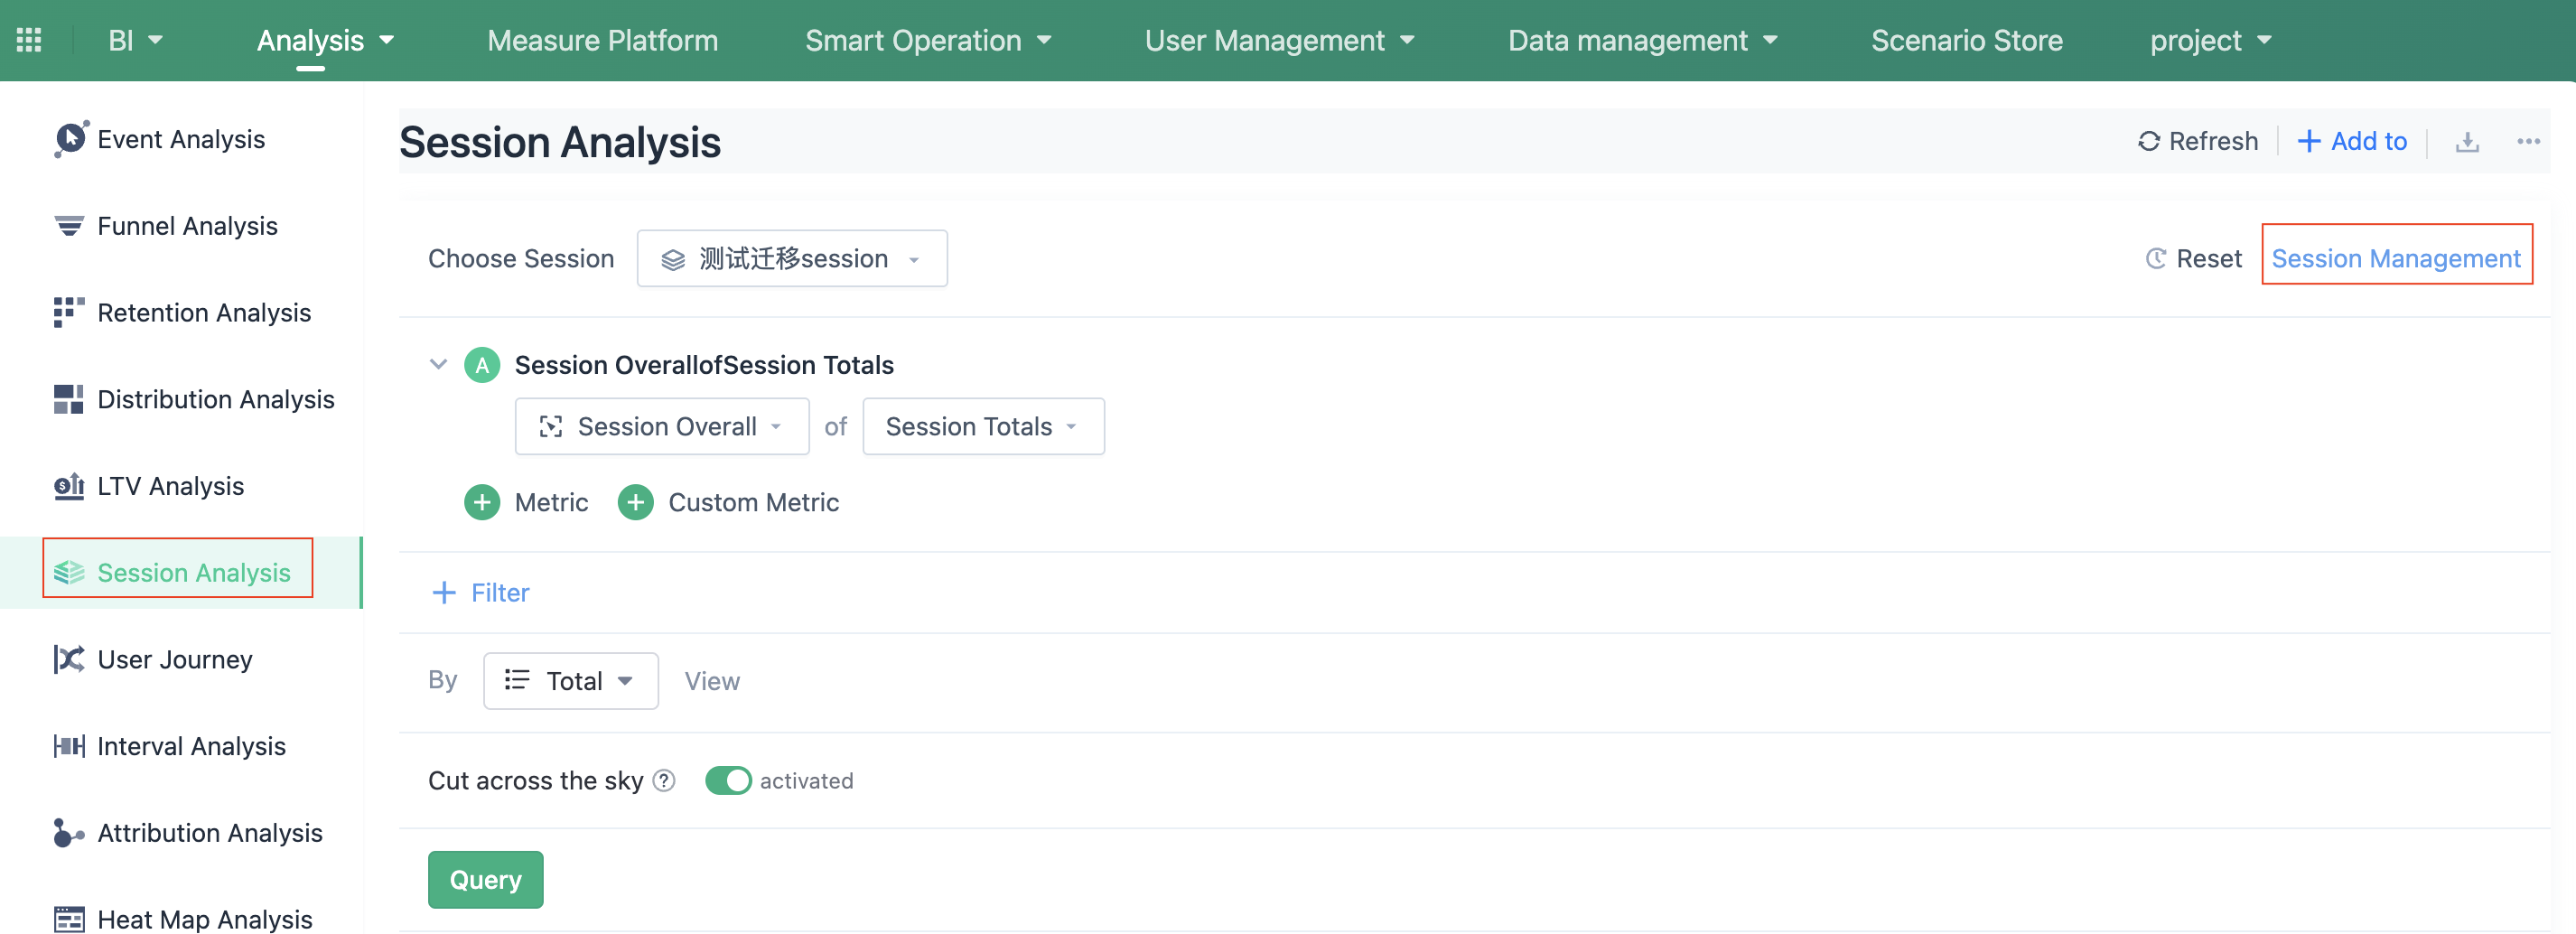

1. Click on "session analysis" on the webpage.
2. Click on "Session Management".
3. Click on "Create Session".
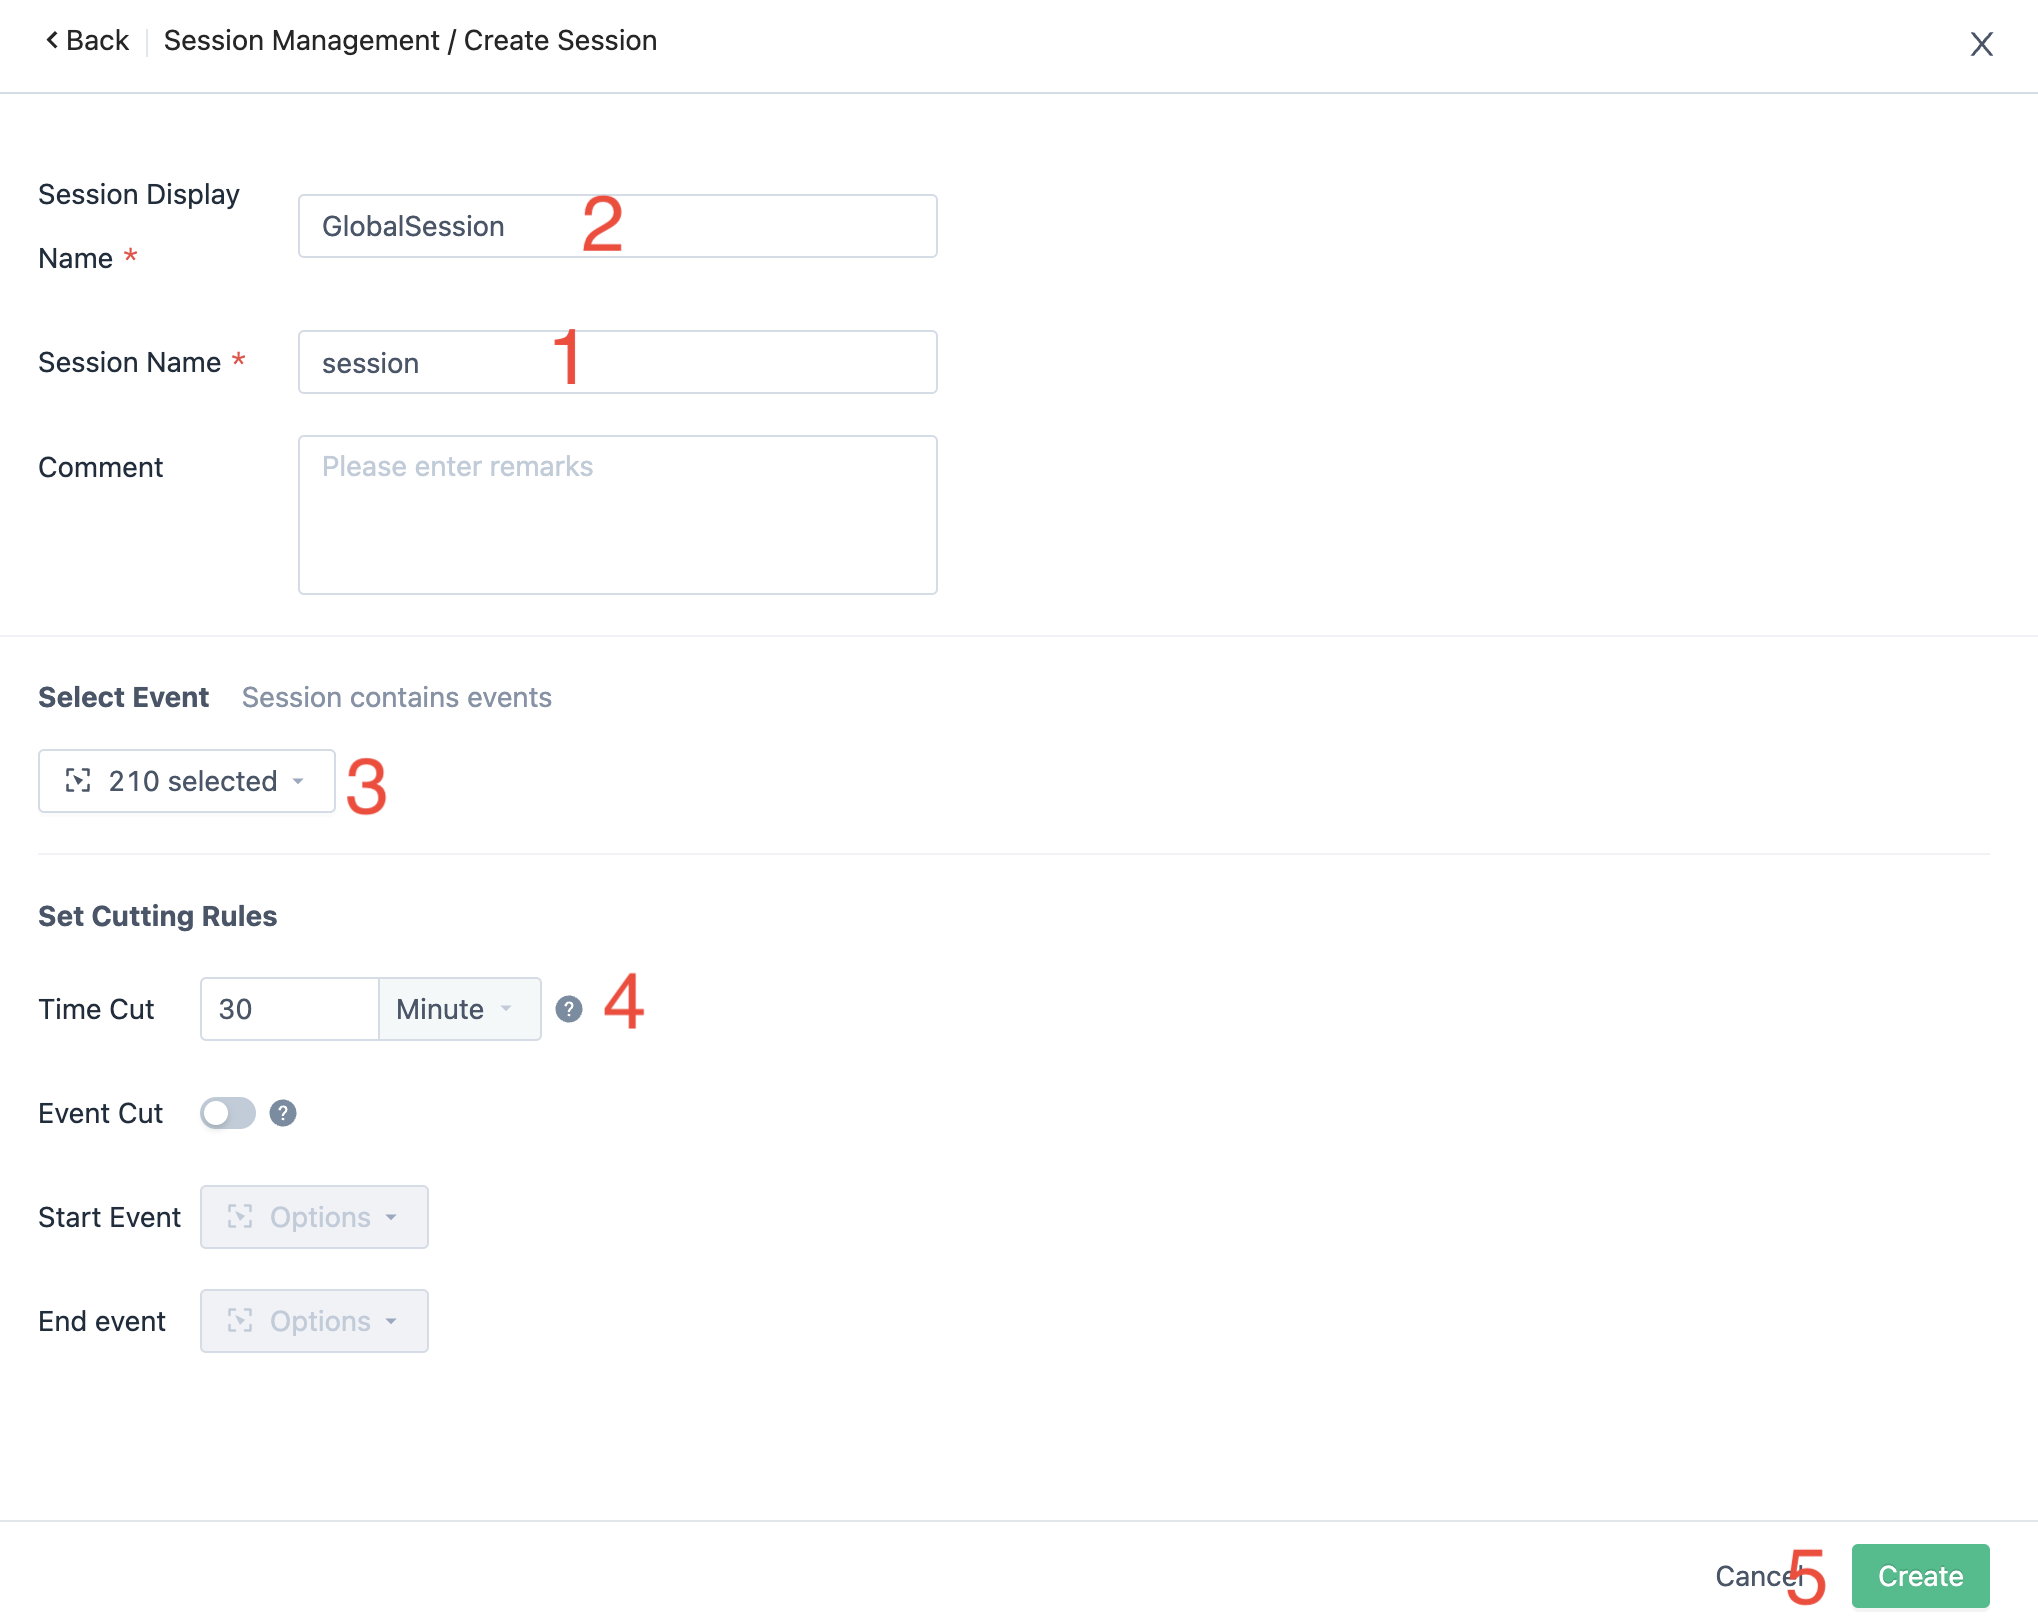
1. Enter Session name as session.
2. Enter Session display name as Global Session.
3. Select events: Choose all the events that should be included in the Session.
4. Set the splitting rule to 30 minutes.
5. Click the Save button to create the Session successfully.
The recommended session cut-off time for web-based products is usually 30 minutes, while for app-based products it is recommended to be 1 minute.
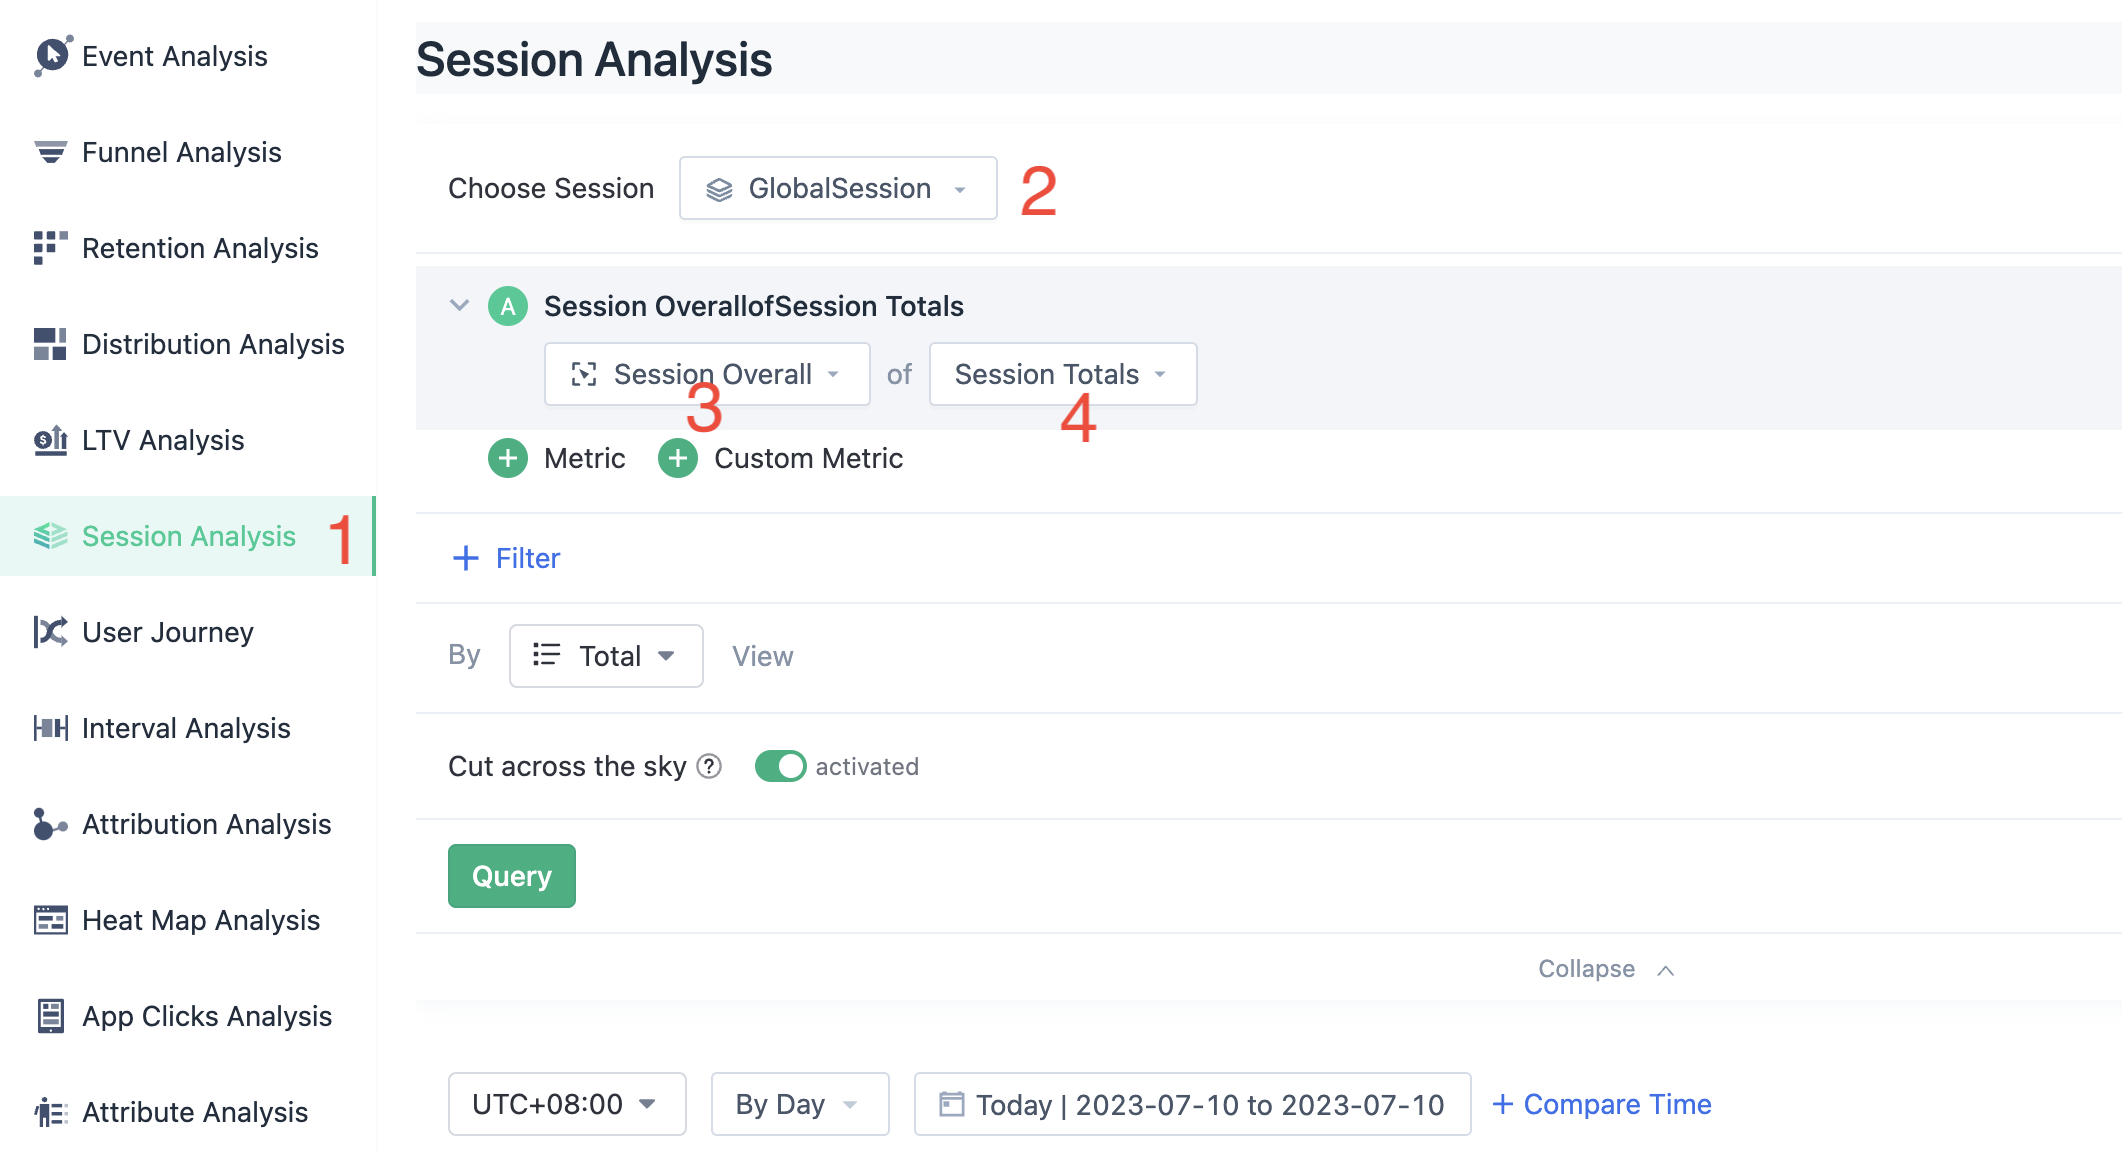
1. Go back to the Session Analysis page.
2. Select "GlobalSession" .
Once you have switched the analysis rule to Session, you can perform the Session analysis and calculate the specified metrics.
13. visit numbers
Definition: A series of activities by visitors from entering and leaving the website/App is recorded as one visit, also known as a session.
1. Go back to the Session Analysis page.
2. Select Sessions: Global Session.
3. Select Session Overview.
4. Select indicators: Sessions Totals.
14. Average interaction depth
Definition: Equal to the total number of sessions divided by the total number of sessions.
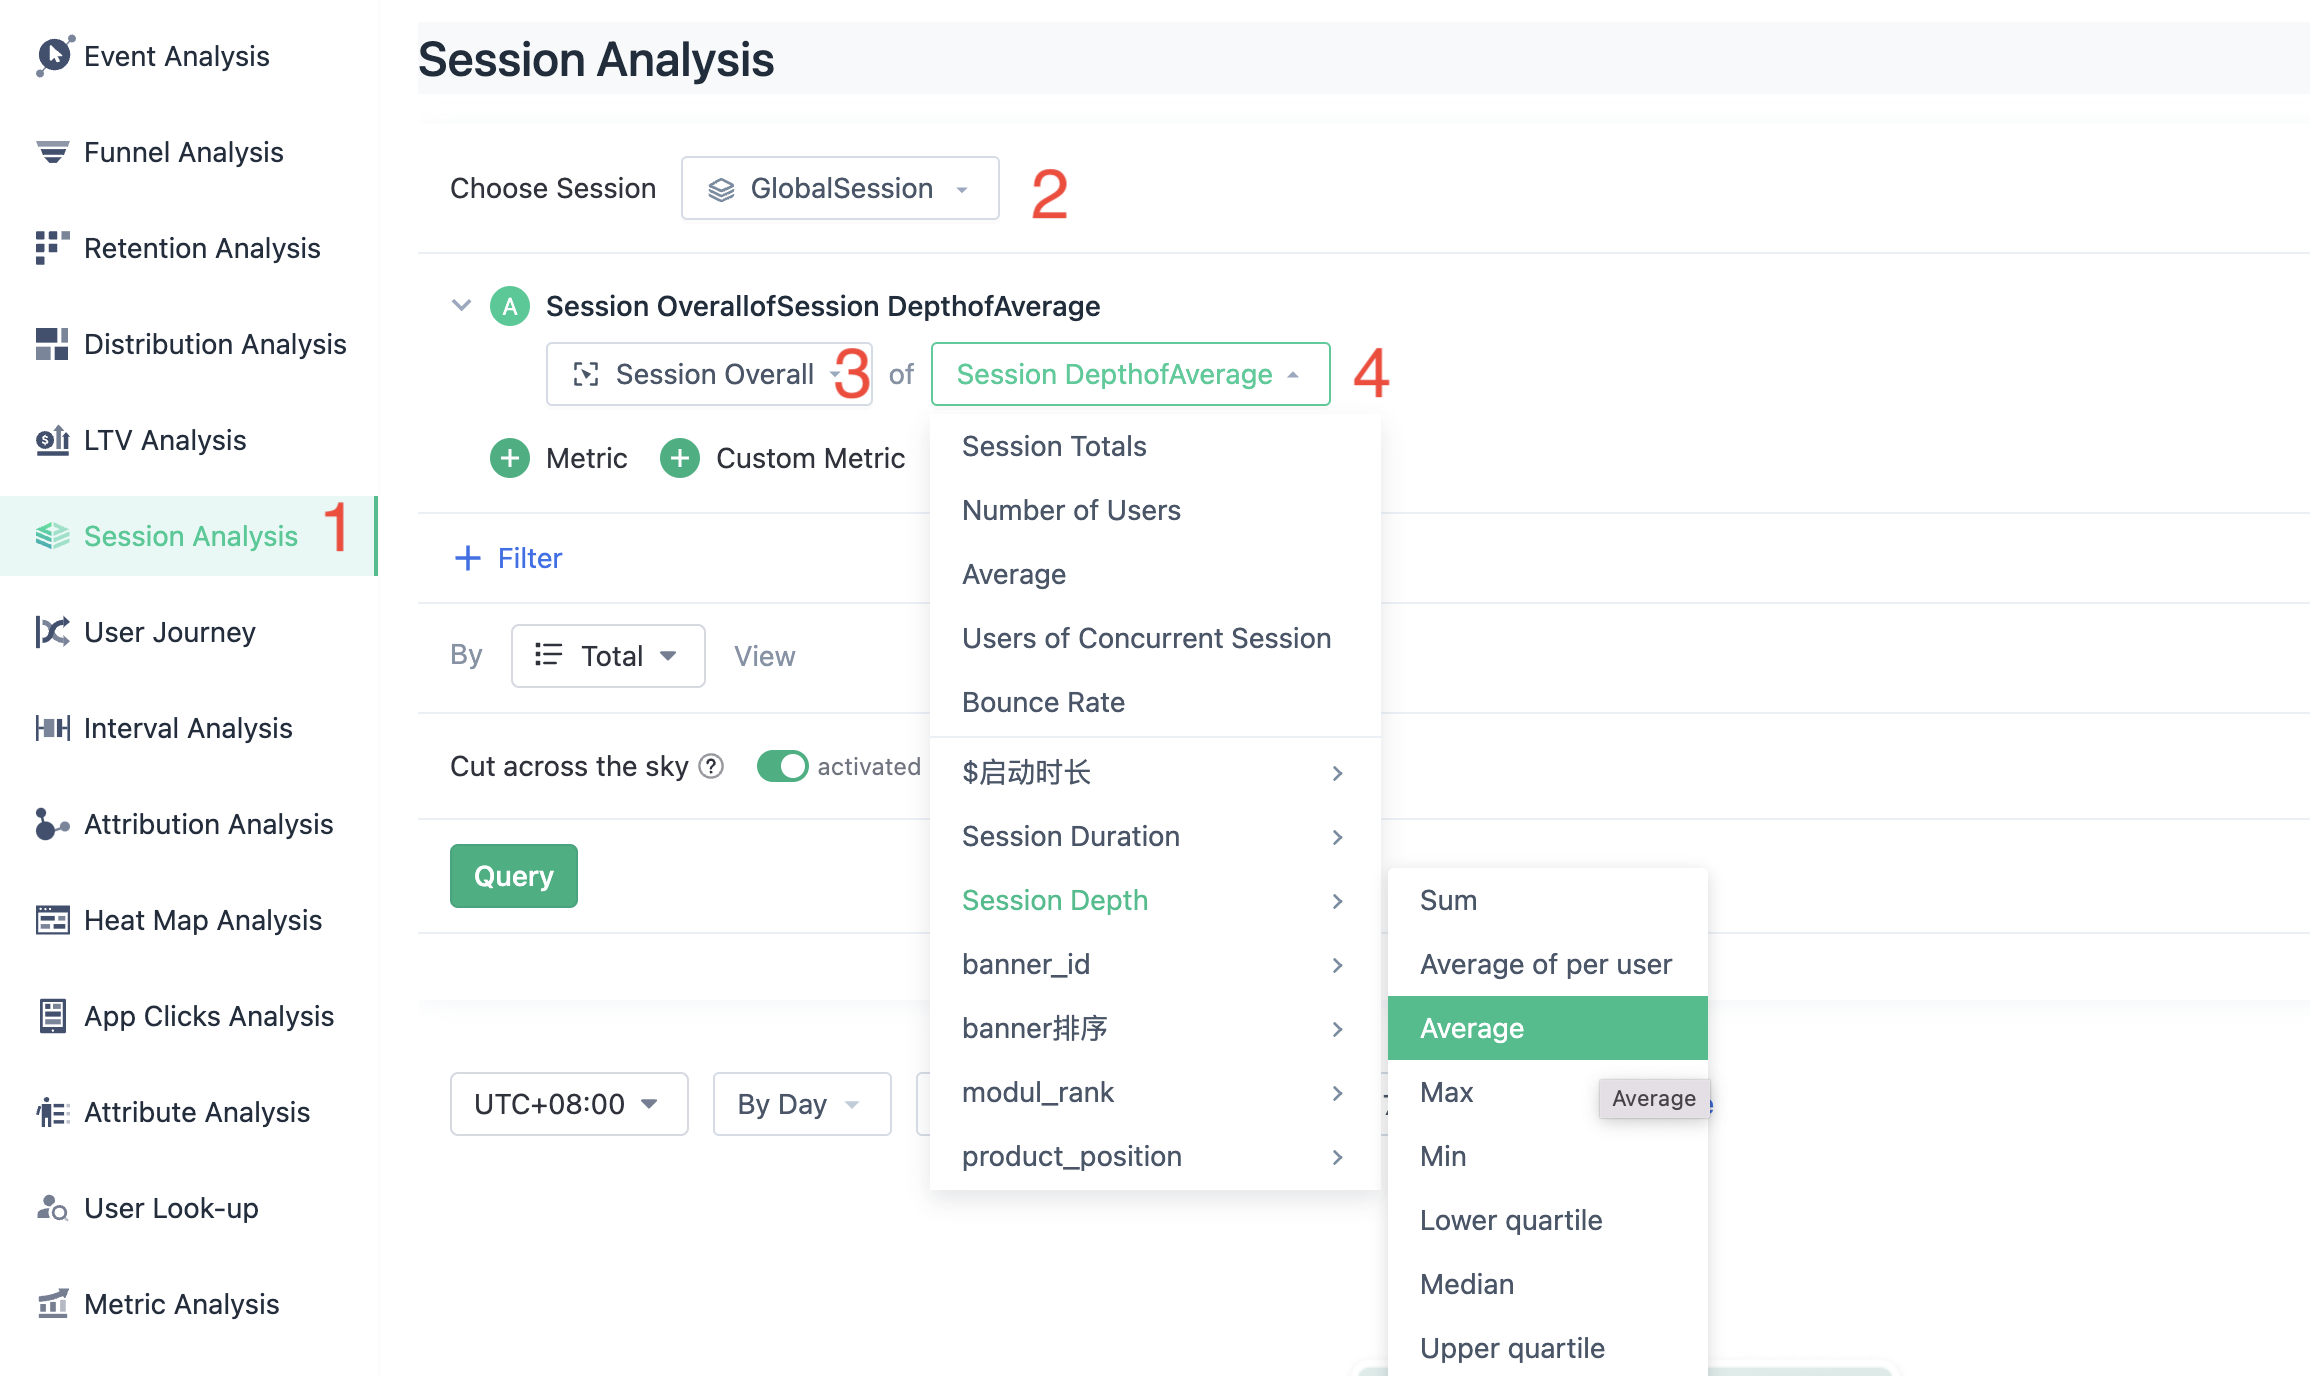
1. Select Session Analysis.
2. Select Session: GlobalSession.
3. Select Session Overall.
4. Select the metric: the average of Session Depth.
15. Average Session Duration.
Definition: It is equal to the sum of session duration of all users divided by the number of sessions.
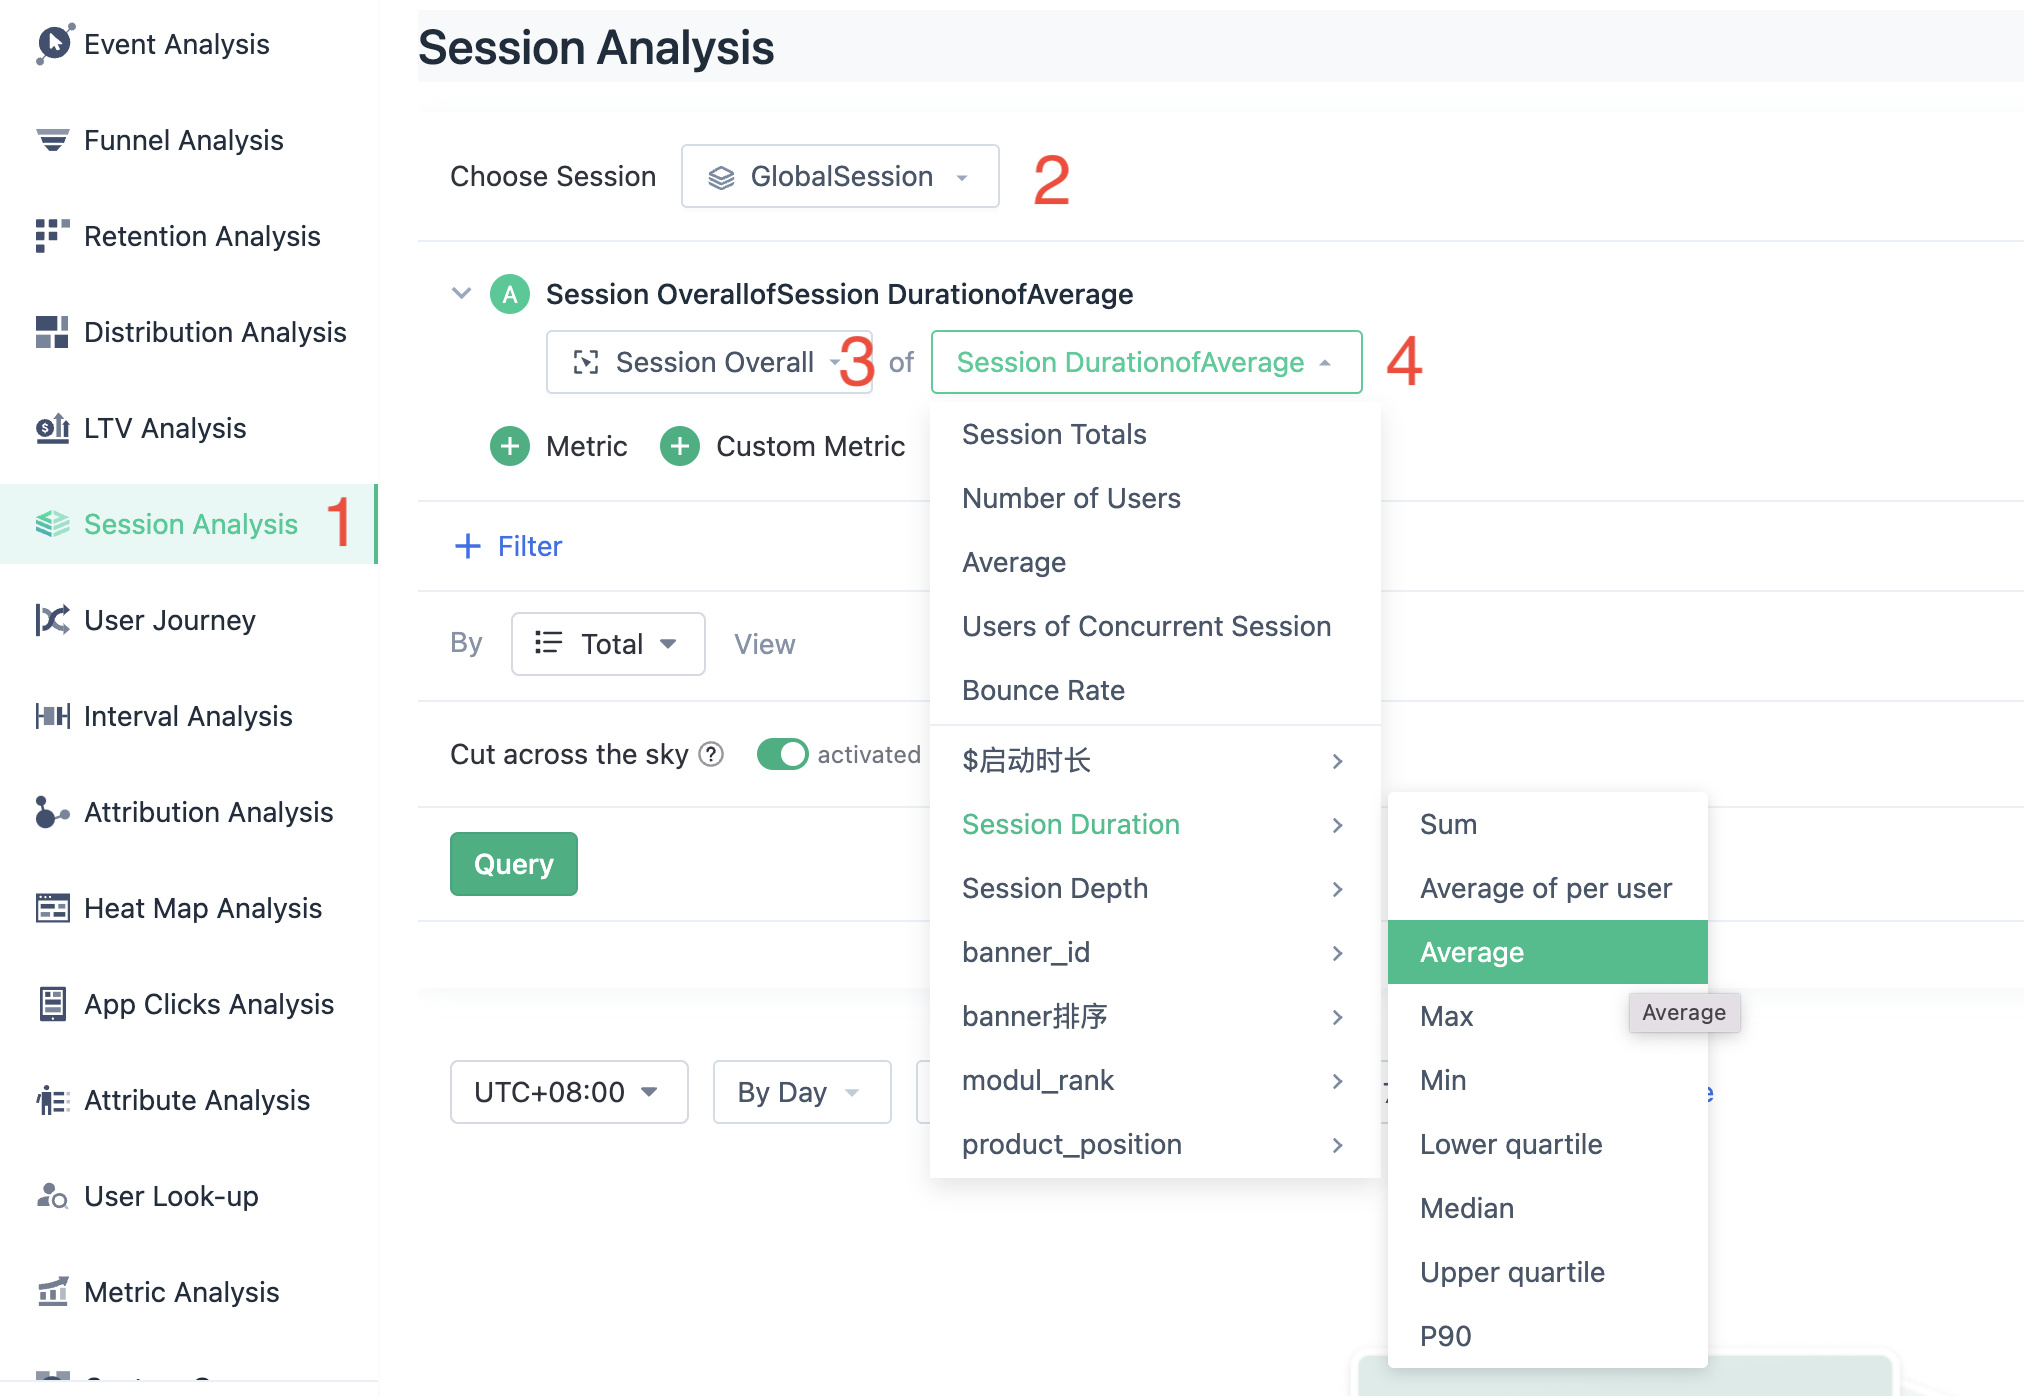
1. Select Session Analysis.
2. Select Session: GlobalSession.
3. Select Session Overall.
4. Select the metric: the average of Session Duration.
16. Average page stay time
Definition: equal to the sum of the total time spent on a page divided by the number of times the page was triggered.
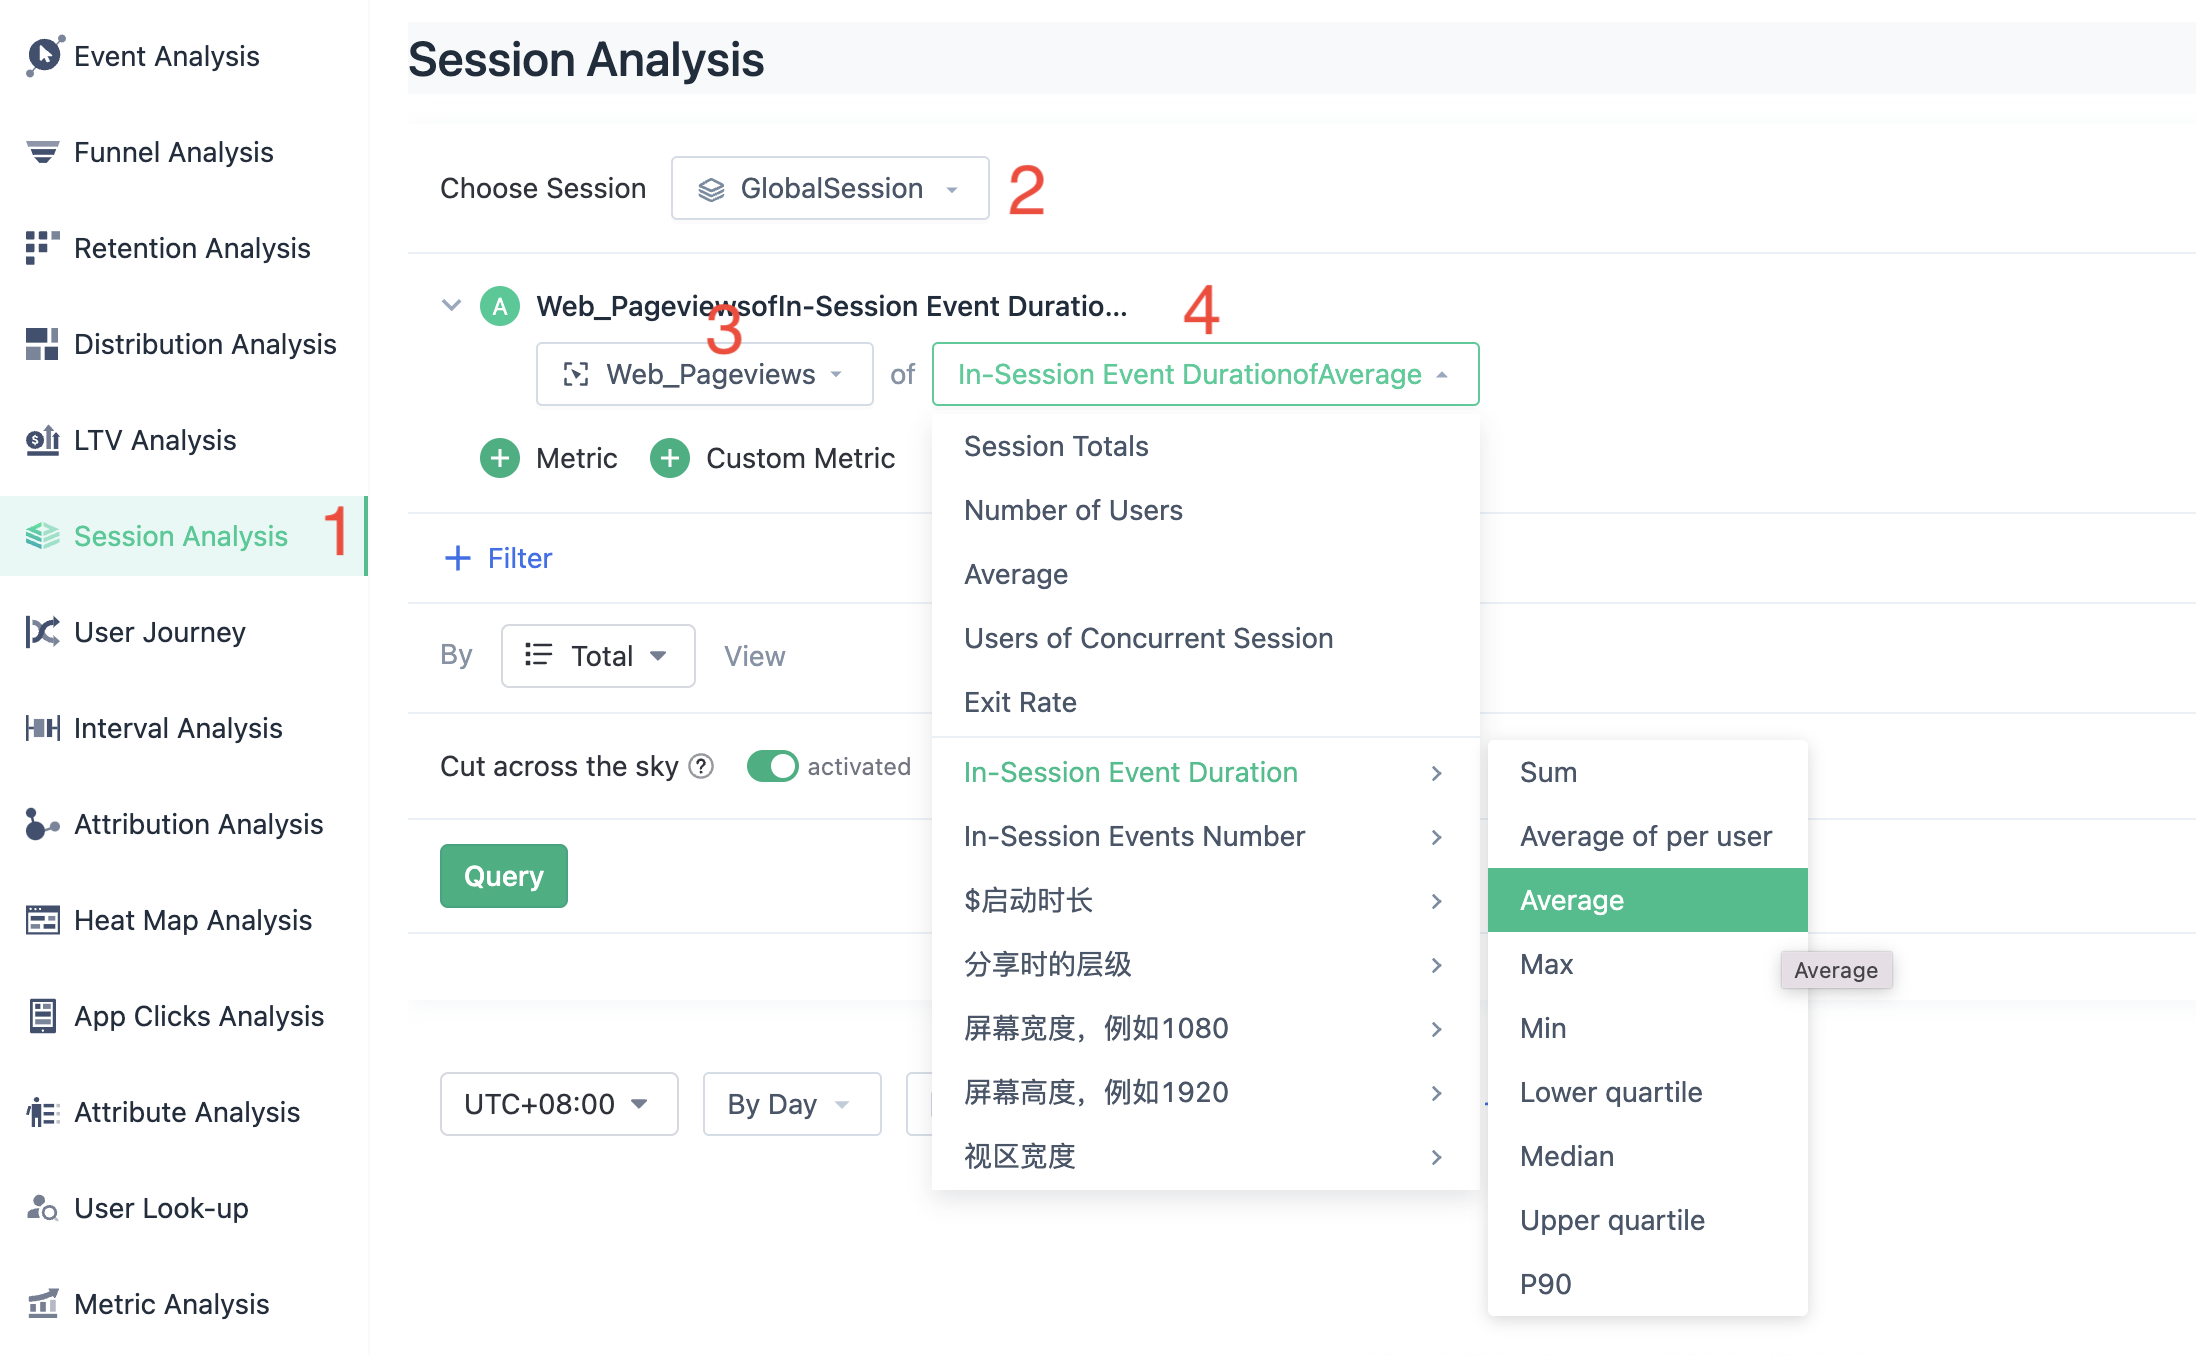
1. Select Session Analysis.
2. Select Session: GlobalSession.
3. Select Event Inside Session: Web Pageview.
4. Select Metric: the average of Duration of Events In-Session.
17. Bounce rate
Definition: When a Session only has one event, it is considered a bounce, usually this event is browsing a webpage. The overall bounce rate of a Session is equal to the number of Sessions that bounced divided by the total number of Sessions. The bounce rate of a page, which can be viewed by Session attributes, is equal to the total number of Sessions that started with browsing that page and bounced divided by the total number of Sessions that started with browsing that page.
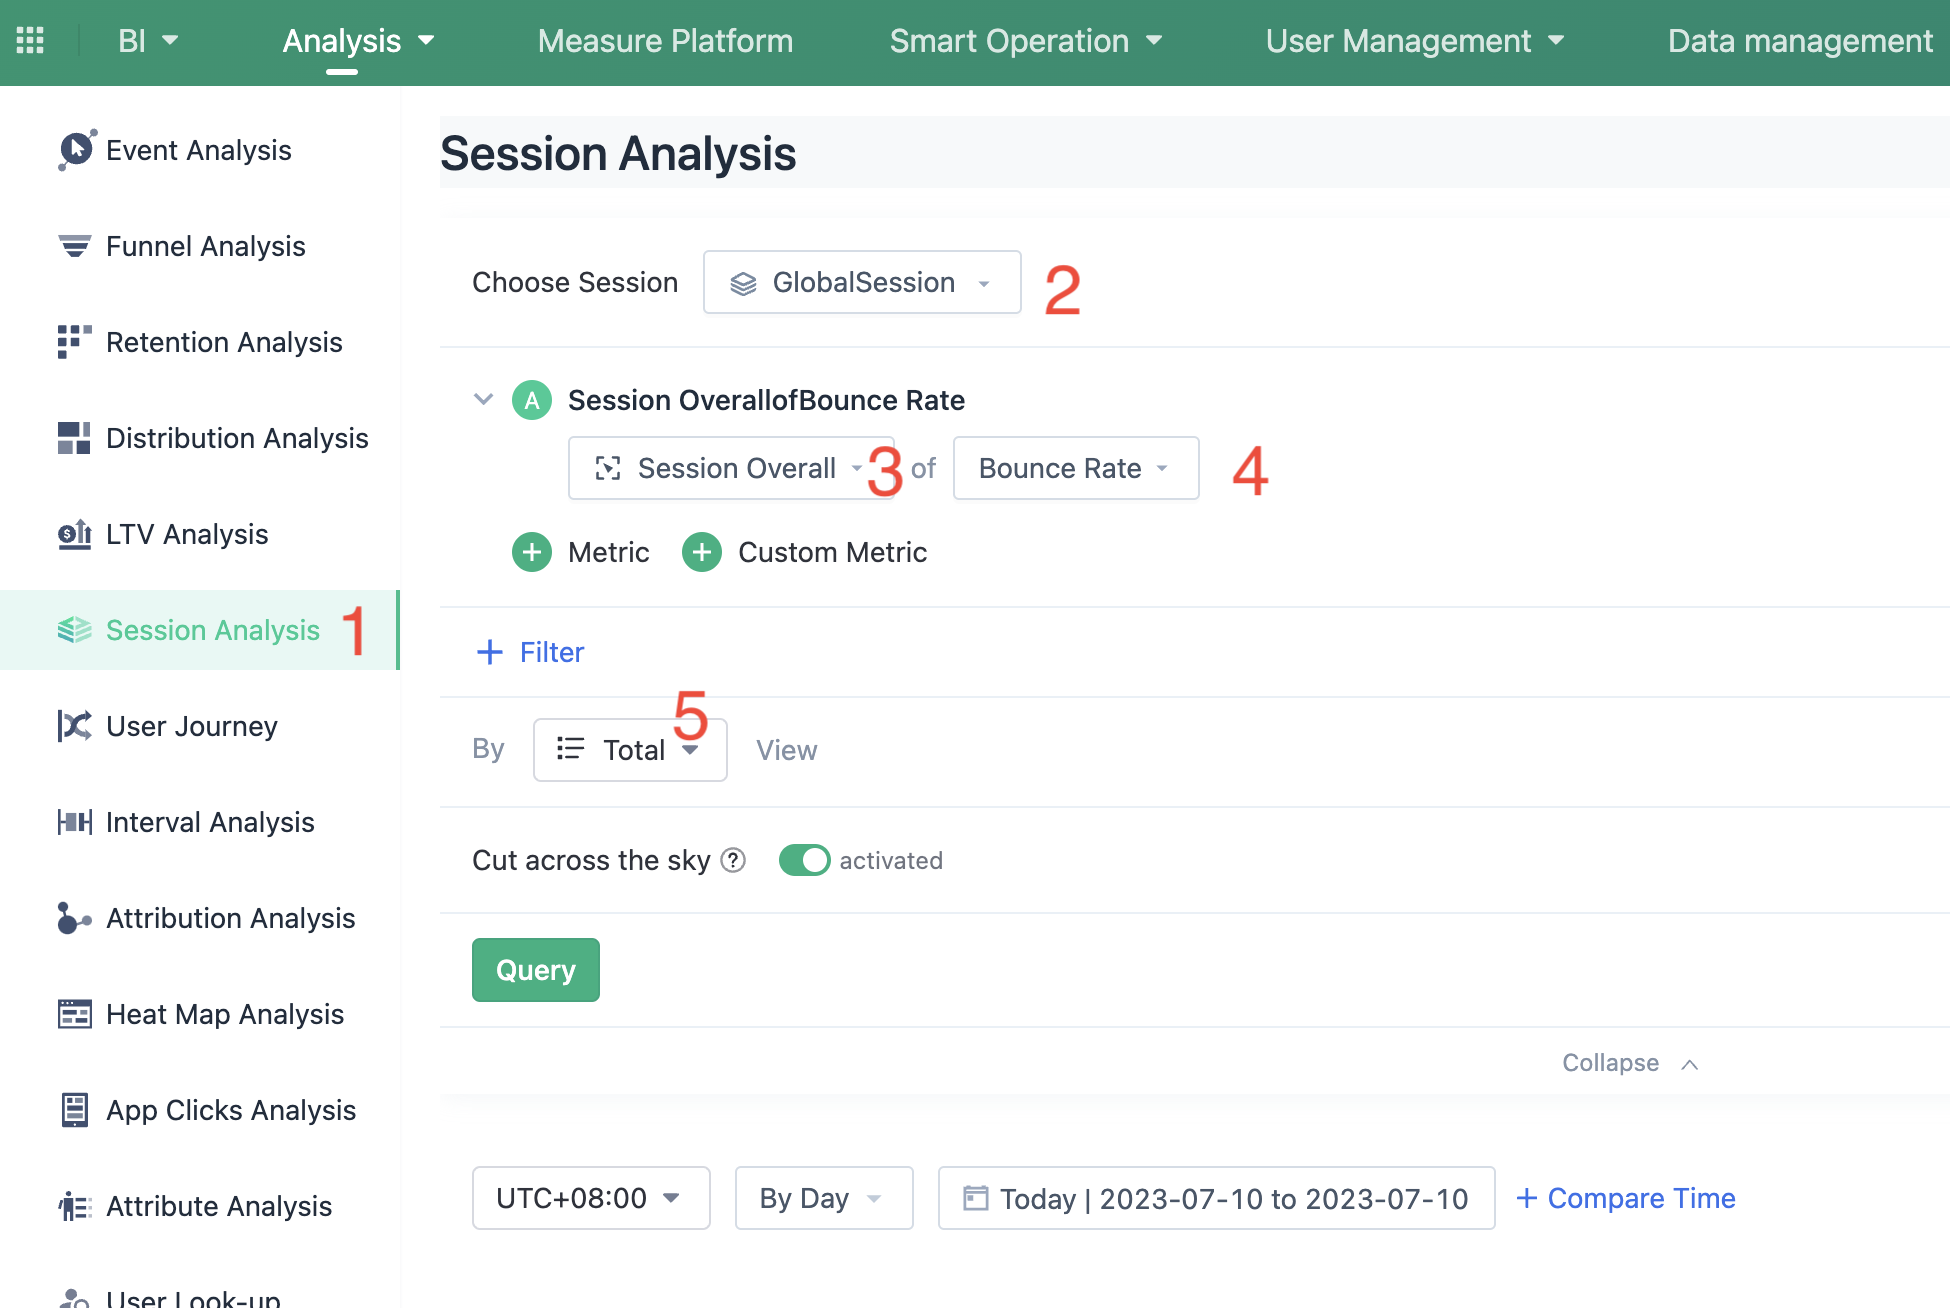
1. Select Session Analysis.
2. Select Session: GlobalSession.
3. Select Session Overall.
4. Select metric: Bounce rate.
5. Viewing "Total" shows the website's overall bounce rate, while viewing by "URL" (Session Property) shows the bounce rate for individual pages.
18. Page Exit Rate
Definition: When a user ends the session on a certain page, it is considered as an exit. Therefore, the page exit rate is calculated by dividing the number of exits from a page by its total number of pageviews.
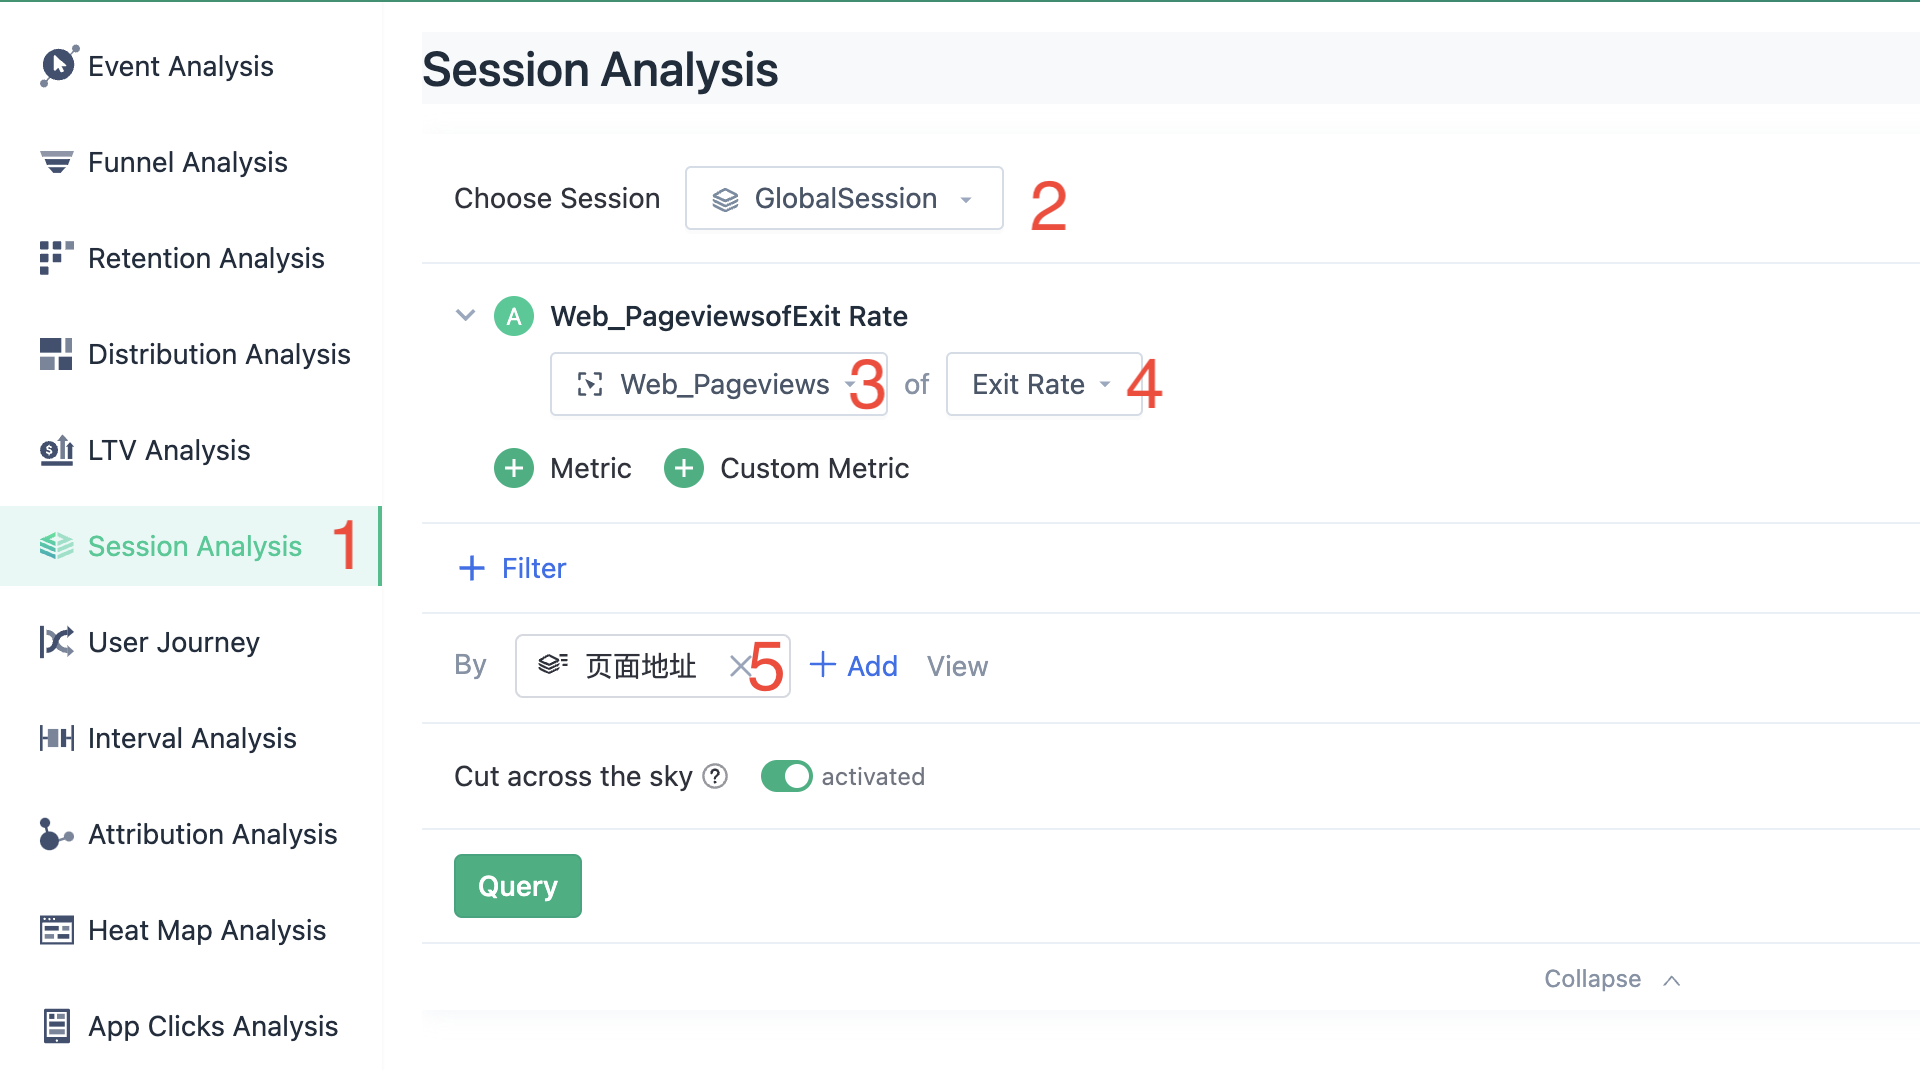
1. Select Session Analysis.
2. Select Session: GlobalSession.
3. Choose specific event within the session: web Pageview.
4. Select the metric: exit rate.
5. Choose attribute grouping: web page URL.
19. How to create a purchase conversion funnel
We can assume a scenario where users go through a process from seeing a promotional activity to final purchase such as "browse activity page - browse product list page - browse product details page - add to cart - submit order - pay order". We can establish a purchase conversion funnel for such a process to help you analyze the conversion and churn of each step in a multi-step process.
Create Funnel
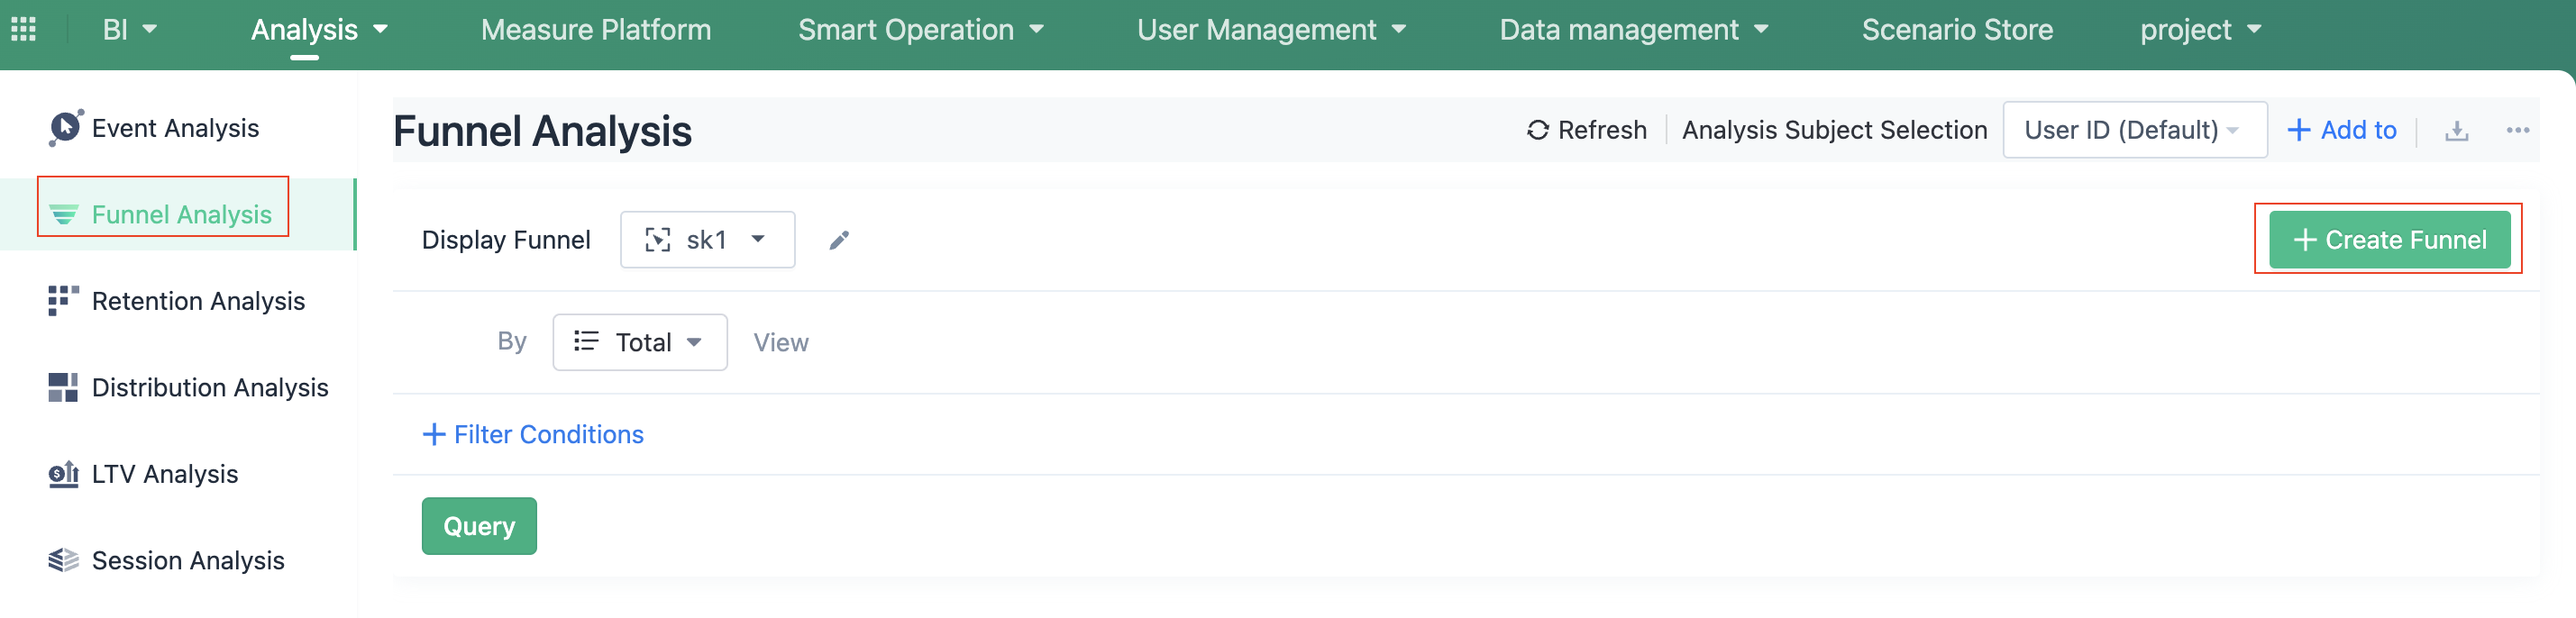
1. Click on the Funnel Analysis function on the left side.
2. Click on the Create Funnel button on the page.
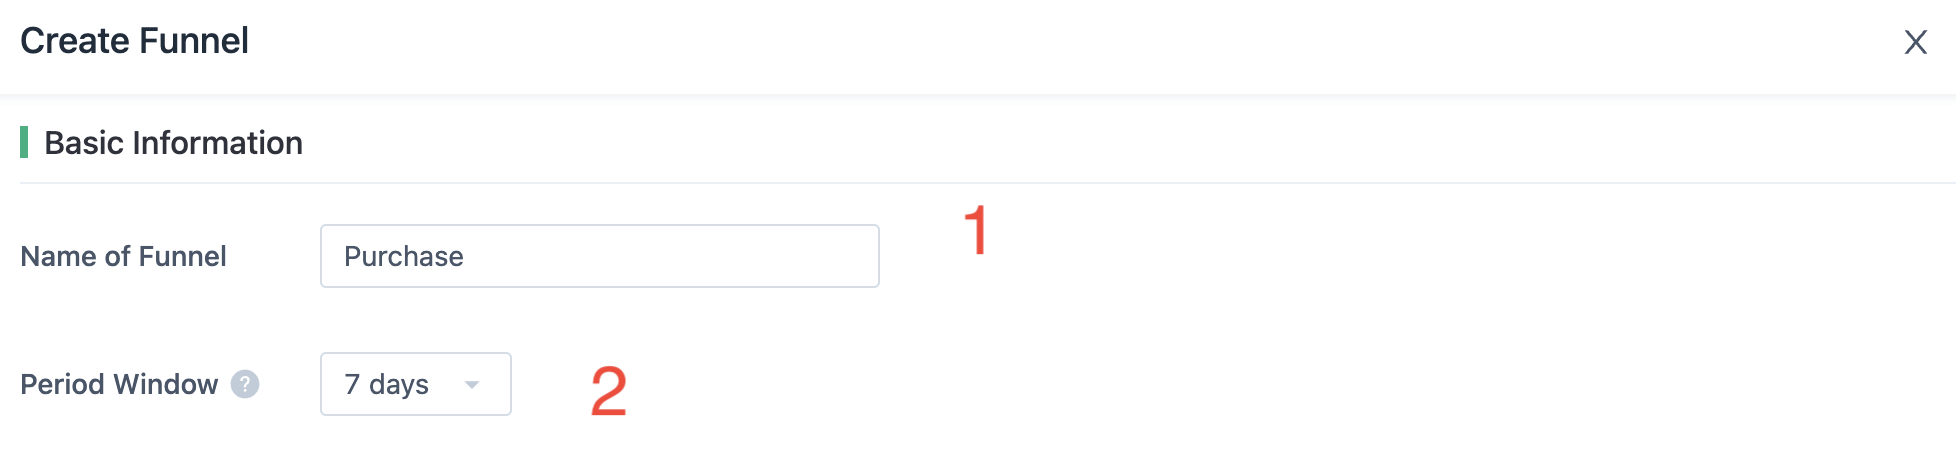
1. Fill in the funnel name. Give your funnel a friendly name that is representative. Funnel names cannot be duplicated within the same project.
2. Choose the funnel window. This is the time required for the entire funnel process to be completed.
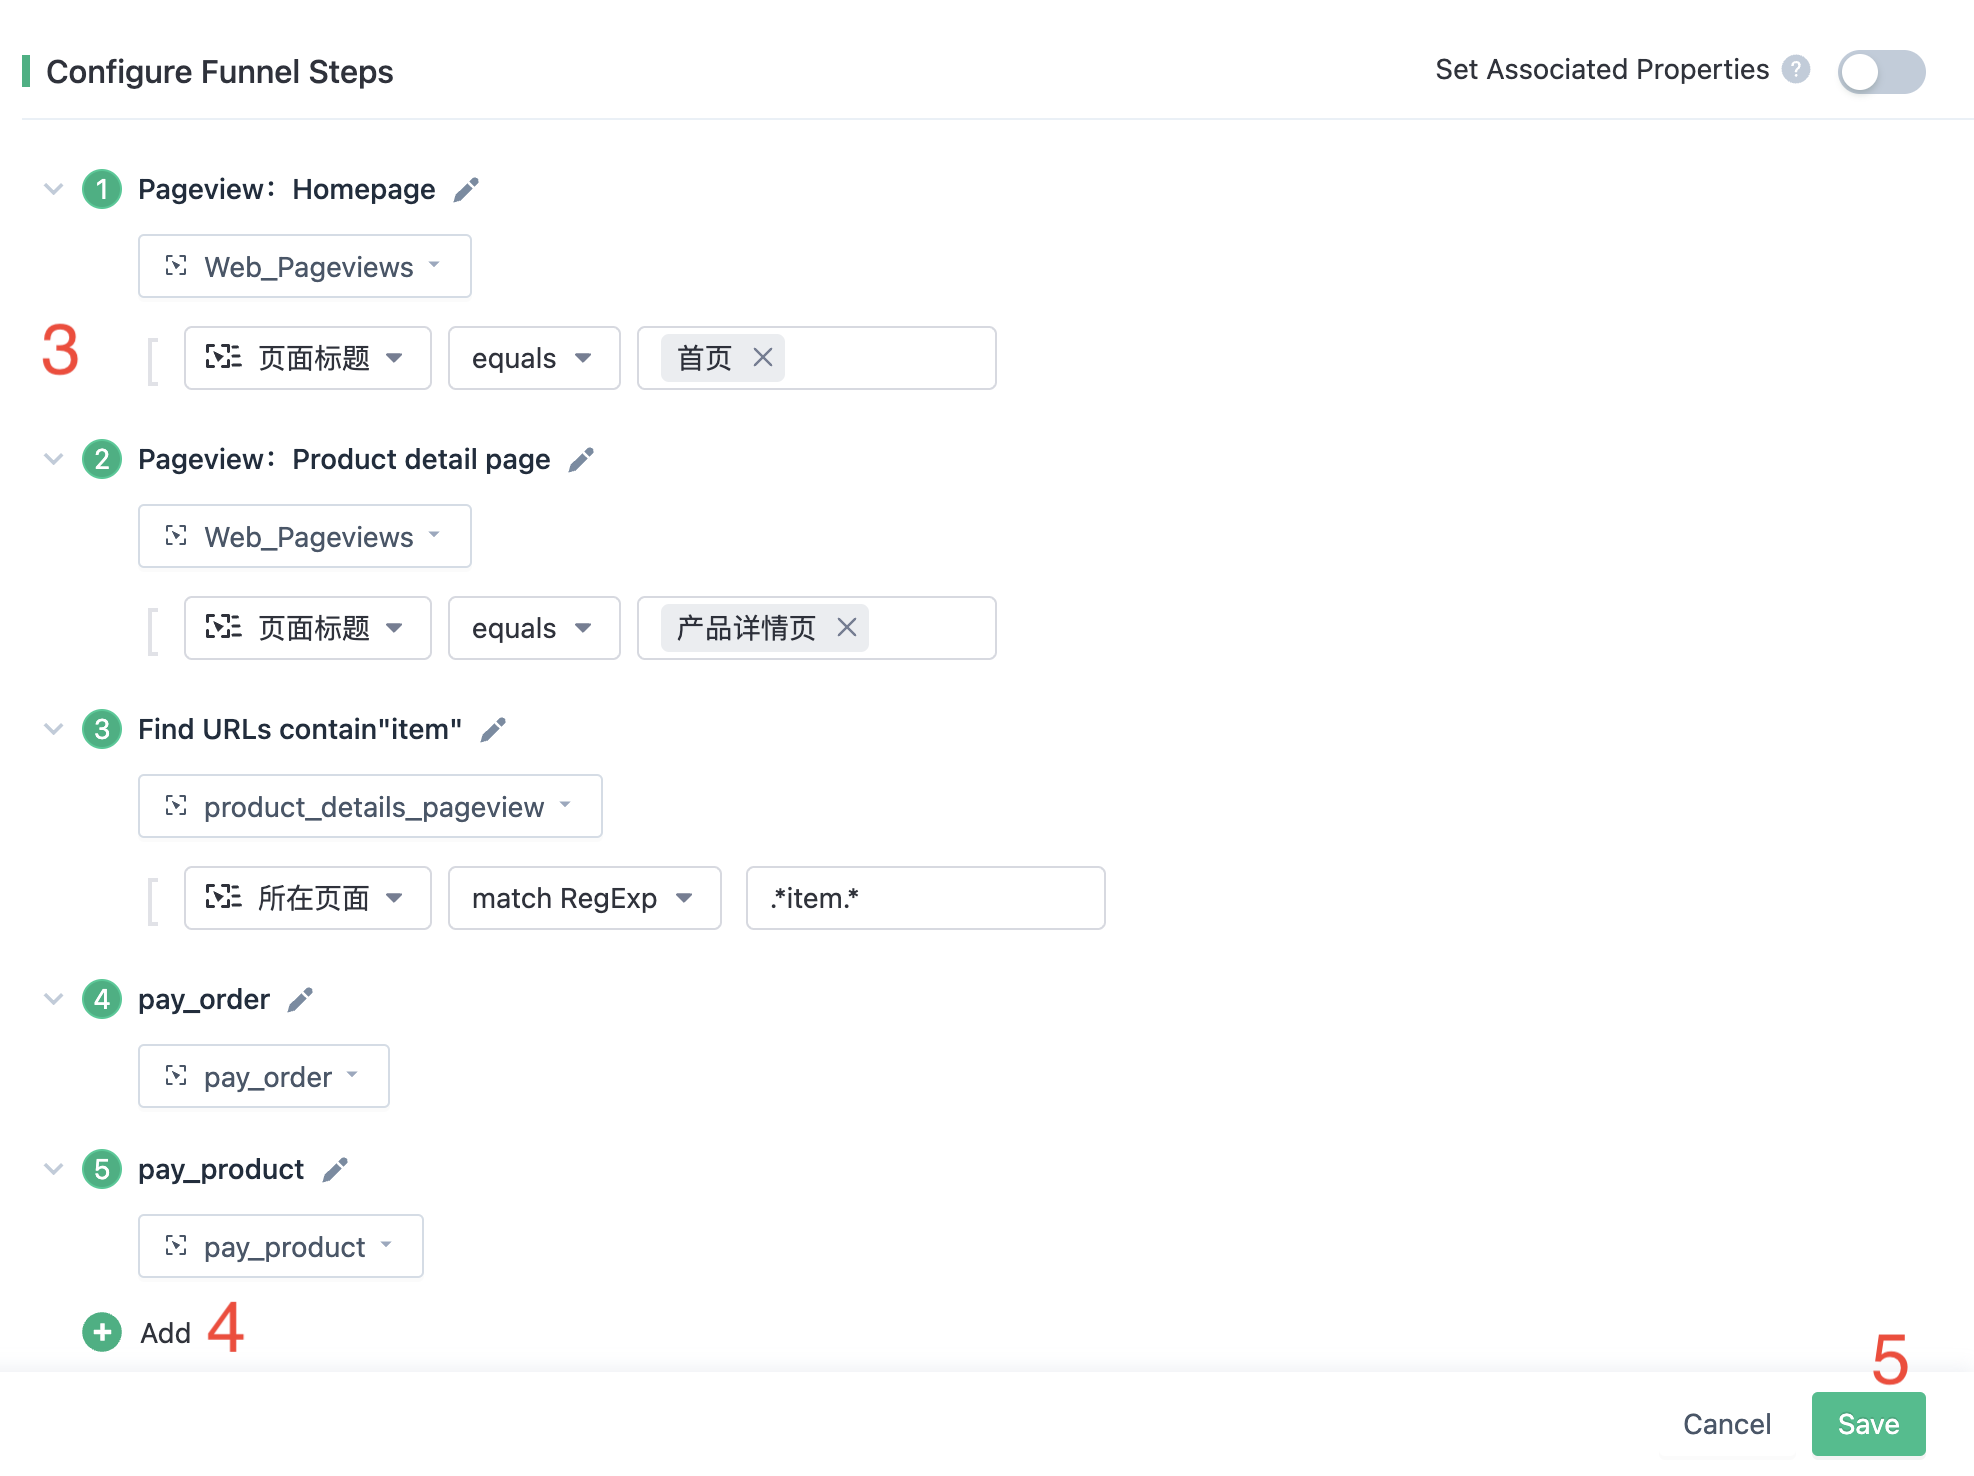
3. Add funnel steps. A funnel must contain at least 2 steps, each step corresponds to an event and can be accompanied by one or more filter conditions, such as filtering by page title and page address in steps 1, 2, and 3 to find the pages that meet our requirements.
4. If necessary, you can continue to add steps to the funnel.
5. Finally, save the funnel.
Analyze Funnel
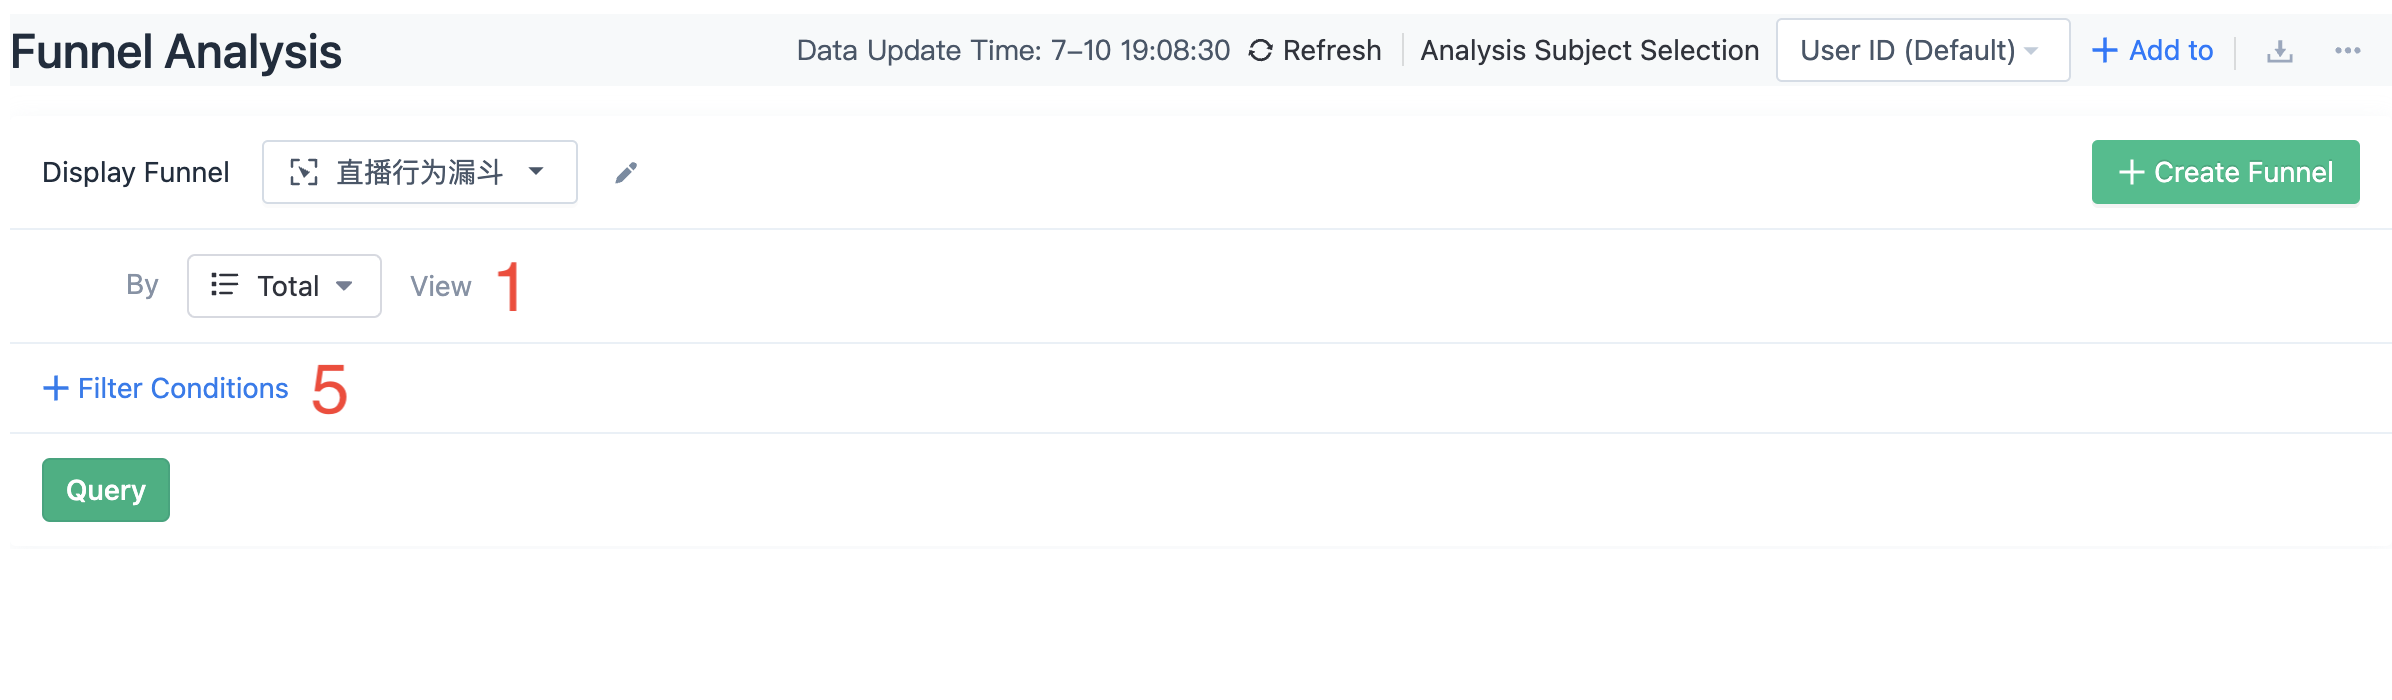
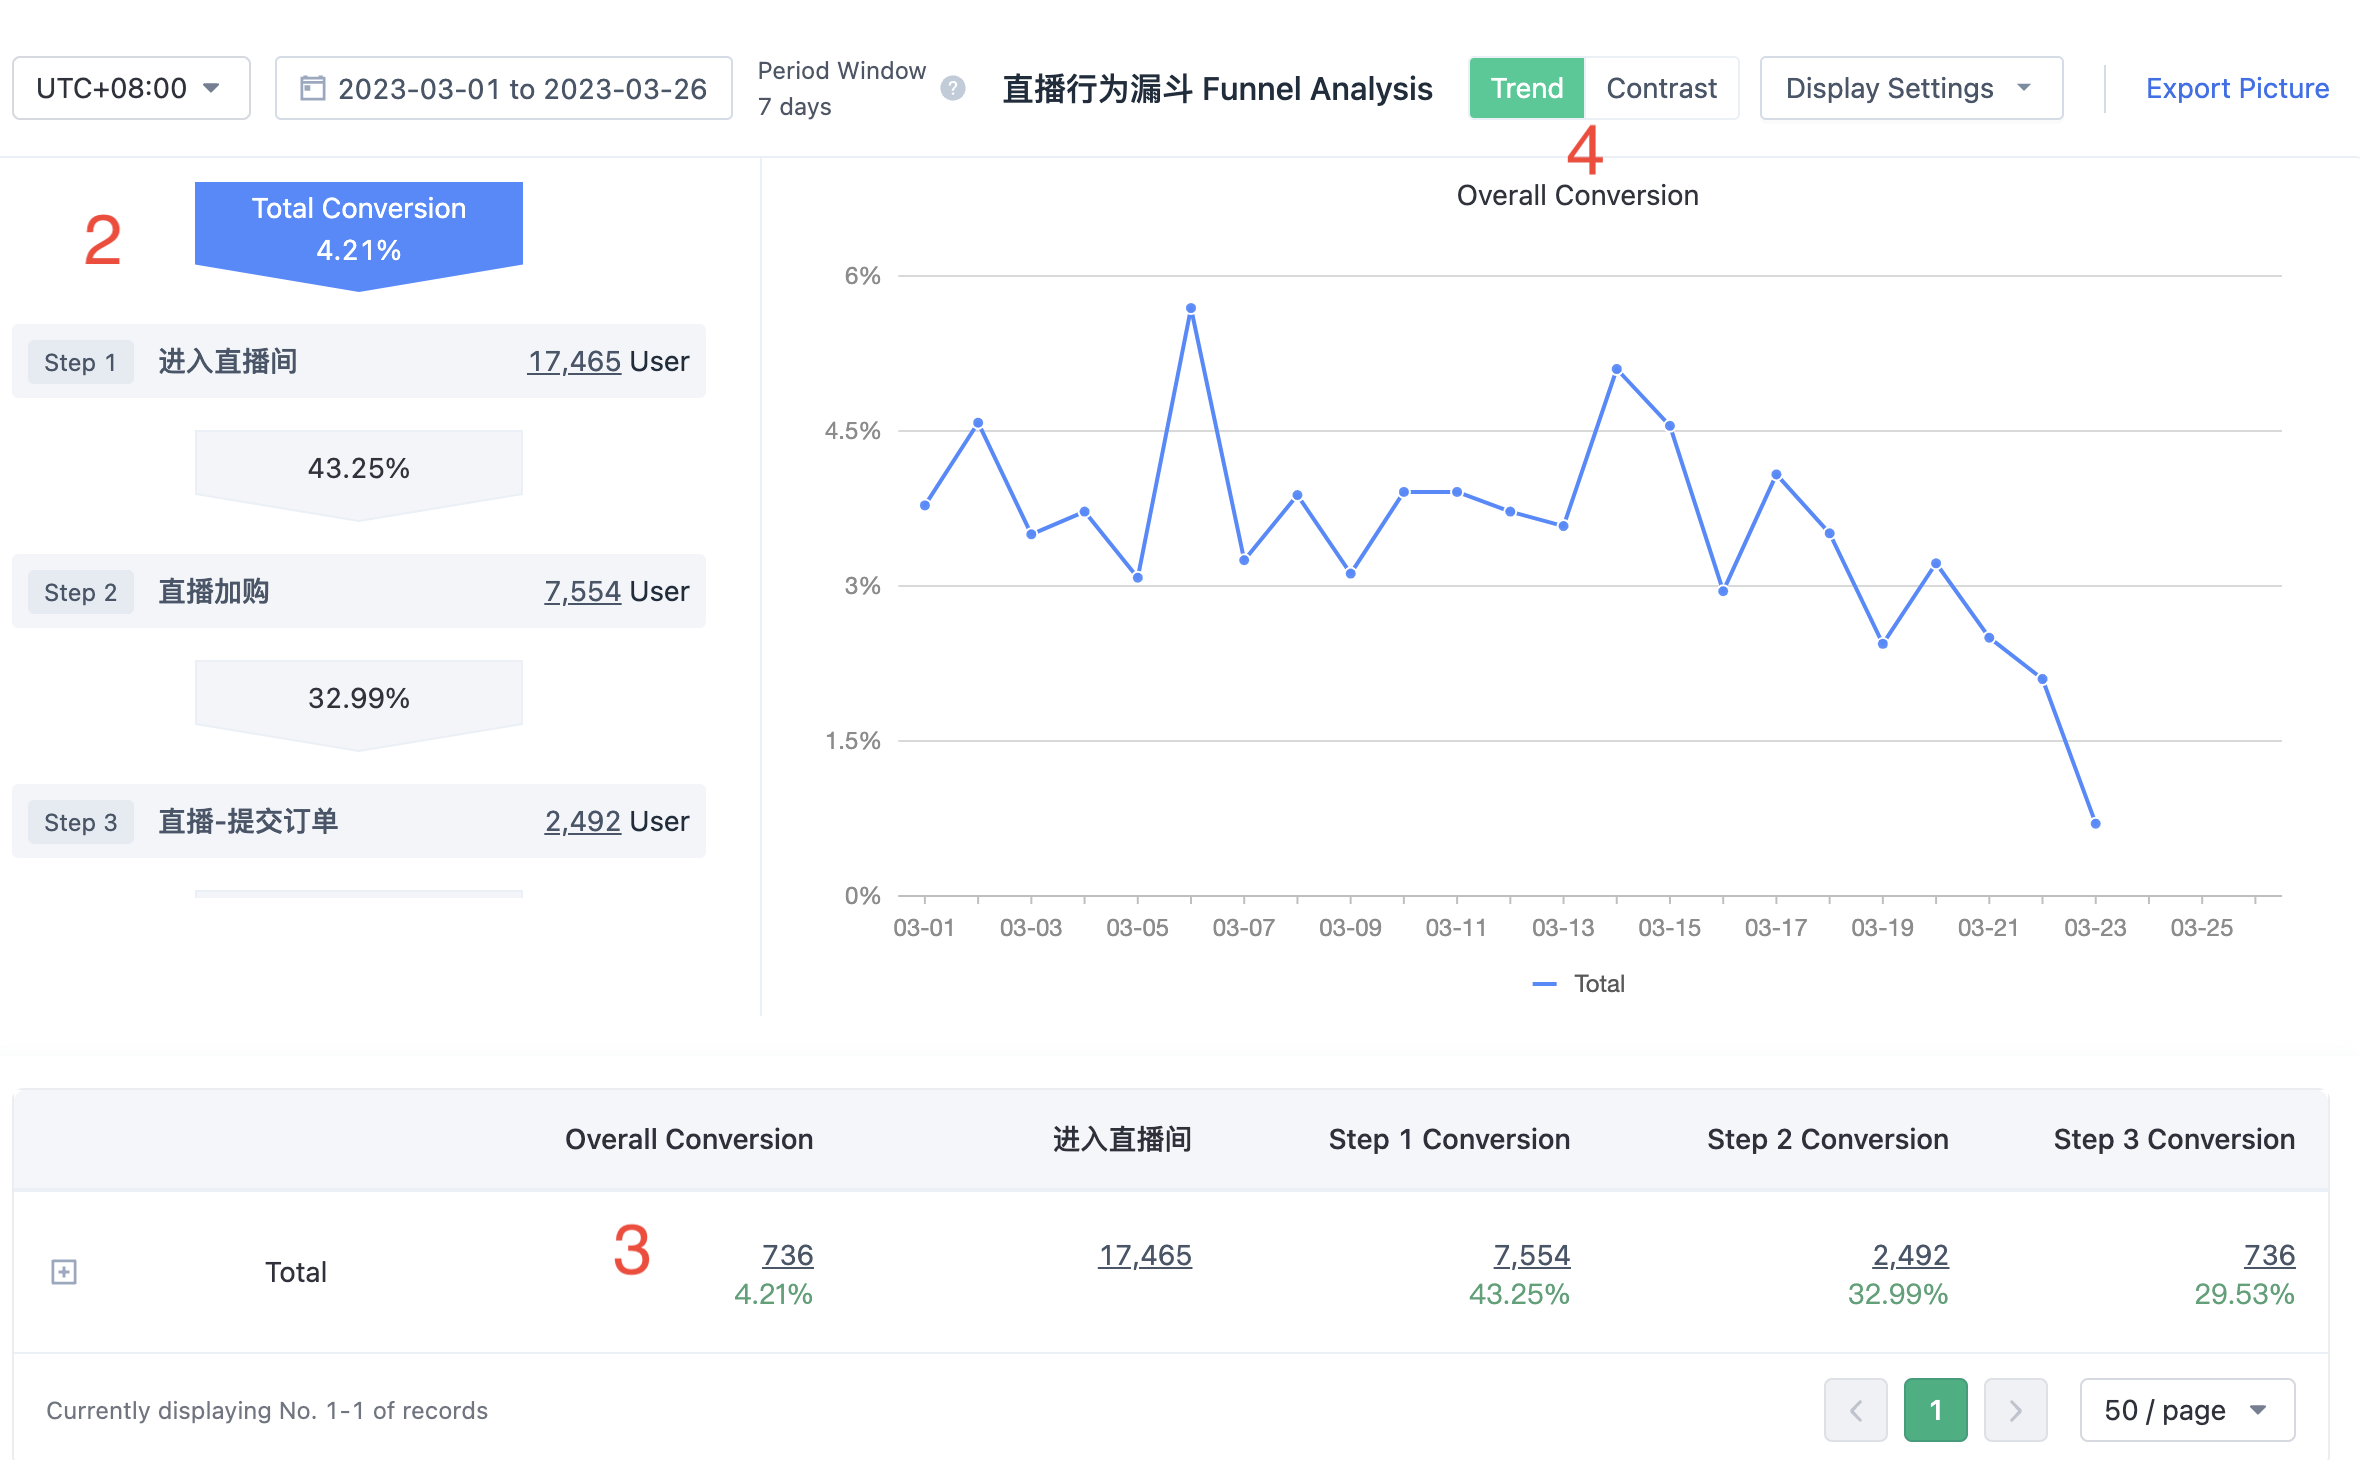
1. Choose how to view the funnel. View the overall conversion rate by total first.
2. You can see the conversion rate of each step from the funnel chart.
3. If you want to see the number of lost users at a certain step, find the list of lost users, you can see how many users were lost. Click on the lost user number to see the detailed information of this batch of lost users.
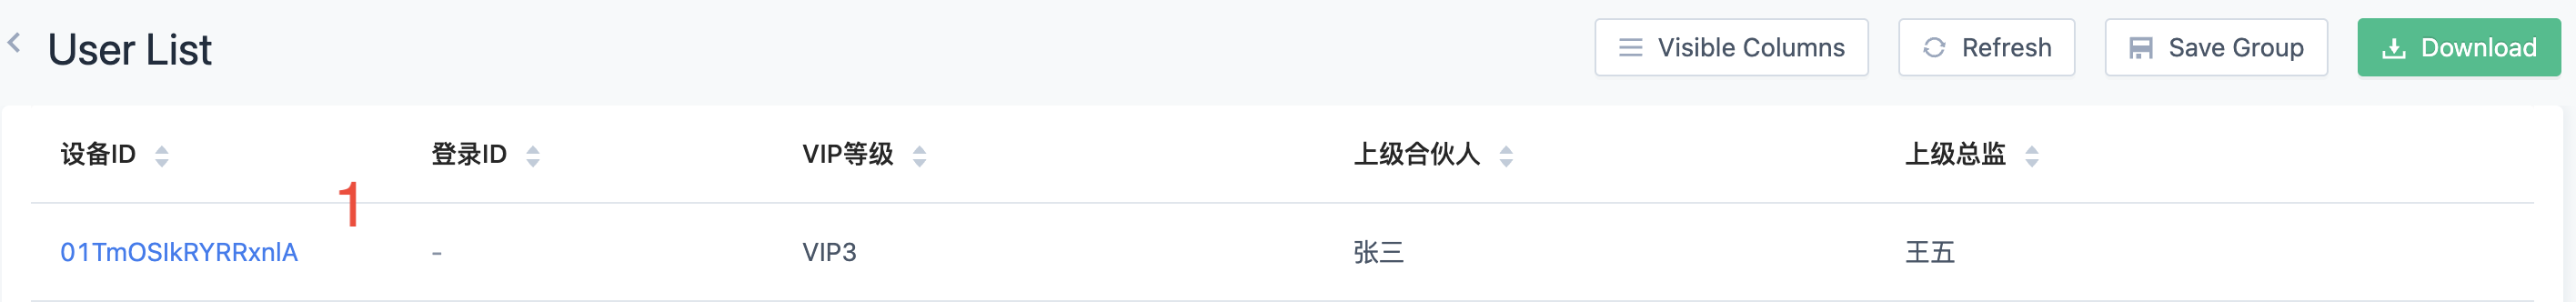
Click on the device ID column in the user list to see the user's detailed behavior path before the lost.
After optimizing the funnel, we can regularly observe the changes in the overall and each step conversion rate trend. Then how is the performance of the funnel for different segmentation dimensions?
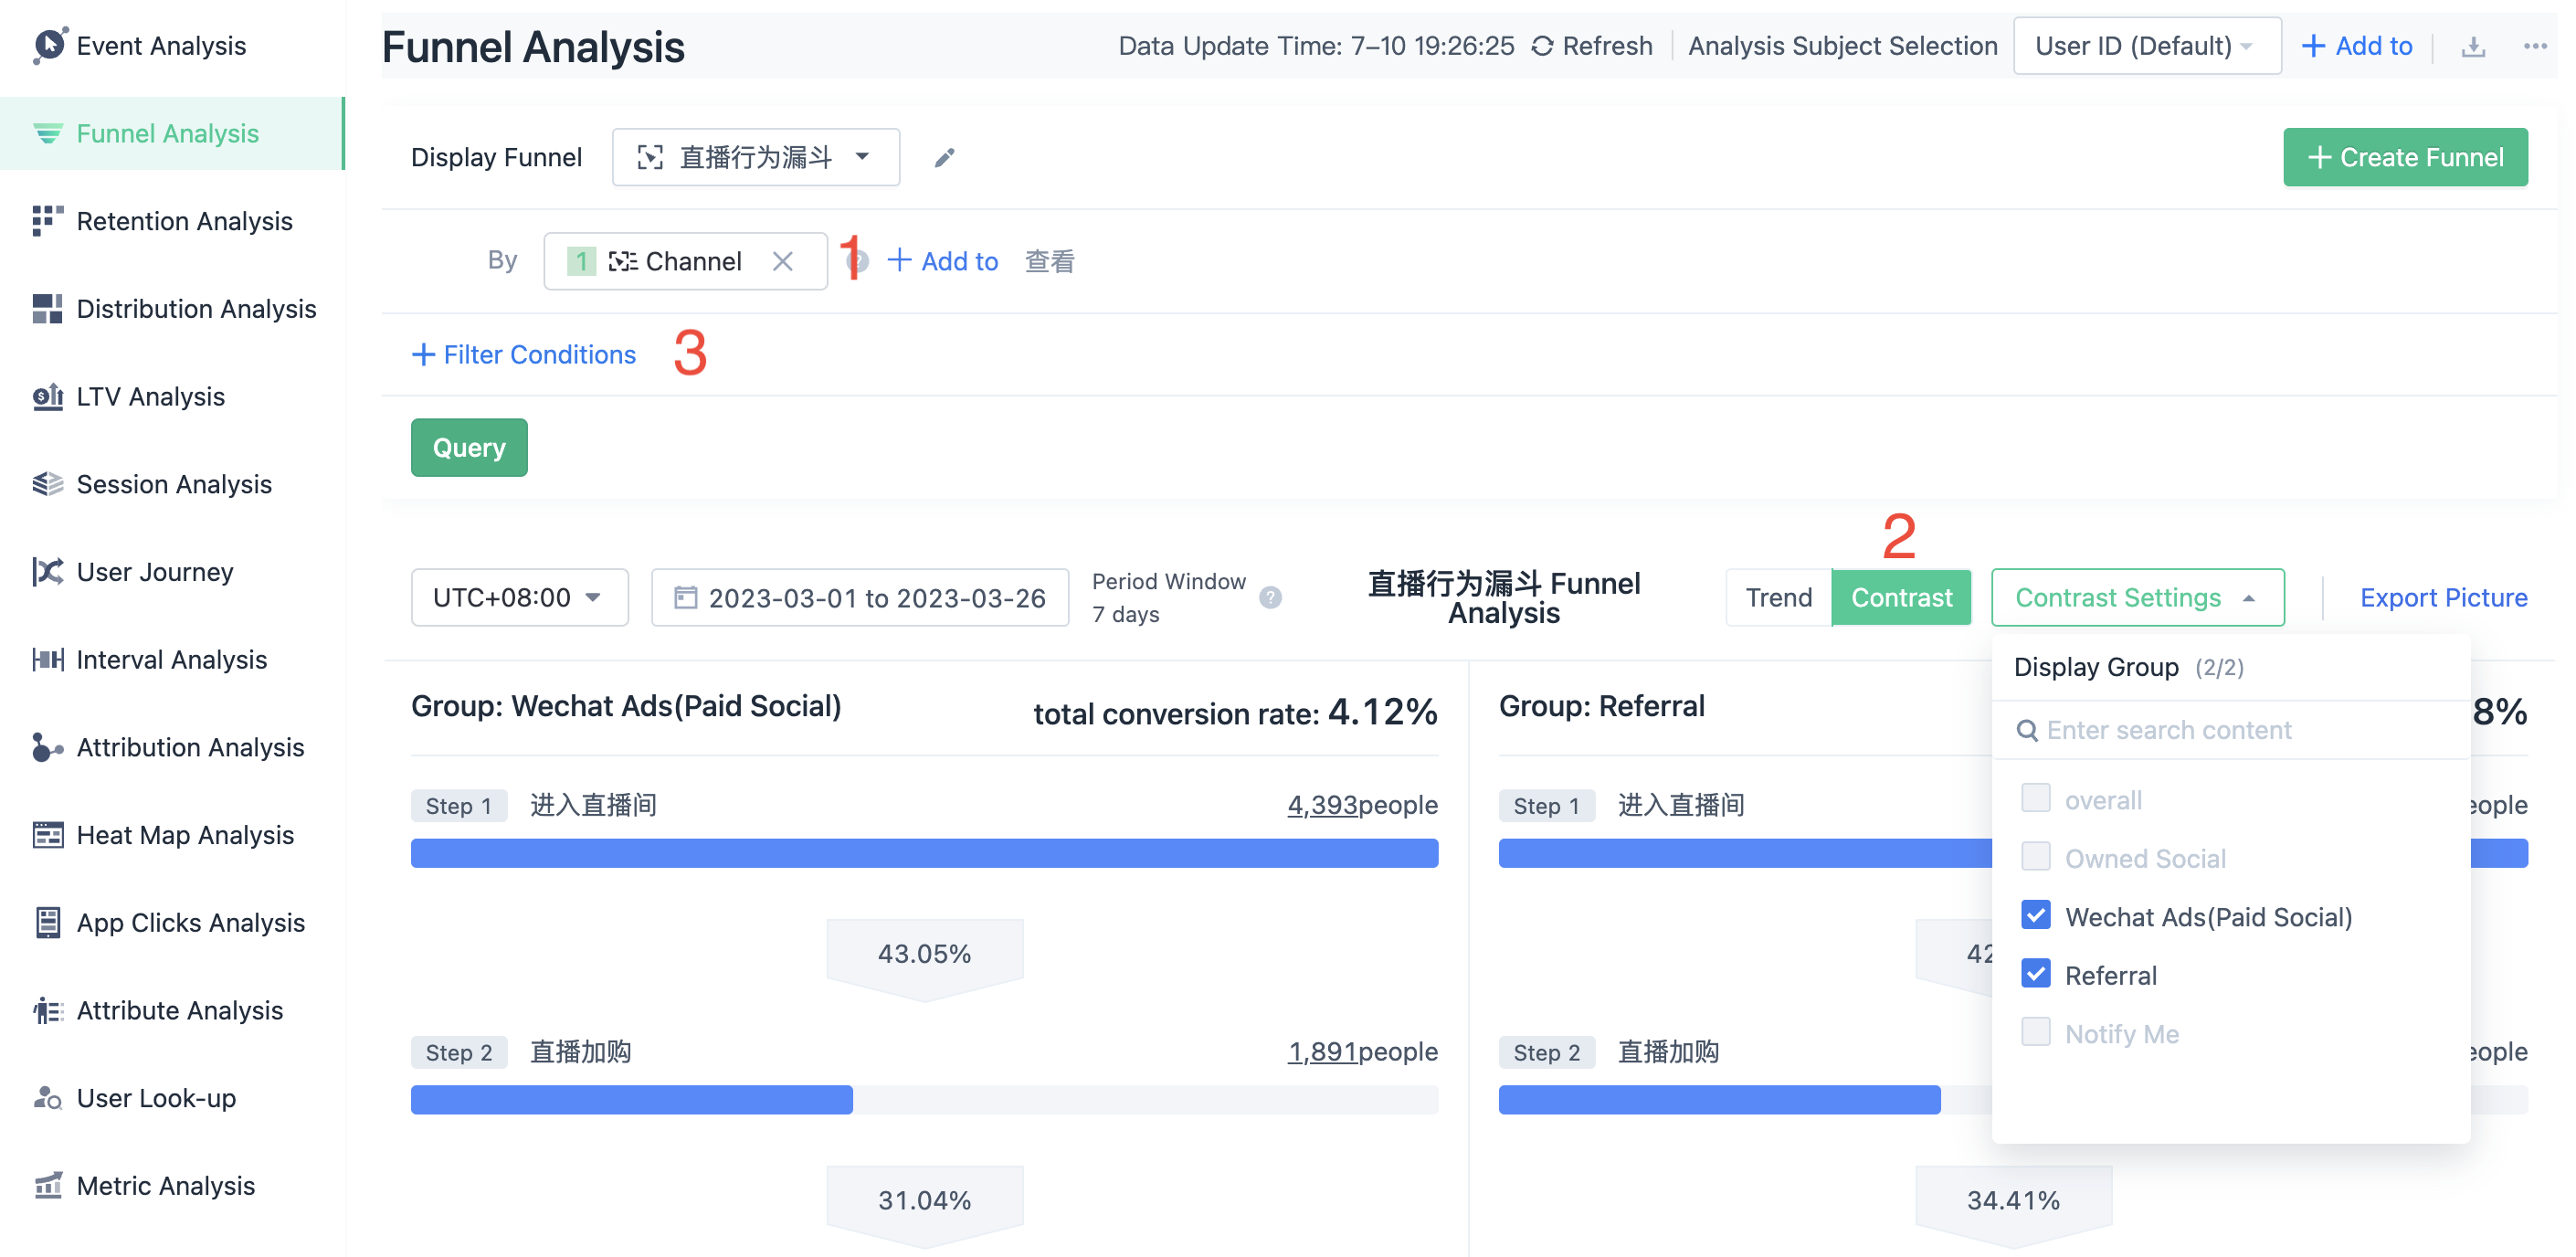
1. View by the first step of ad campaign source.
2. Switch comparison, check the two channels to be compared, you can see the difference in the total conversion rate and each step conversion rate of the two channels.
3. If you want to see the comparative data of these two channels under a certain ad campaign, you can add filtering conditions, such as ad campaign name equals to Double Eleven Promotion.
Note: The content of this document is a technical document that provides details on how to use the Sensors product and does not include sales terms; the specific content of enterprise procurement products and technical services shall be subject to the commercial procurement contract.
 Popular Searches