Complex Analysis Scenarios
|
Collect
1. Identify the reasons for the decline in product sales
Here we take "identifying the reasons for the decline in product sales" as an example to demonstrate how to use the combination of functions to solve complex analysis problems encountered in practical work.
1.1. Analysis Task
Trace the core product sales decline reasons
1.2. Task Difficulties
Need to focus on the basic metrics and conversion rates of each preceding step in the conversion process, and drill down to identify reasons
1.3. Sensors Solution
Combining the 8 major analysis models of Sensors with powerful aggregation, grouping, and filtering functions to quickly identify reasons
1.4. Analysis Method
- Use event analysis to view the trend of core product sales and identify abnormal dates
- Use funnel analysis to view key metrics and conversion rates in the process from browsing the product details page to placing an order on abnormal dates
- Use interval analysis to set a reasonable window period for the funnel
- Go back to funnel analysis and identify the abnormal step
- Use event analysis to group the traffic to the product details page by promotional sources and determine if the effect of the promotional sources is causing the abnormality
- Use event analysis to view the overall site traffic trend and see if it matches the trend of order volume
1.5. Analysis Conclusion
The main reason for the decline in product sales is abnormal site traffic, not the influence of promotional sources
1.6. Specific Actions
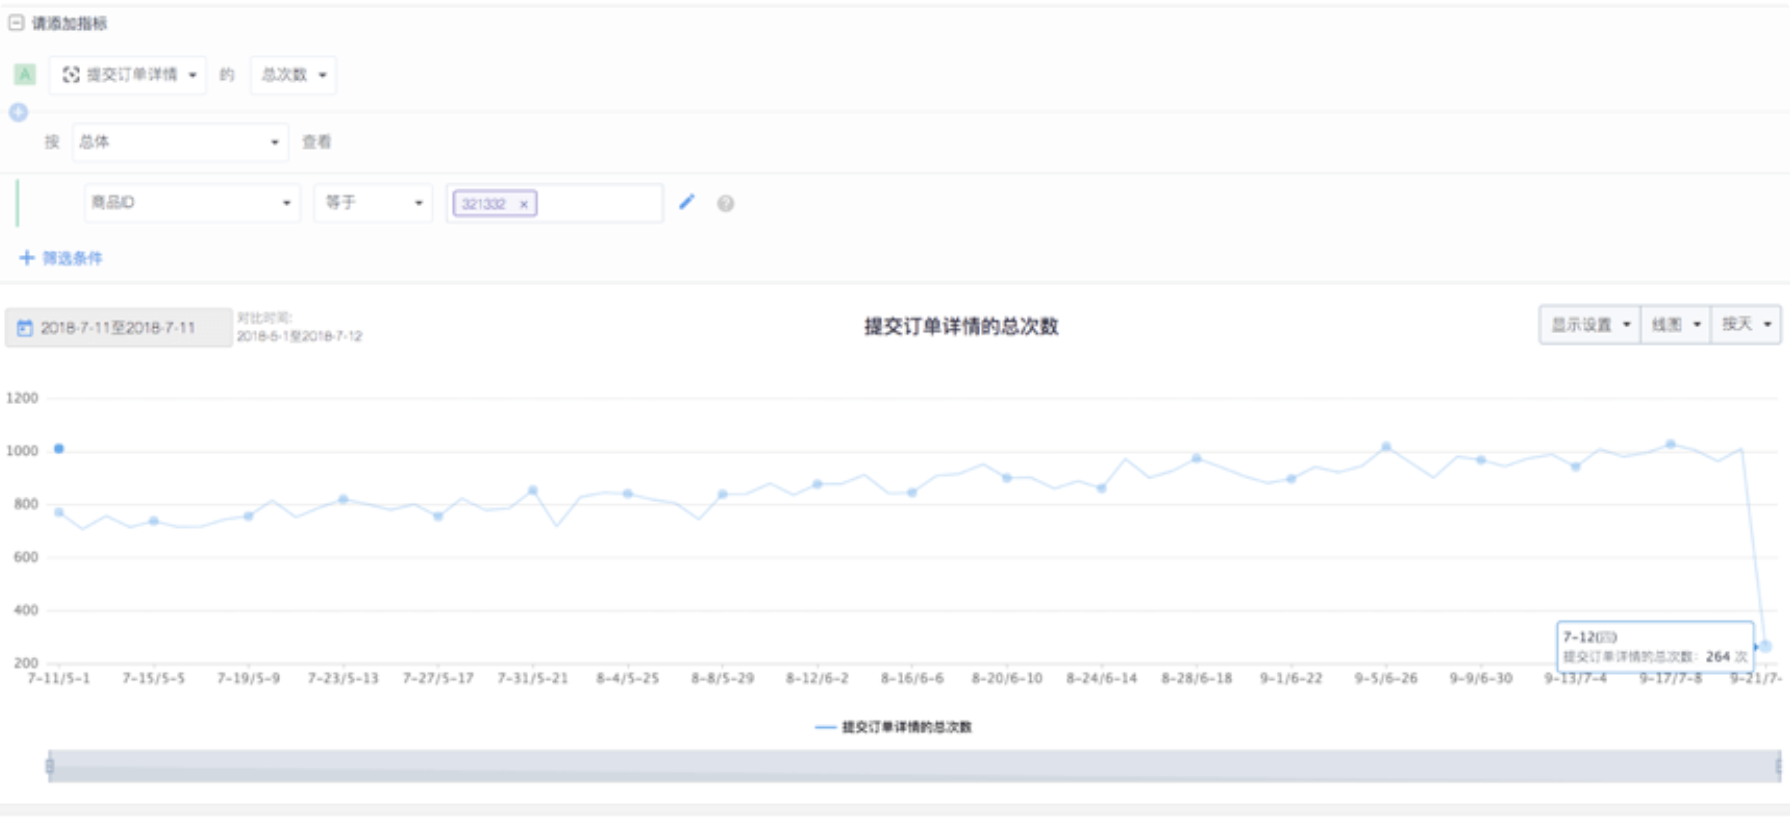
1.6.1. Step 1: Use event analysis to view the trend of core product sales and identify abnormal dates
Select Metric: Total count of the event "Submit Order Details"
Set filtering conditions: Event property "Product ID" equals "321332"
Set time: Select "this month" and view by "day"
Analysis Result: Sales declined by 74% on July 12th, need to investigate the cause
1.6.2. Step 2: Use funnel analysis to view key indicators and conversion rates of the critical steps in the process from browsing the product details page to submitting the order
Create Funnel
Set Funnel Steps: Set "View Product Details Page", "Add to Cart", and "Submit Order Details" events as the three steps of the funnel
Add Trigger Limit: Set "Product ID" equals "321332" to only extract data related to the product of interest
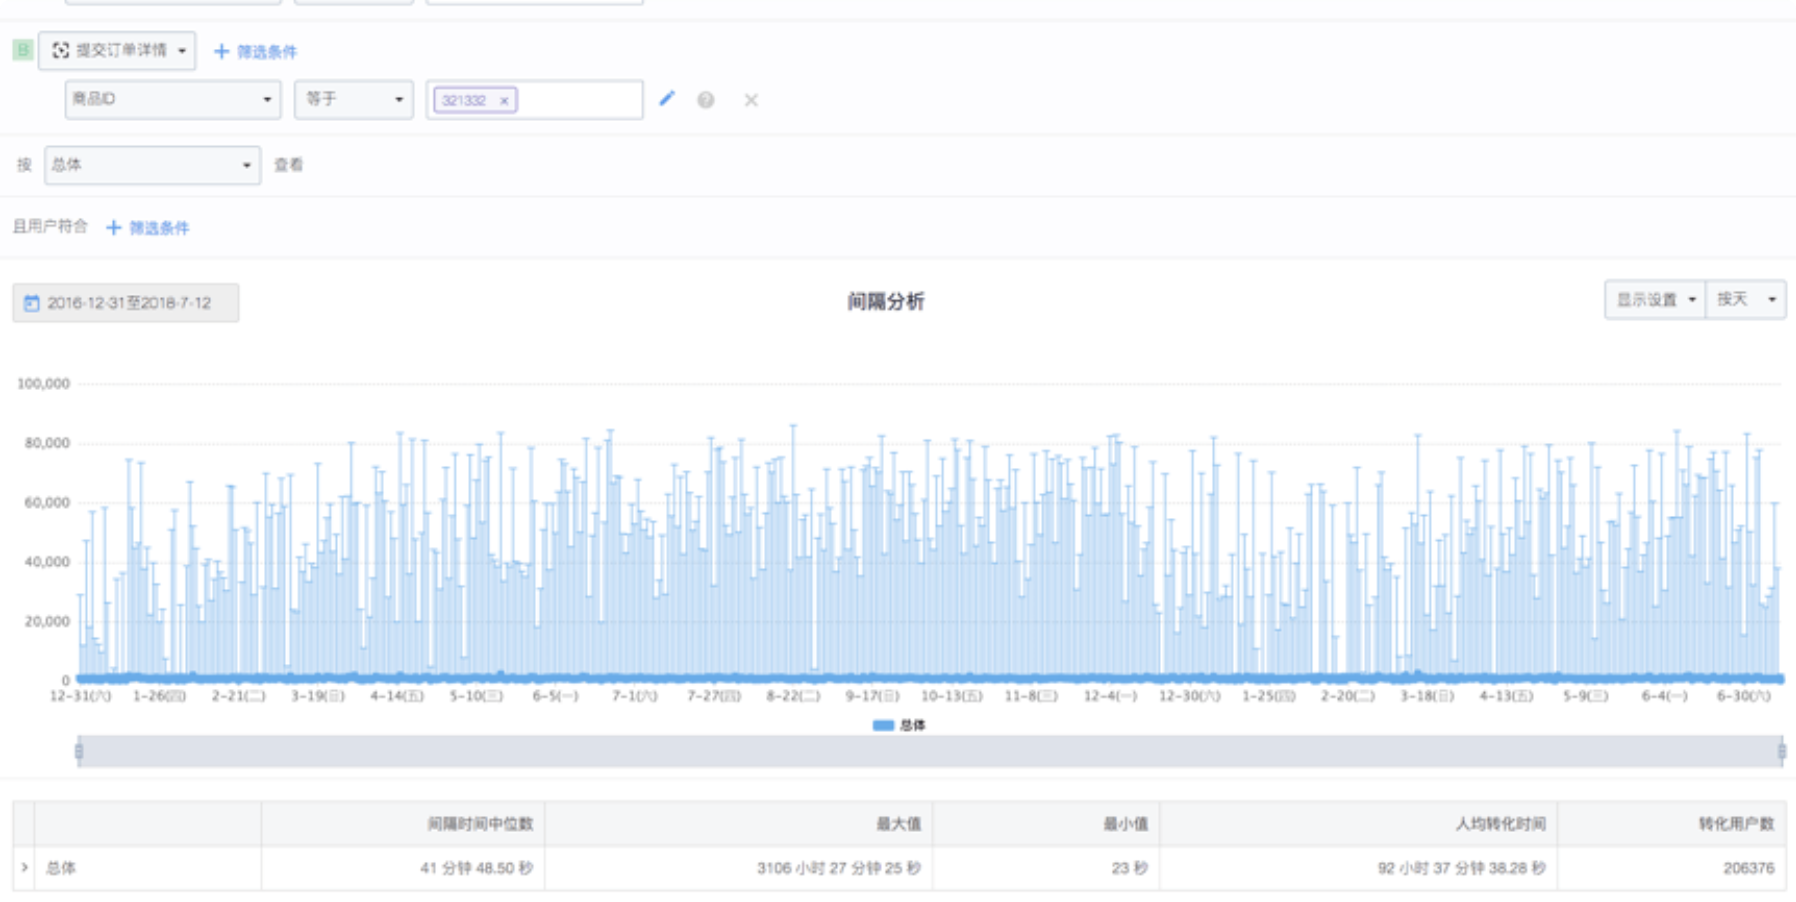
1.6.3. Step 3: Use interval analysis to set a reasonable window period for the funnel
Export data and use Excel to observe the overall distribution and stability of the mean to determine the median of the interval time
Analysis Result: The median interval time per person has remained relatively stable since the launch, with a median of 1818 seconds. The estimated conversion time from browsing the product to placing an order is 30 minutes. Therefore, when analyzing the fluctuation and conversion rate of orders,
a window period of 30-1 hours is reasonable for estimation purposes. For analyzing the fluctuation of orders on March 2nd, the start date of the funnel can be set to that day.
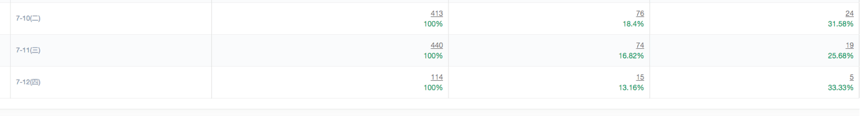
1.6.4. Step 4: Go back to the funnel analysis and locate the abnormal steps
Set Date: Select the week containing July 12th and observe the conversion rate fluctuation by day
Analysis Result: There are no abnormal conversion rates in each step. However, by observing the change in total count of browsing the product details page, it is found that the count on July 12th decreased by 75%, which is the main reason for the decrease in orders.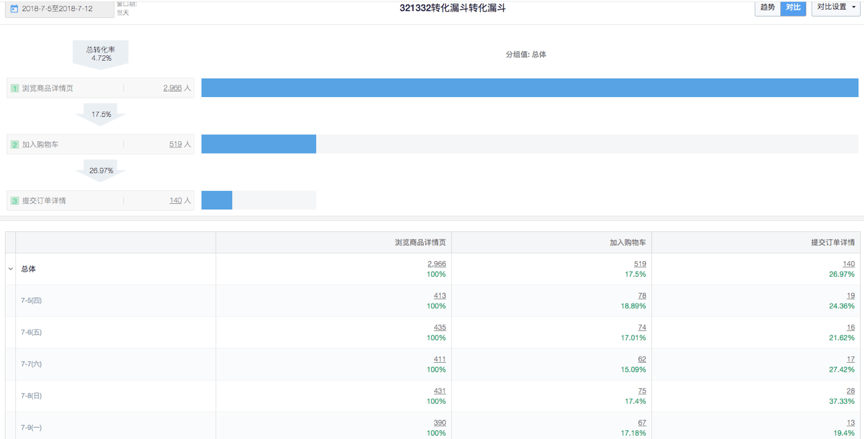
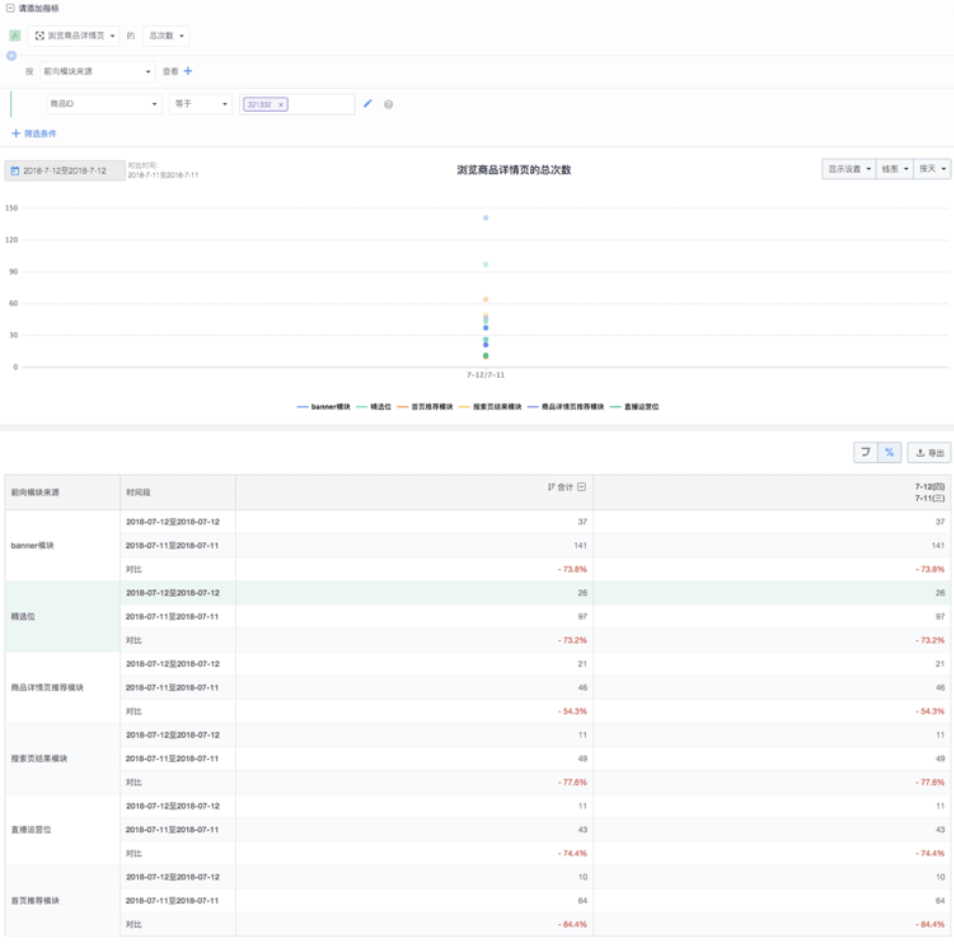
1.6.5. Step 5: Use event analysis to set the traffic of the product details page to view the group by the source of the promotion bit, and determine whether the effect of the promotion bit causes an exception
Select Metrics: Select the total number of times the event "Product Details page" was viewed
Set filtering criteria: Event property "Product ID" equals "321332"
Set grouping property: View by "Referring Source";
Set time: Select "This Month" and view by "Day"
Analyze and find that the source of all incoming modules has dropped significantly, suggesting that it is due to changes in overall website traffic rather than individual promotion positions.
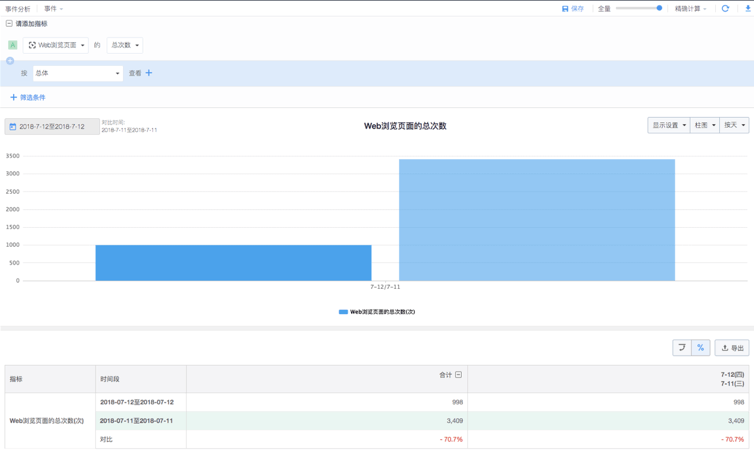
1.6.6. Step 6: Use event analysis to see if the overall traffic trend matches the trend in order volume
Observe the changes in the total number of Web Visits and App Visits
Total number of Web Visits
Total app page views
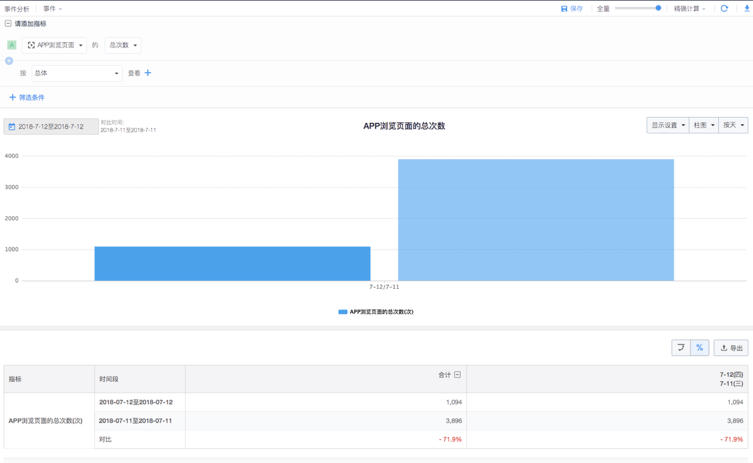
Analyze and determine that the decline in sales of this product is due to a decrease in overall website traffic, rather than individual promotion positions
Note: The content of this document is a technical document that provides details on how to use the Sensors product and does not include sales terms; the specific content of enterprise procurement products and technical services shall be subject to the commercial procurement contract.
 Popular Searches