Debug View
|
Collect
1. Overview
In order to facilitate users to Debug codes and adjust data formats, we have provided debug mode on SDK of various languages as well as import tools such as LogAgent and Integrator Importer, so that developers can use it when debugging codes and data. The debugging mode can be as follows:
- Send data to the backend in a synchronous, blocking manner (some languages may have a slightly different mechanism due to language features);
- Display the server's verification results in real time. When the verification fails, it will not only show the specific cause of the error, but also explicitly remind the user in the form of throwing exceptions (the specific implementation depends on the specific language).
- For the data that is successfully verified, you can view the value and type of each field of the data that is finally imported to the database in real time in the import aid tool.
See debugging methods for back-end SDK, App SDK, and import tools debug mode.
The Debug mode is a mode that is set for the convenience of developers to debug. This mode will verify data one by one and throw an exception when the verification fails, and the performance is much lower than the normal mode. Using the Debug mode in an online environment seriously affects performance and risks crashes. You must replace or disable the Debug mode before launching the product.
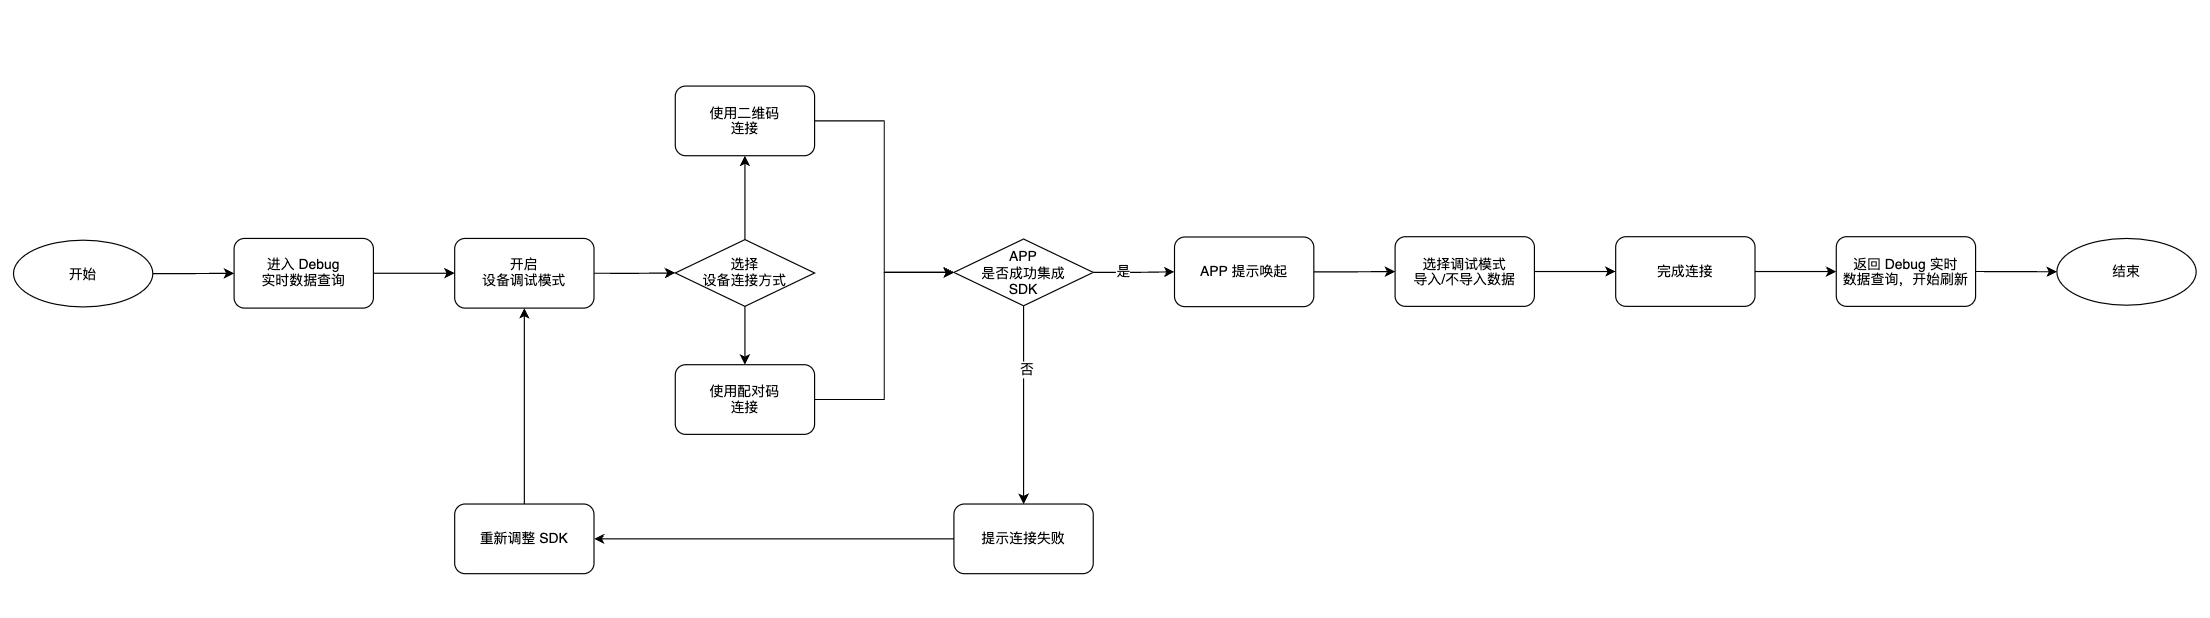
2. Debug Debugging process
The overall process of using the Debug mode is as follows:
2.1. Enable debug mode
Before using this function, ensure that Scheme has been configured in your App. Refer to the following documents:
- Android:Configure Scheme
- iOS:Configure Scheme
If in the new version of Sensors Android SDK(v3.0.4+) and iOS SDK(v1.10.23+) , the debug mode is preset to be off. If manually started, the App process will also be reset to the closed state after it is closed.
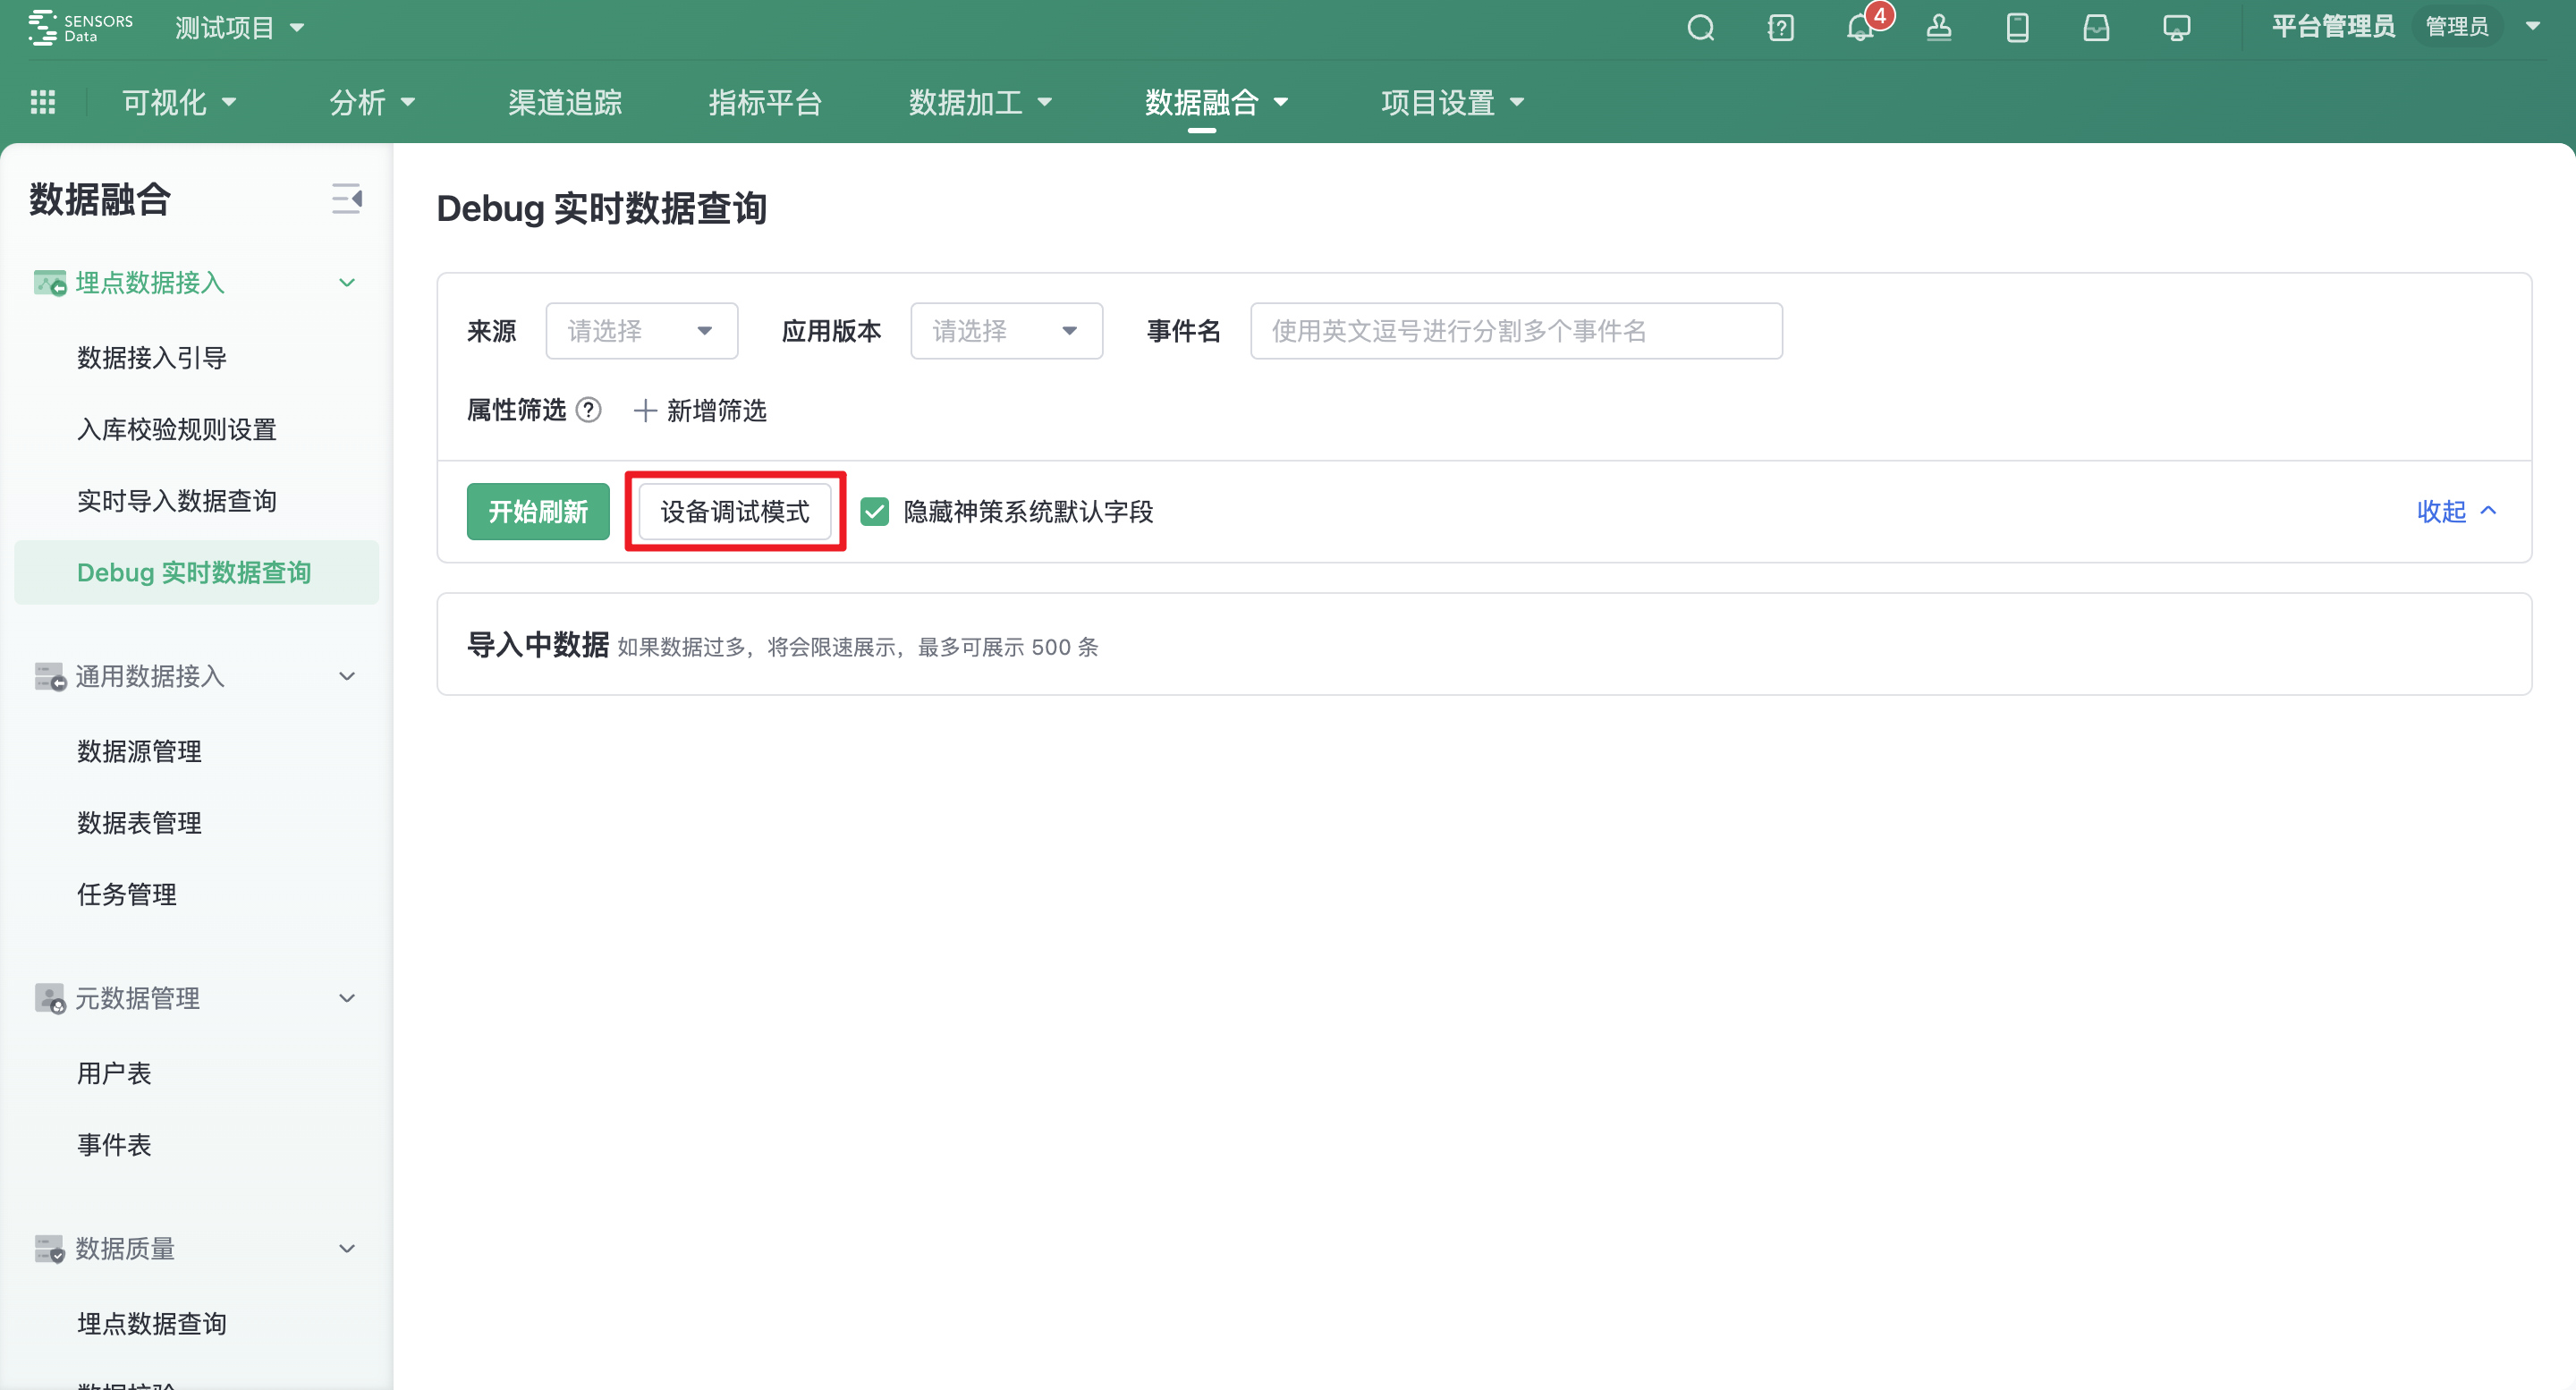
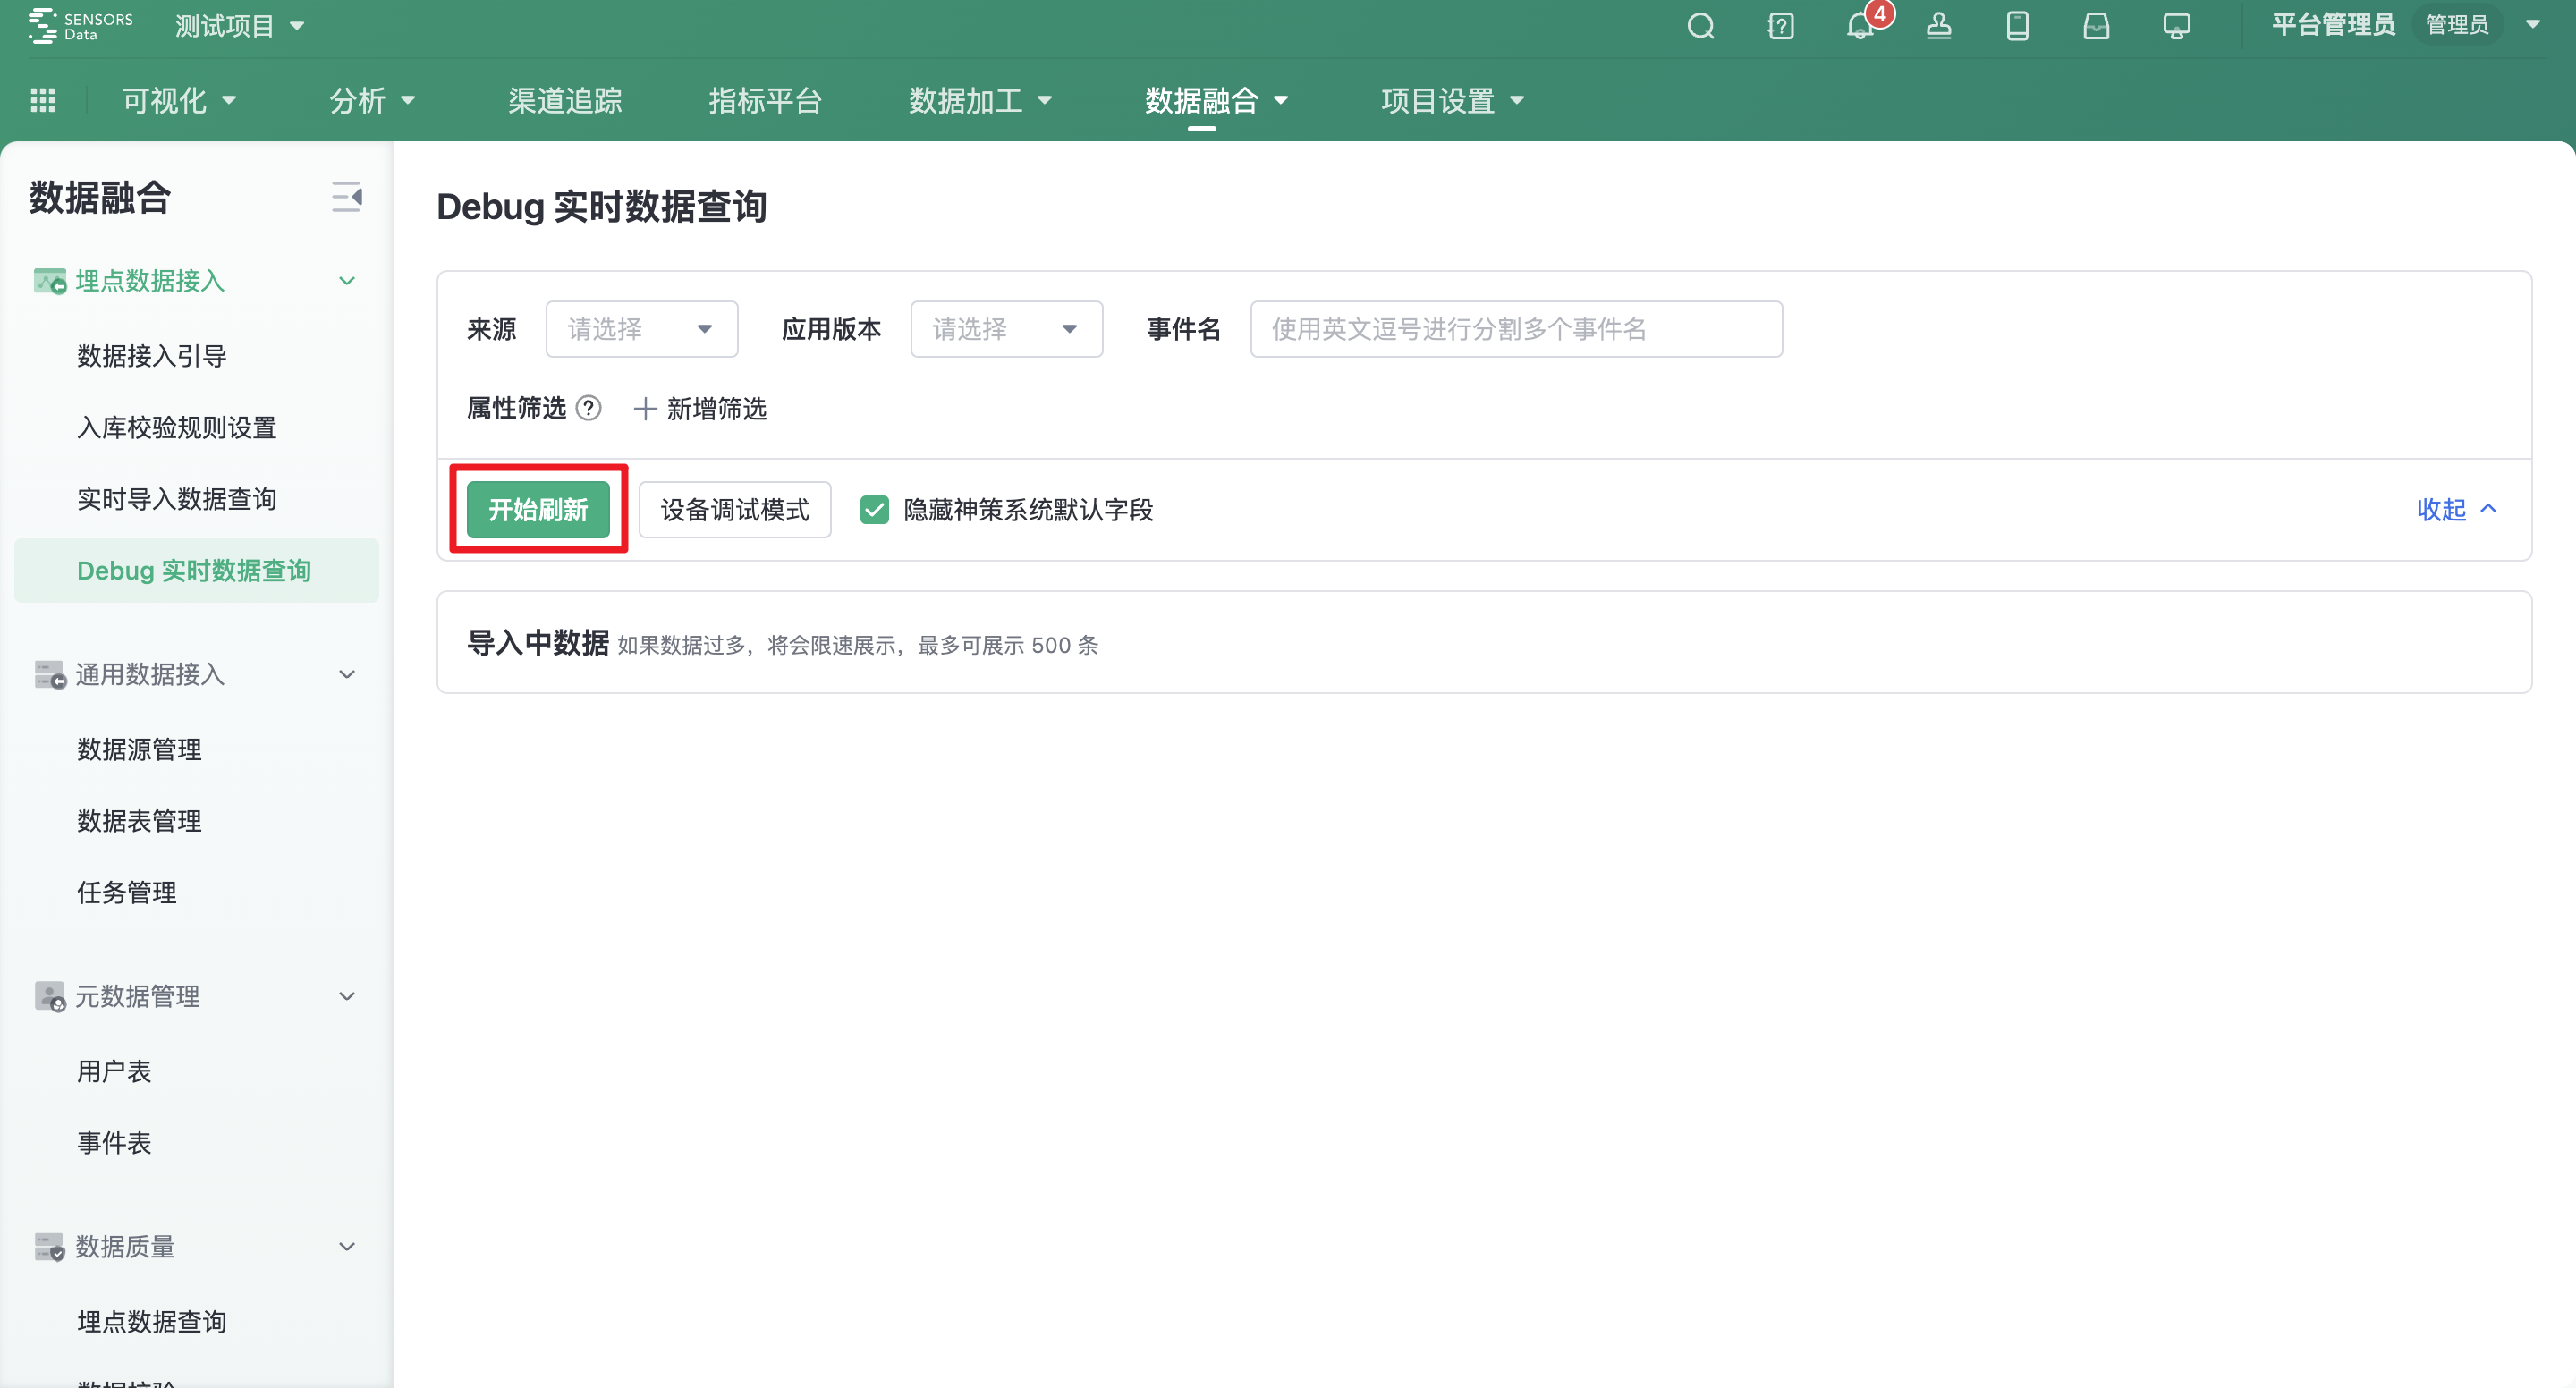
On the Debug Real-time Import Query page, click Debug Mode to set the debug mode.
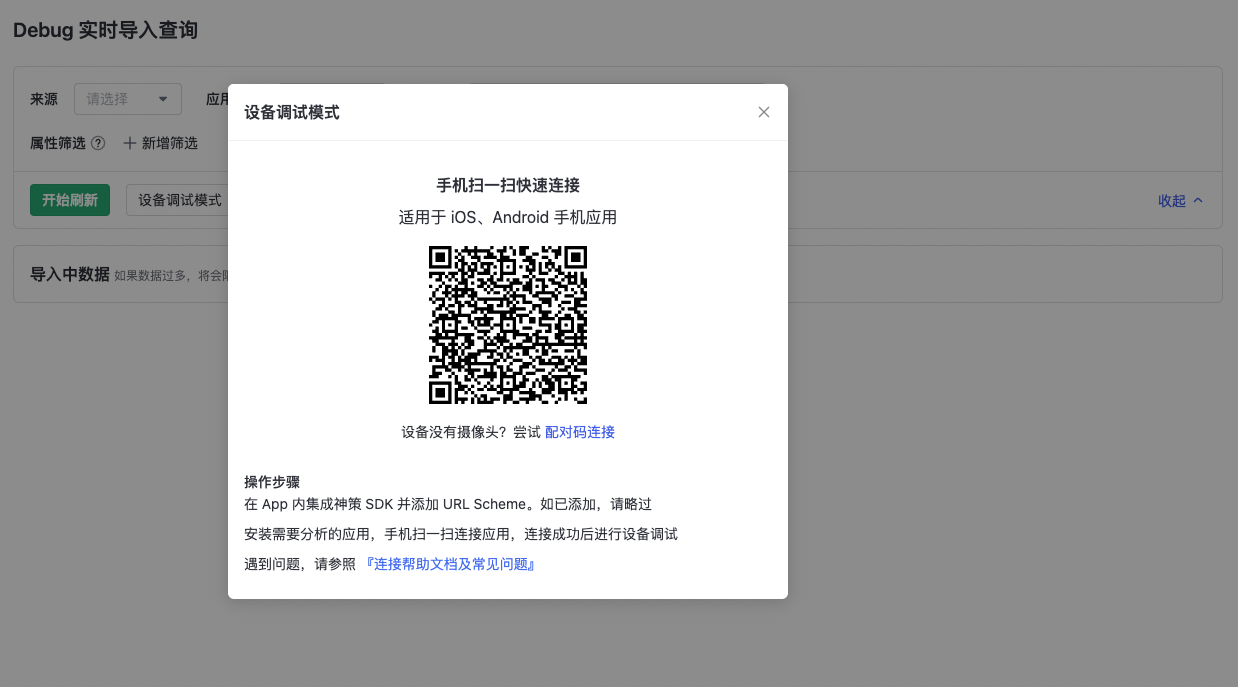
2.2. Scan the QR code/use the pairing code to connect the device
2.2.1. Use scanning QR code to connect
Prerequisites: The corresponding App has been installed on the mobile phone, and the SDK has been correctly integrated
- Click Set Device Debugging Mode, use the device whose debugging mode is to be enabled, and scan the two-dimensional code in the image using the scanning tool. Use your browser to open the QR code URL
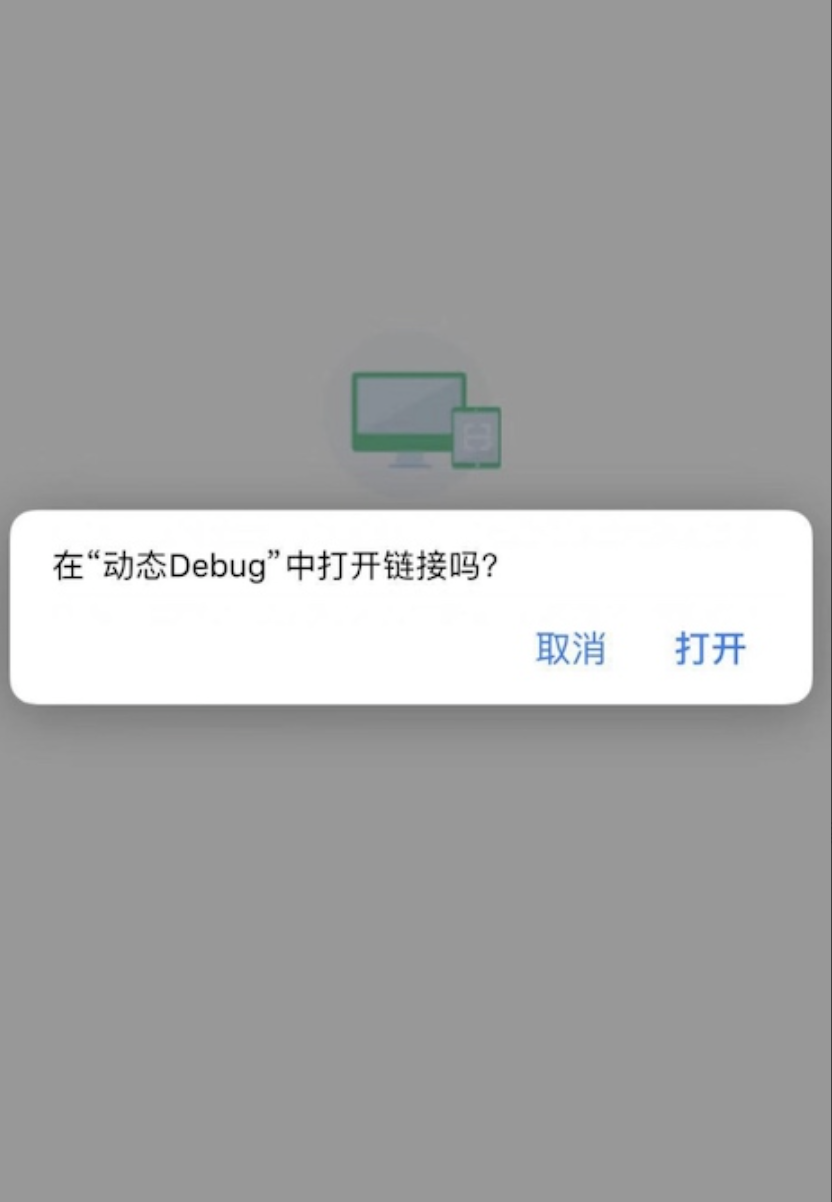
- If the App has successfully integrated the SDK, the App is directly awakened or prompted to ask whether the App is awakened
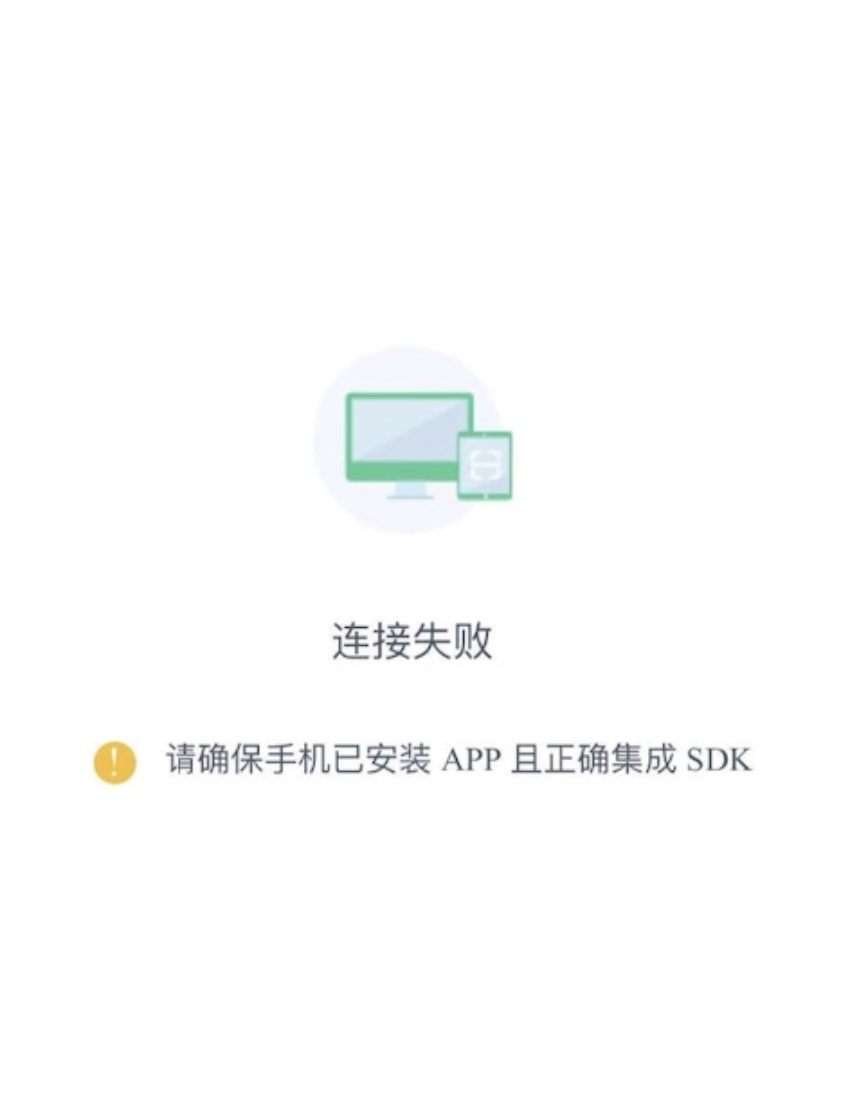
- If there is a problem with the App integration SDK or the App is not installed, the following error screen is displayed. Please check your App configuration
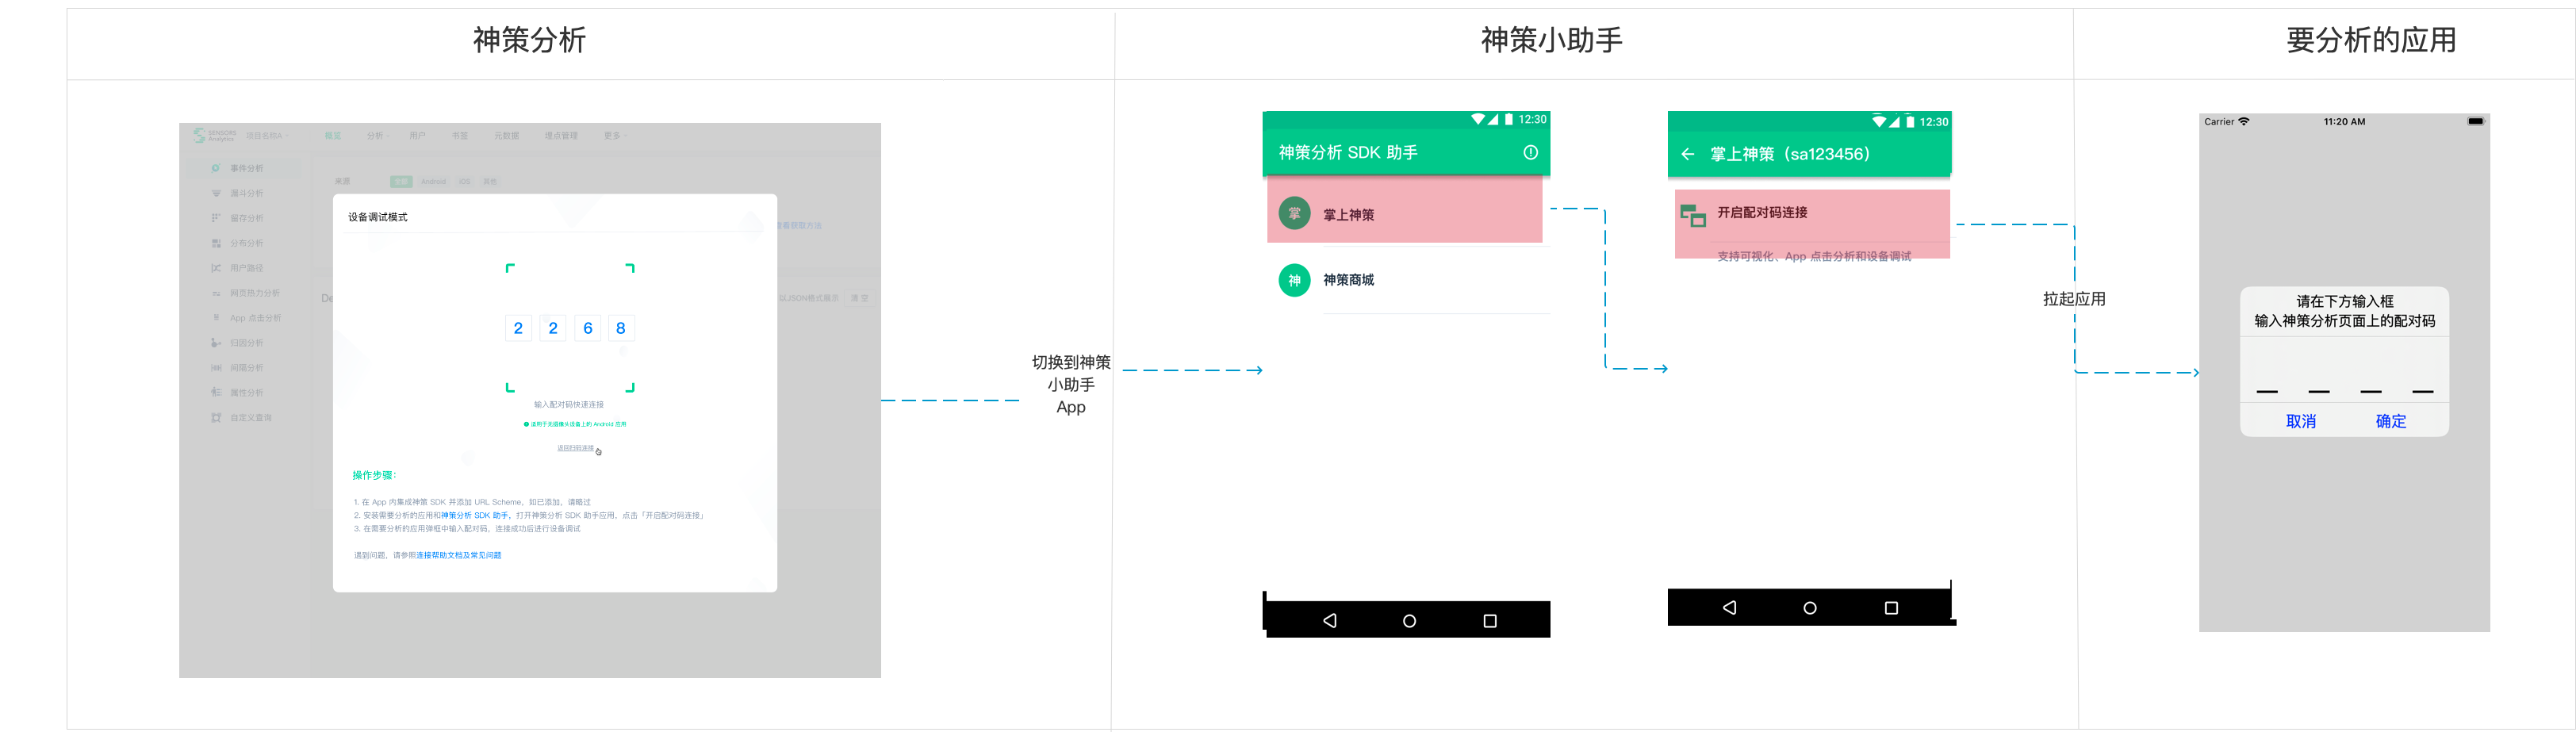
2.2.2. Use pairing code to connect
Prerequisites: The App and the corresponding software have been installed on the device「Sensors analysis SDK assistant」and integrate SDK correctly.
- Click "Try Pairing code connection" in "Set Device debugging Mode" to switch to pairing code connection mode;
- Open Sensors Analysis SDK assistant, click the application name, click "Open pairing code connection", pull up the target application, enter the pairing code in the target application, and pull up the application successfully.
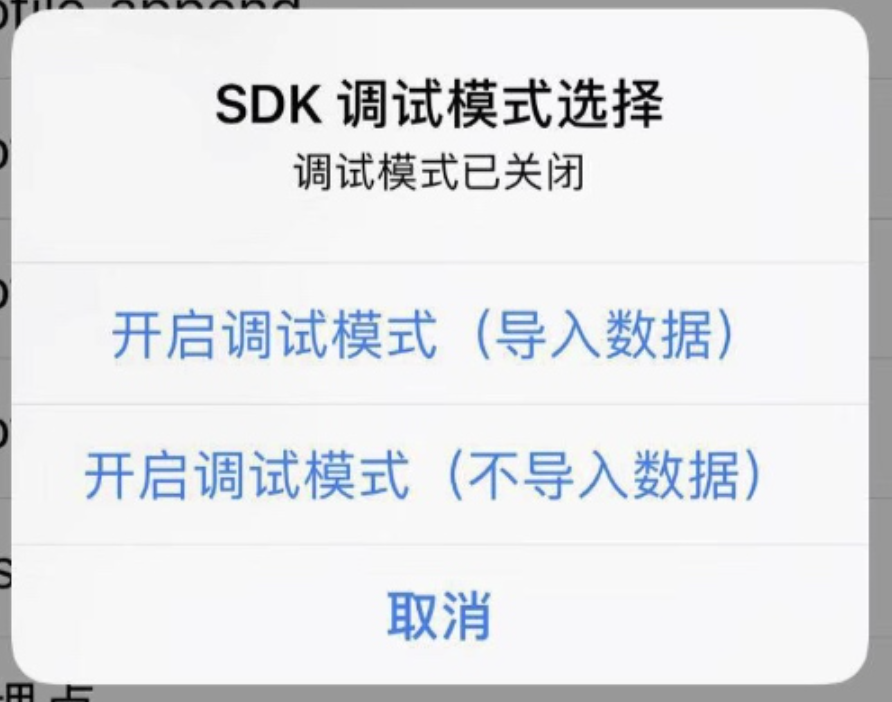
2.3. Select debug mode
After the connection is successful, a pop-up window will be displayed in the App. In the pop-up window, select the debug mode you want to switch.
The two options in the pop-up window are described as follows:
- Debug mode (Import data) : Turn on debug mode, verify the data, and import the data into the genius analysis
- Debug mode (No data import) : Enables the debug mode to verify data but does not import data
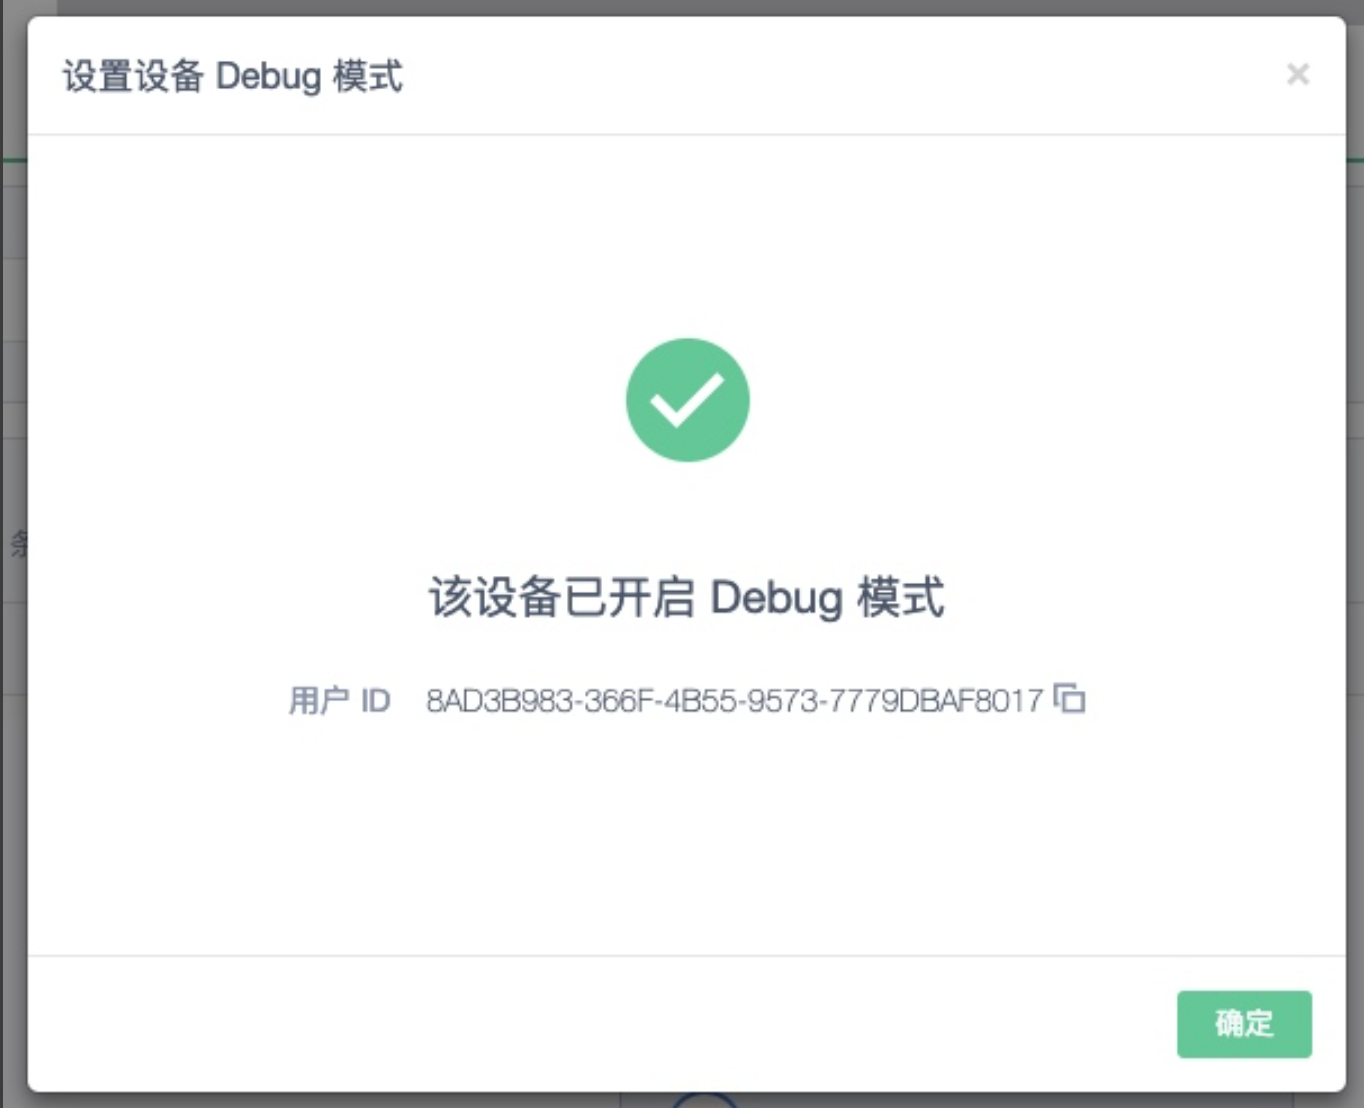
2.4. Gets the ID of the device for which the debug model is enabled
When Debug mode is selected, your device ID can be received in the strategy analysis.
- Click Copy: Click the Copy button to copy the device ID to the clipboard
- Click Ensure: The device ID is directly backfilled into the user ID field of Debug Data
2.5. Use the device ID to query the import information
Click [Start Refresh] to synchronize the data reported in debugging mode in real time.
3. Permission
- Debug real-time data query The user must have Debug real-time data query permission.
4. Common Questions
4.1. How do I exit debug mode?
When the App exits the process from the background or closes the process through the tool, the SDK will automatically turn off the debug mode.
4.2. How to deal with the situation that the QR code/matching code has expired?
After expiration, please refresh the QR code/matching code
4.3. After arousing the App, the App prompts inconsistent items and other errors how to deal with?
The scheme of the current App to be connected is inconsistent with that of the project. Please check the scheme of the current project.
4.4. Which applications do pairing code connections work for?
Pairing codes are only available for Android applications, and are not currently available for iOS applications.
4.5. How long is the validity period of the QR code connected by scanning code?
This parameter is valid for 20 minutes and needs to be refreshed after it expires.
Note: The content of this document is a technical document that provides details on how to use the Sensors product and does not include sales terms; the specific content of enterprise procurement products and technical services shall be subject to the commercial procurement contract.
 Popular Searches