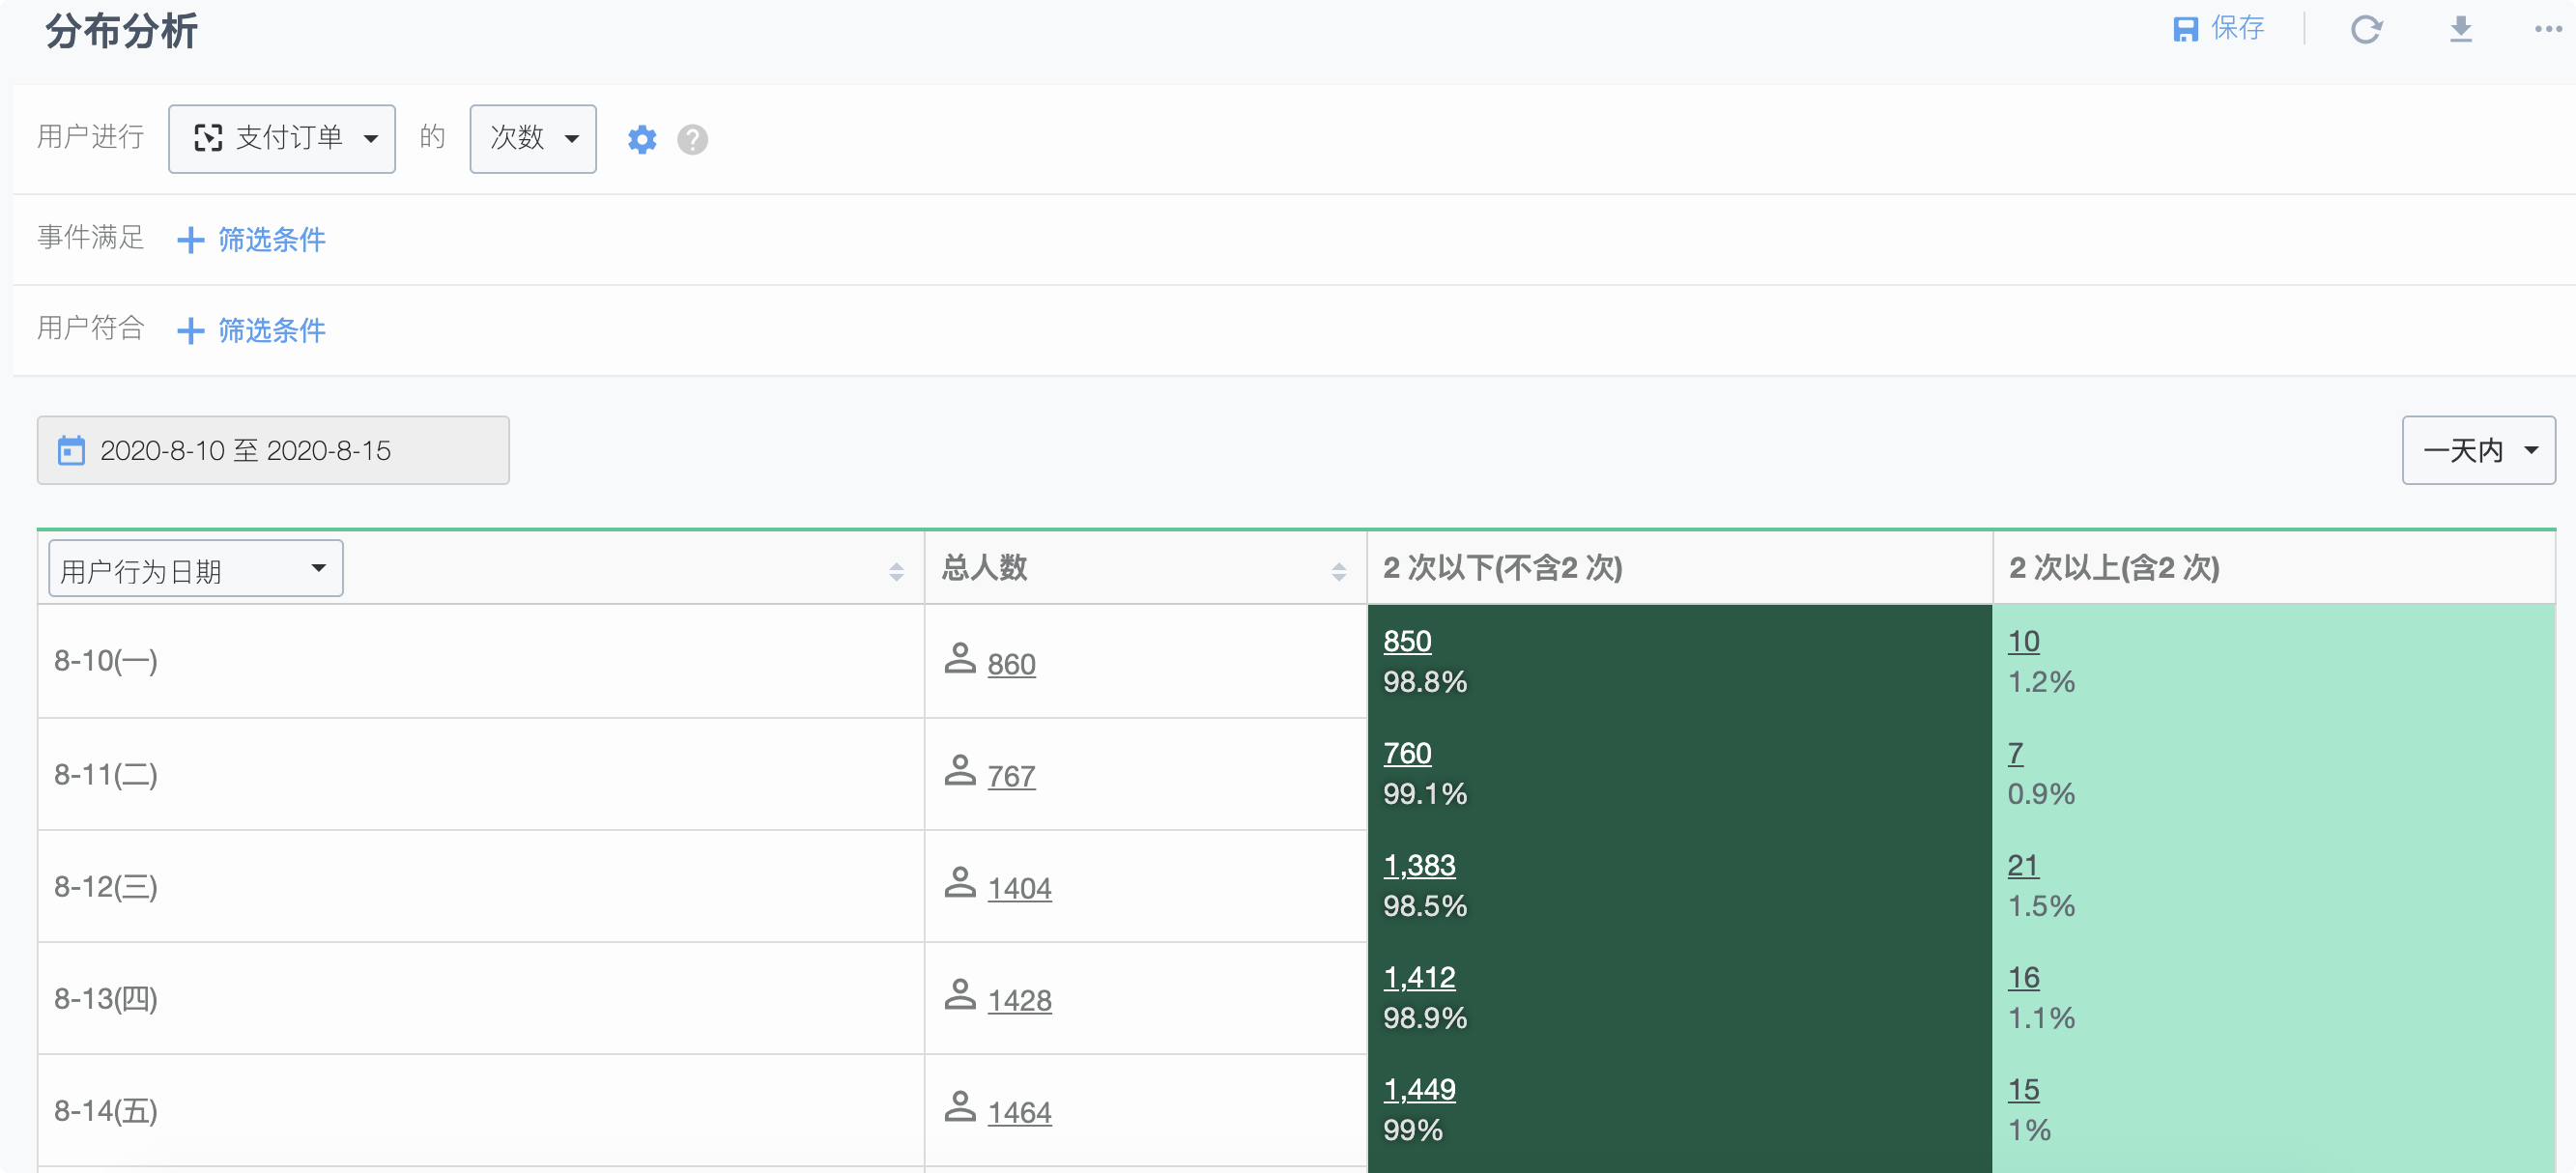
Taking e-commerce as an example, the number of repeat purchases is a common metric to measure user loyalty. Below, we will show how to use distribution analysis to view the number of repeat purchases and drill down by dimensions.

1. Viewing the distribution of user repeat purchases

Based on the above analysis, we want to further explore the common characteristics of the high repurchase rate population and understand whether they show a significant concentration of distribution in certain dimensions. Next, we will perform dimension drill down.

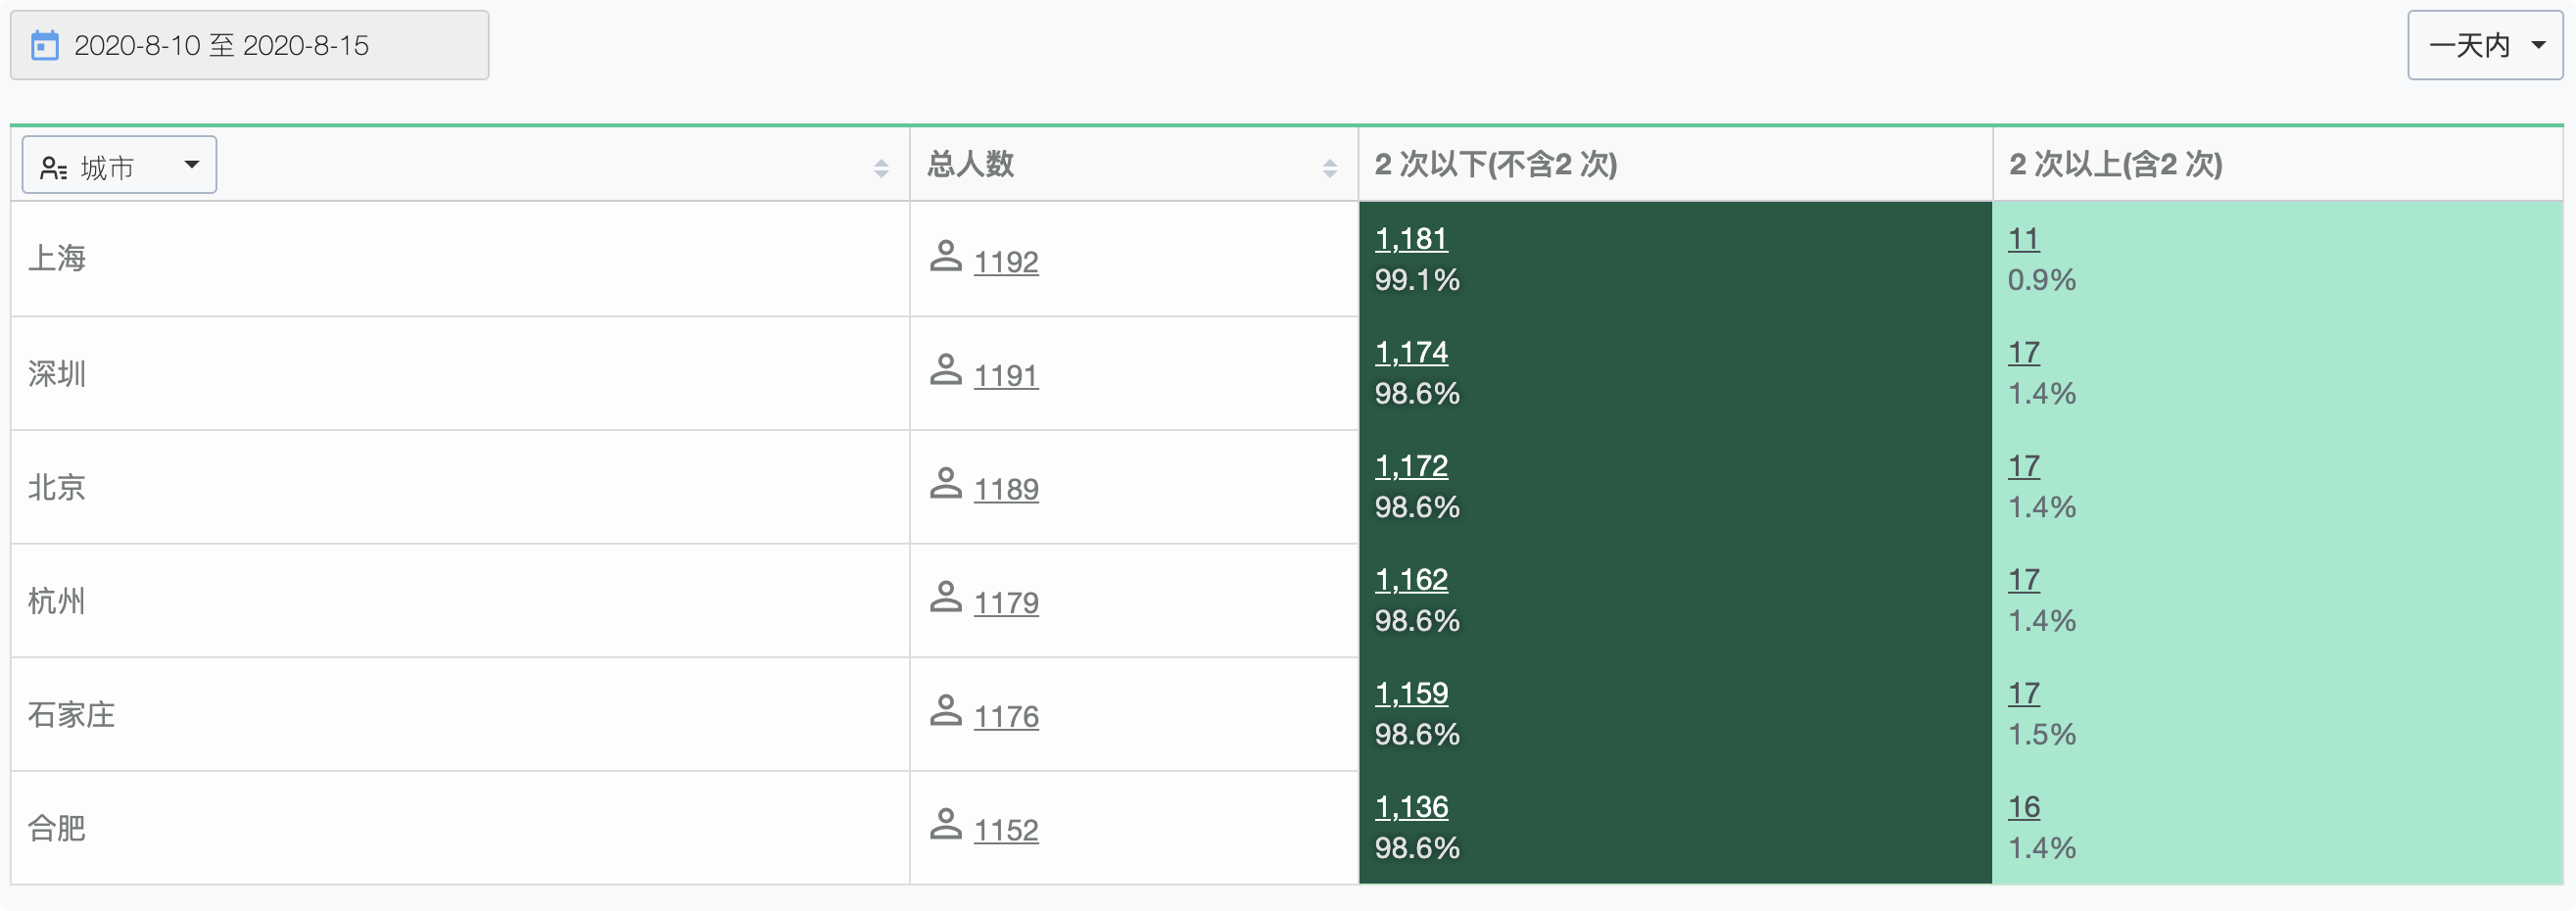
2. Viewing the distribution of repurchase times by city

Based on the analysis above, grouping by the city where the users are located.

3. Viewing the distribution of repurchase times by channel

Grouping by the channel of user registration on the overall basis.

In this way, we can clearly understand which city and which channel have higher user loyalty.