Heat Map Analysis
|
Collect
1. Video explanation
Video explanation of Heat Map Analysis
2. Overview of Heat Map Analysis login
Heat Map Analysis is mainly used to analyze user clicks, depth of interaction and other situations on web pages, and present the results to the user in an intuitive way. For the application of click map analysis, please refer to: How to use click analysis to optimize product experience
3. Introduction to Heat Map Analysis function
3.1. Original page
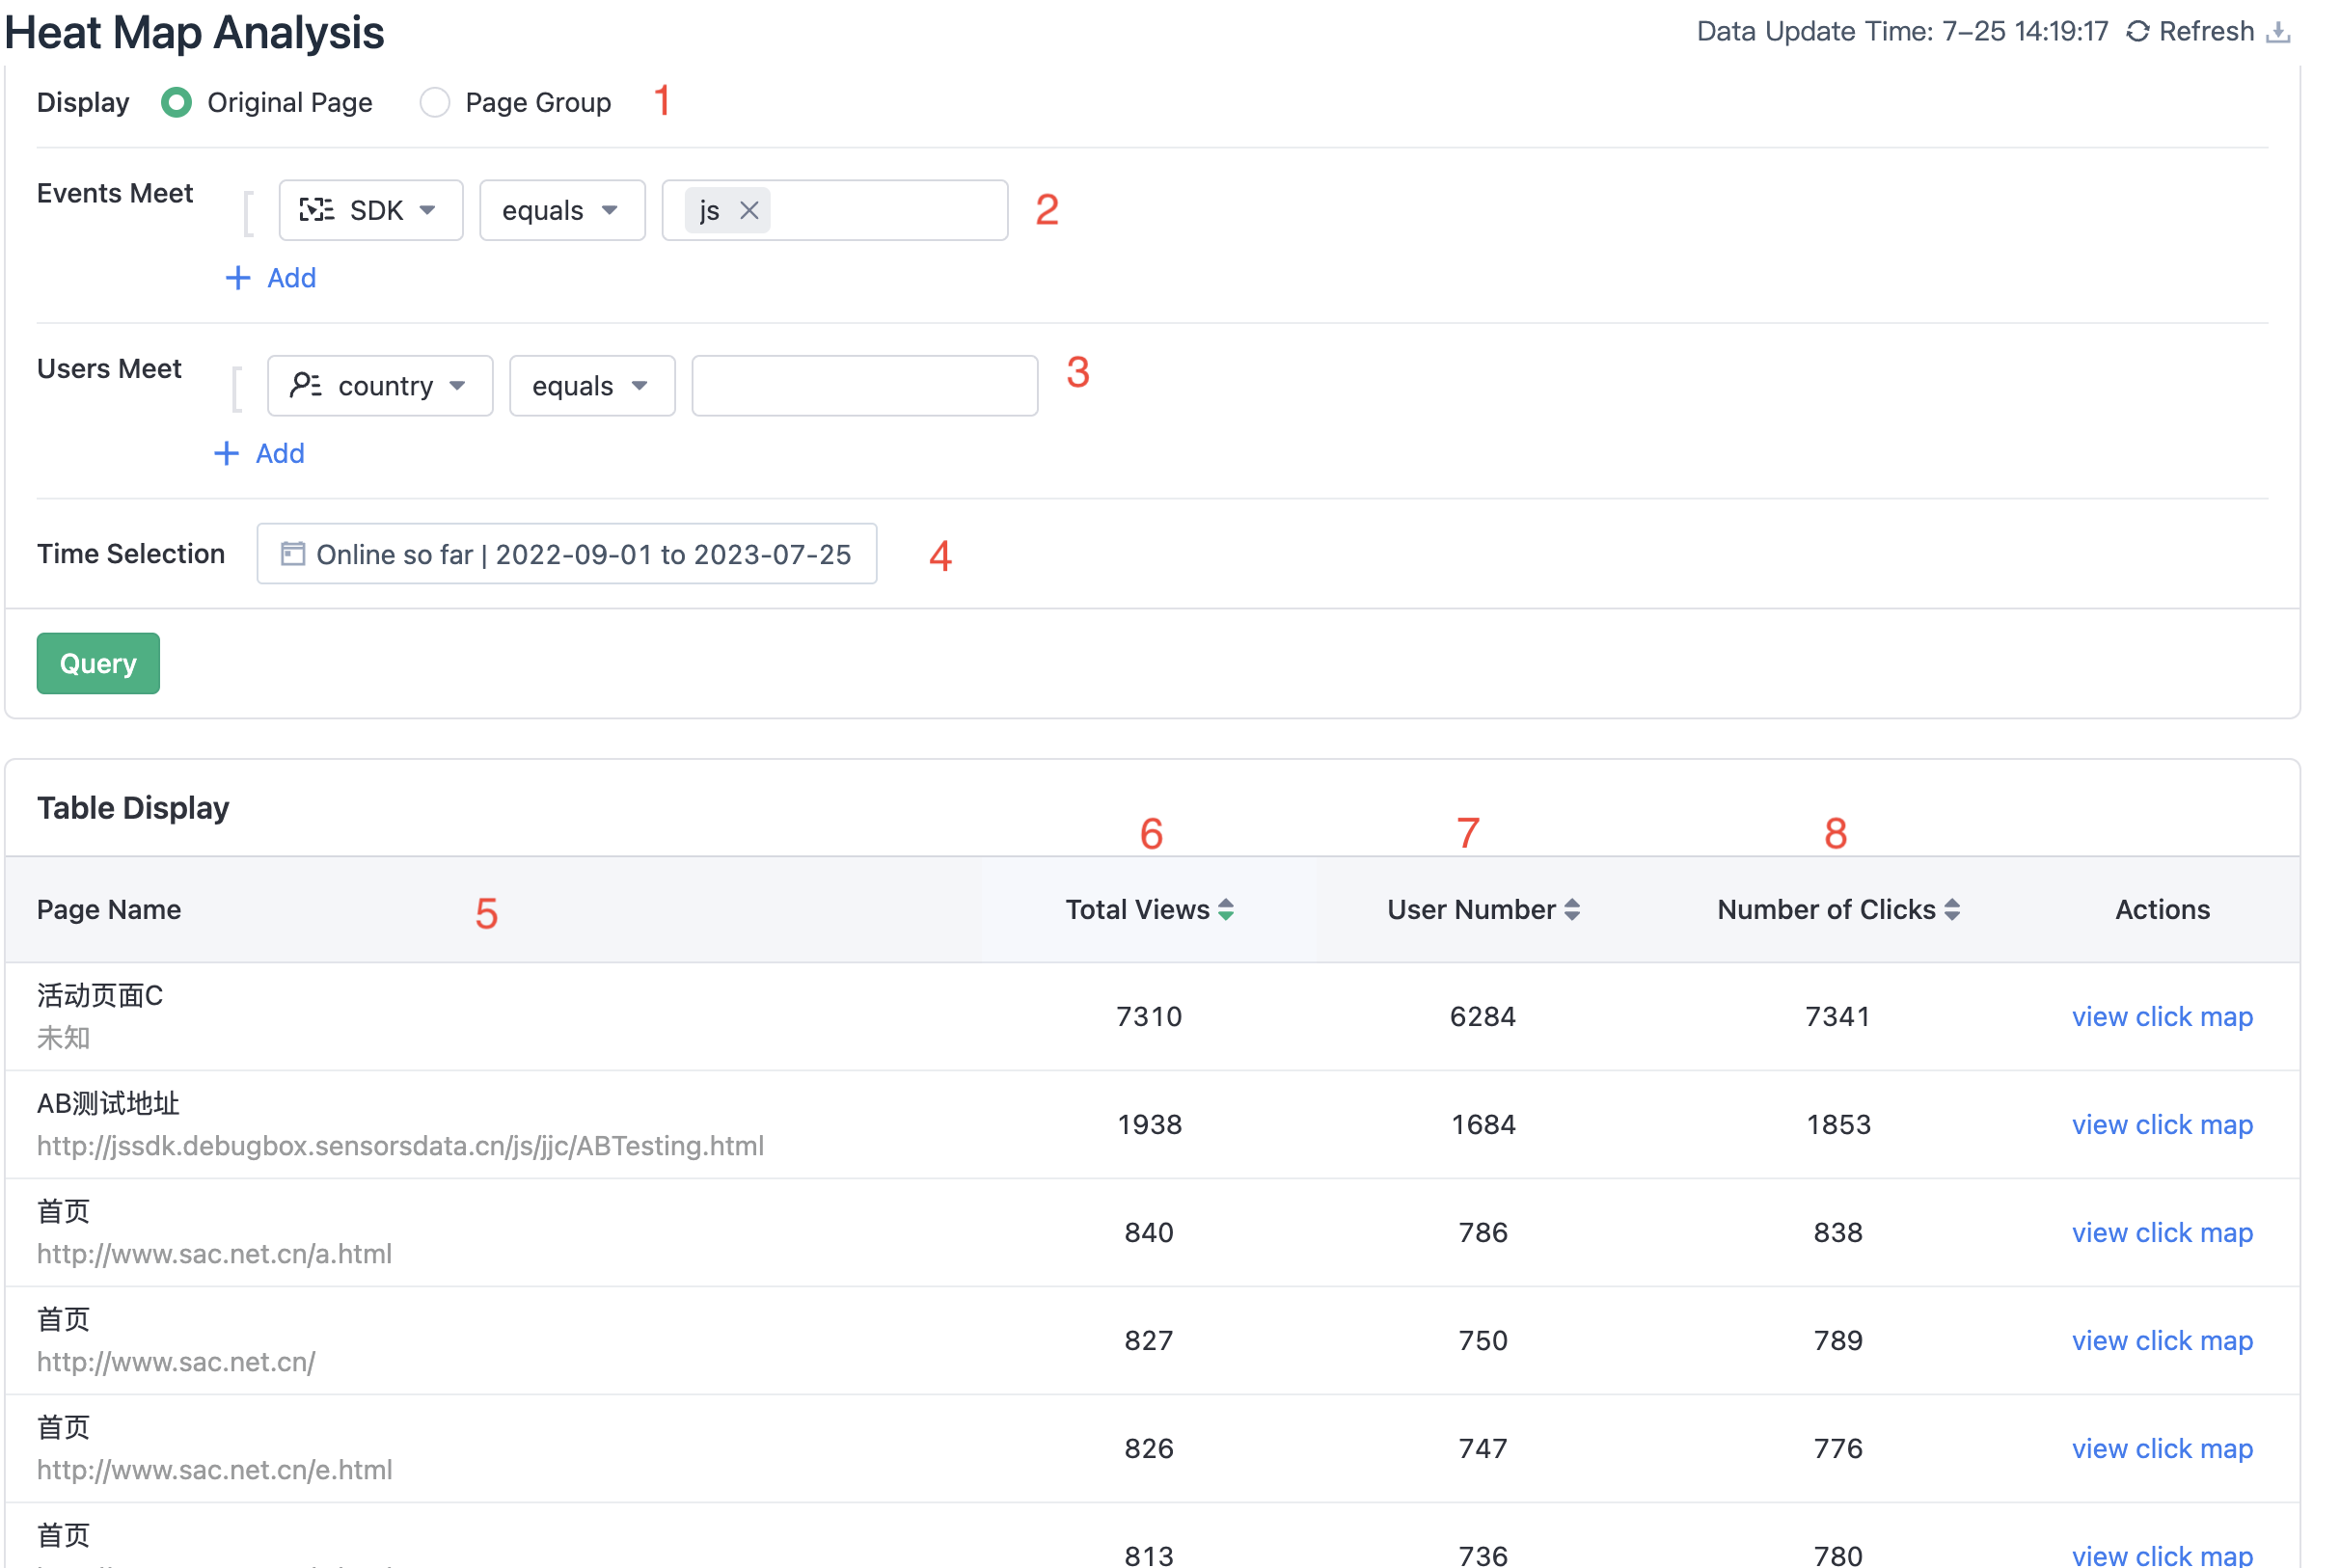
The description of this page is as follows, for the click diagram:
- For click maps, this page is divided into:
Original PageandPage Group.Original Pageis used to analyze the click situation of a single page, andPage Groupis used to analyze the browsing and clicking situation of a series of webpages with similar structures as a whole (for example, the product detail page of Jingdong can be analyzed as a wholePage Group). - Event filtering condition: Like all other analysis functions in Sensors Analytics, Heat Map Analysis can also be filtered based on the attributes of the event, only displaying events that meet the filtering conditions. It should be noted that the filtering condition for click analysis is the public properties of event
Web Element ClickandWeb Pageview. - Filter by user: Like all other analysis functions in Sensors Analytics, Heat Map Analysis can also be filtered based on user attributes.
- Select the occurrence time of the event
Web Element Click, and analyze only the user click situation during this time. - This area is sorted by page views by default, and can also be sorted by browsing users and element click times. The page name refers to the page title we collect.
- Page views: The total number of Web Pageview events (PV) for this page.
- Users: The number of users who click the various interaction elements on this page, i.e. the number of users who trigger the events Web Element Click .
- Clicks: The total number of clicks on various interaction elements on this page, i.e. the total number of events
Web Element Clickon this page.
3.2. Page Group
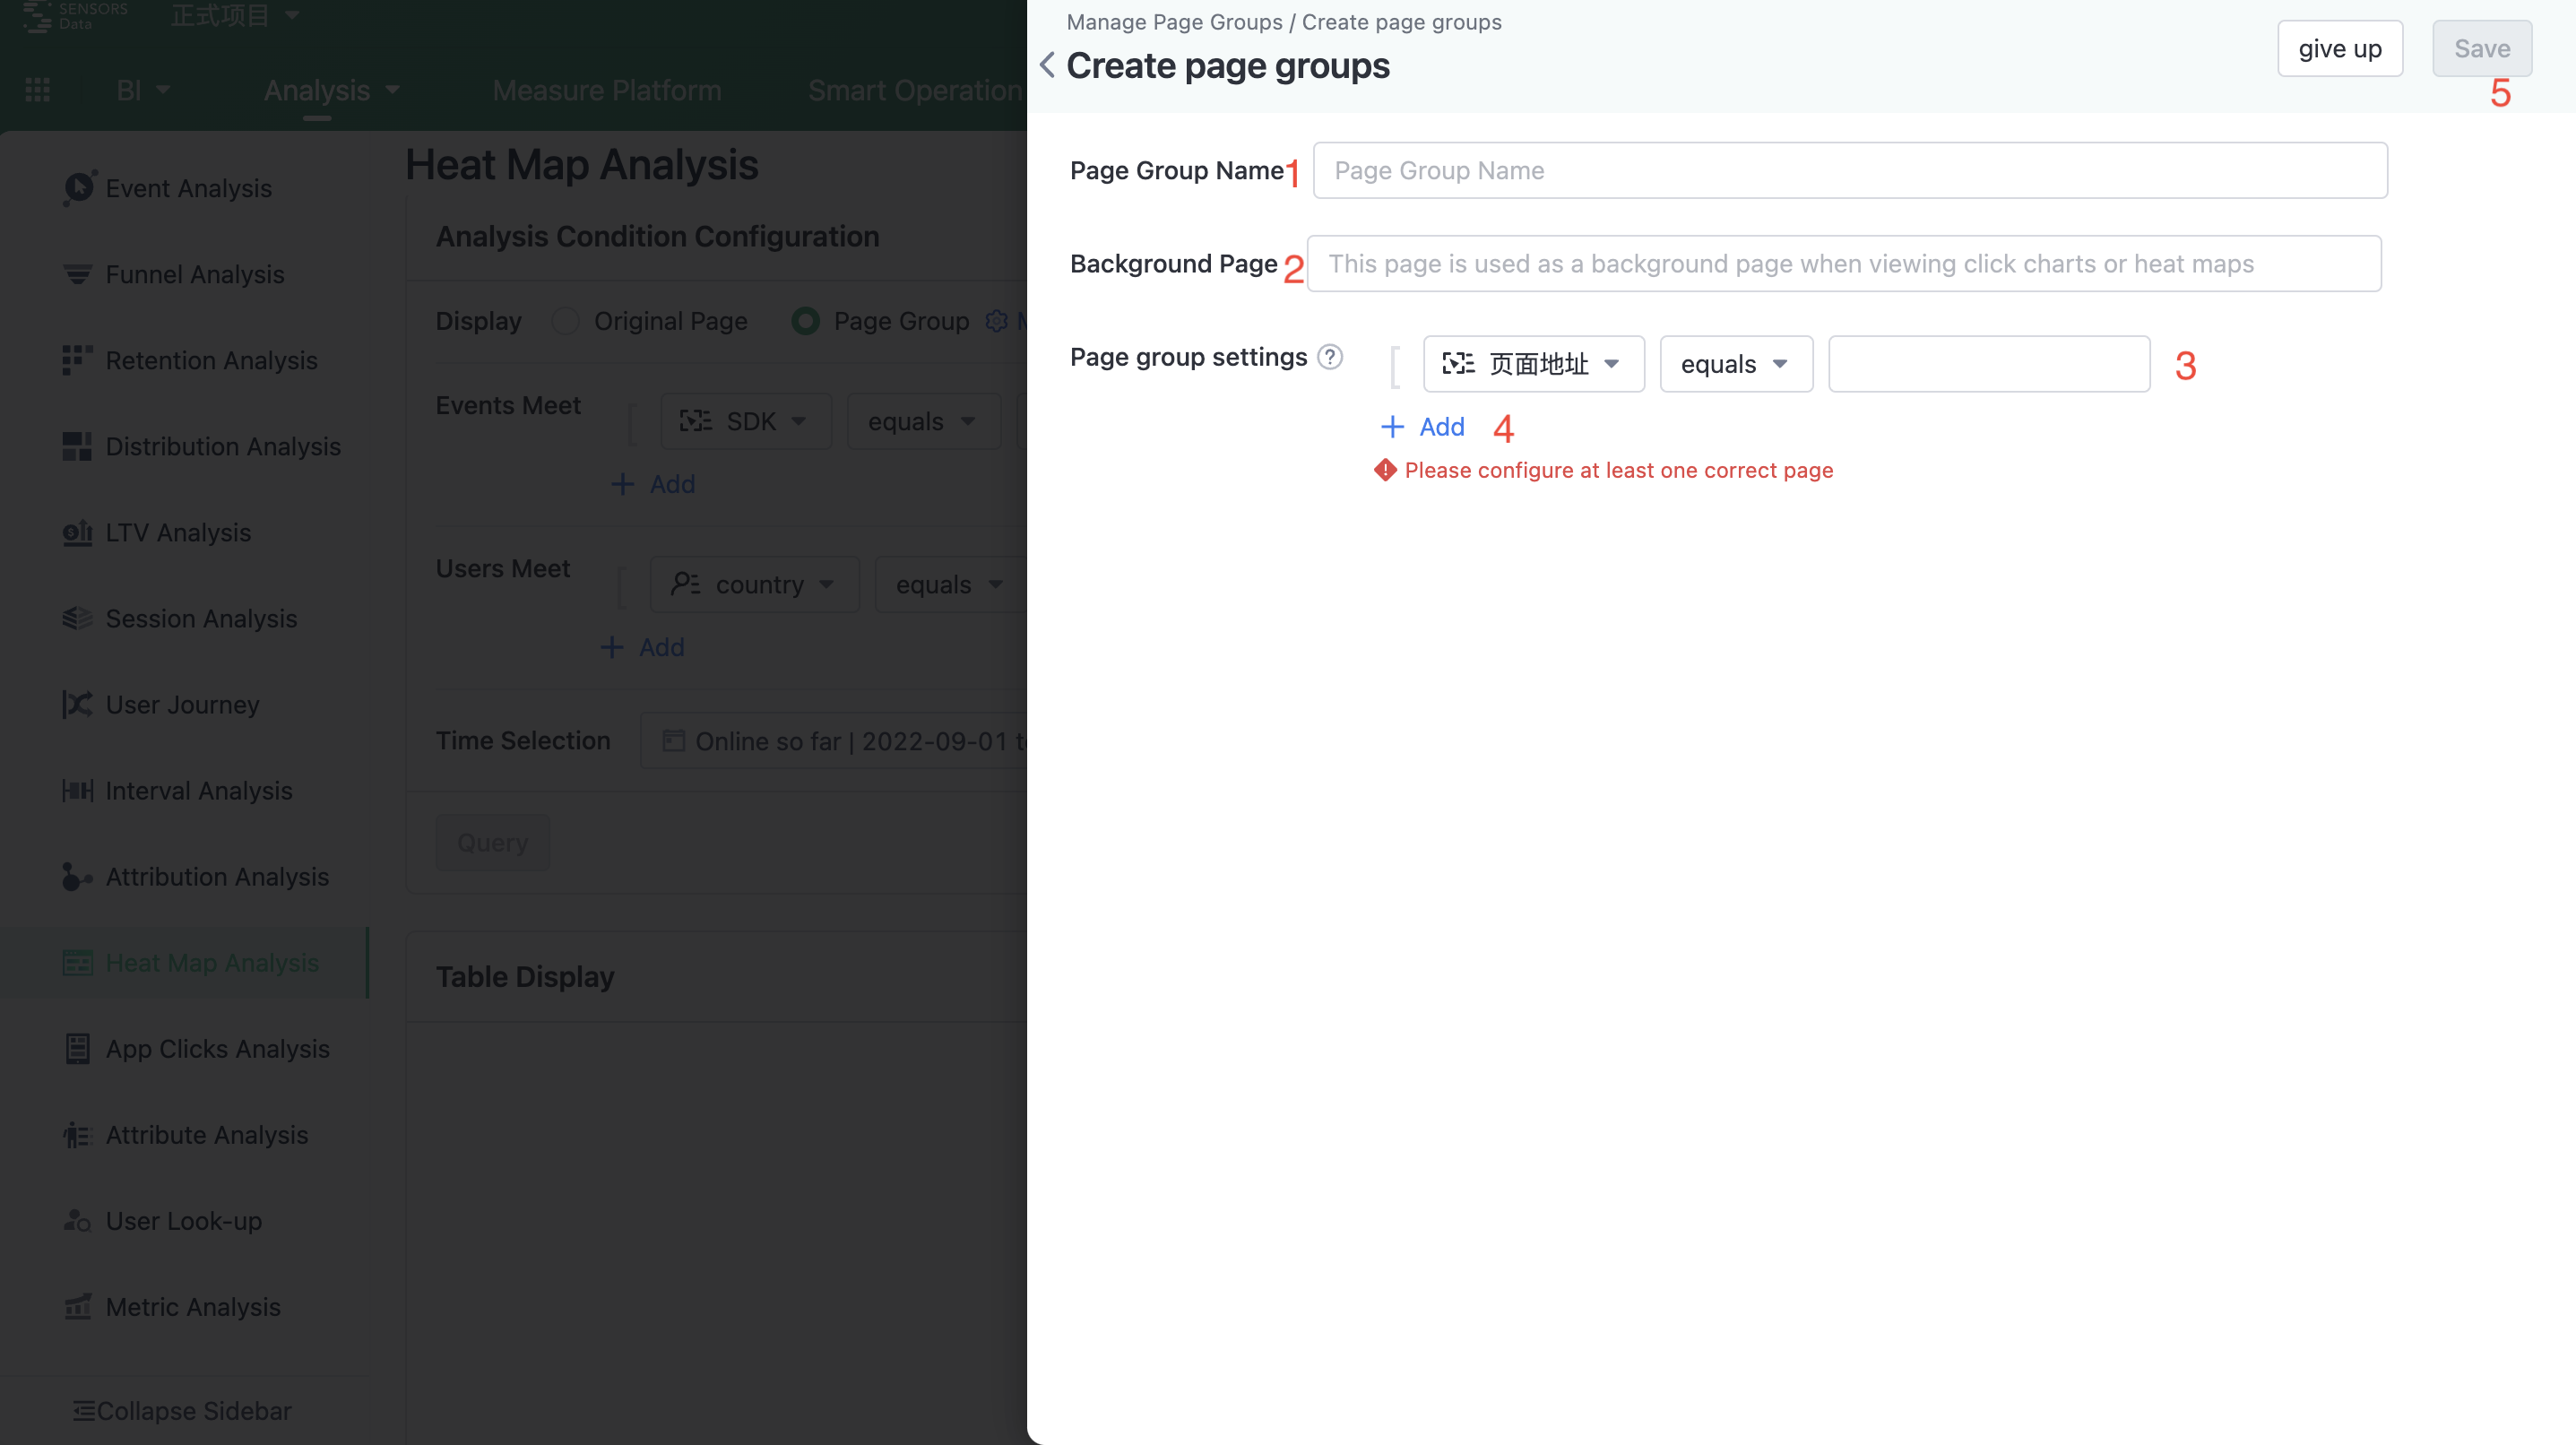
Explanation of this Page Group:
- Give the Page Group a name.
- Background page, specify a specific page address as the template page for click map display.
- Select the page address to be added, which can be matched using inclusion and regular expressions.
- Multiple filtering conditions can be selected.
- Save this Page Group.
4. Click Map Usage Instructions
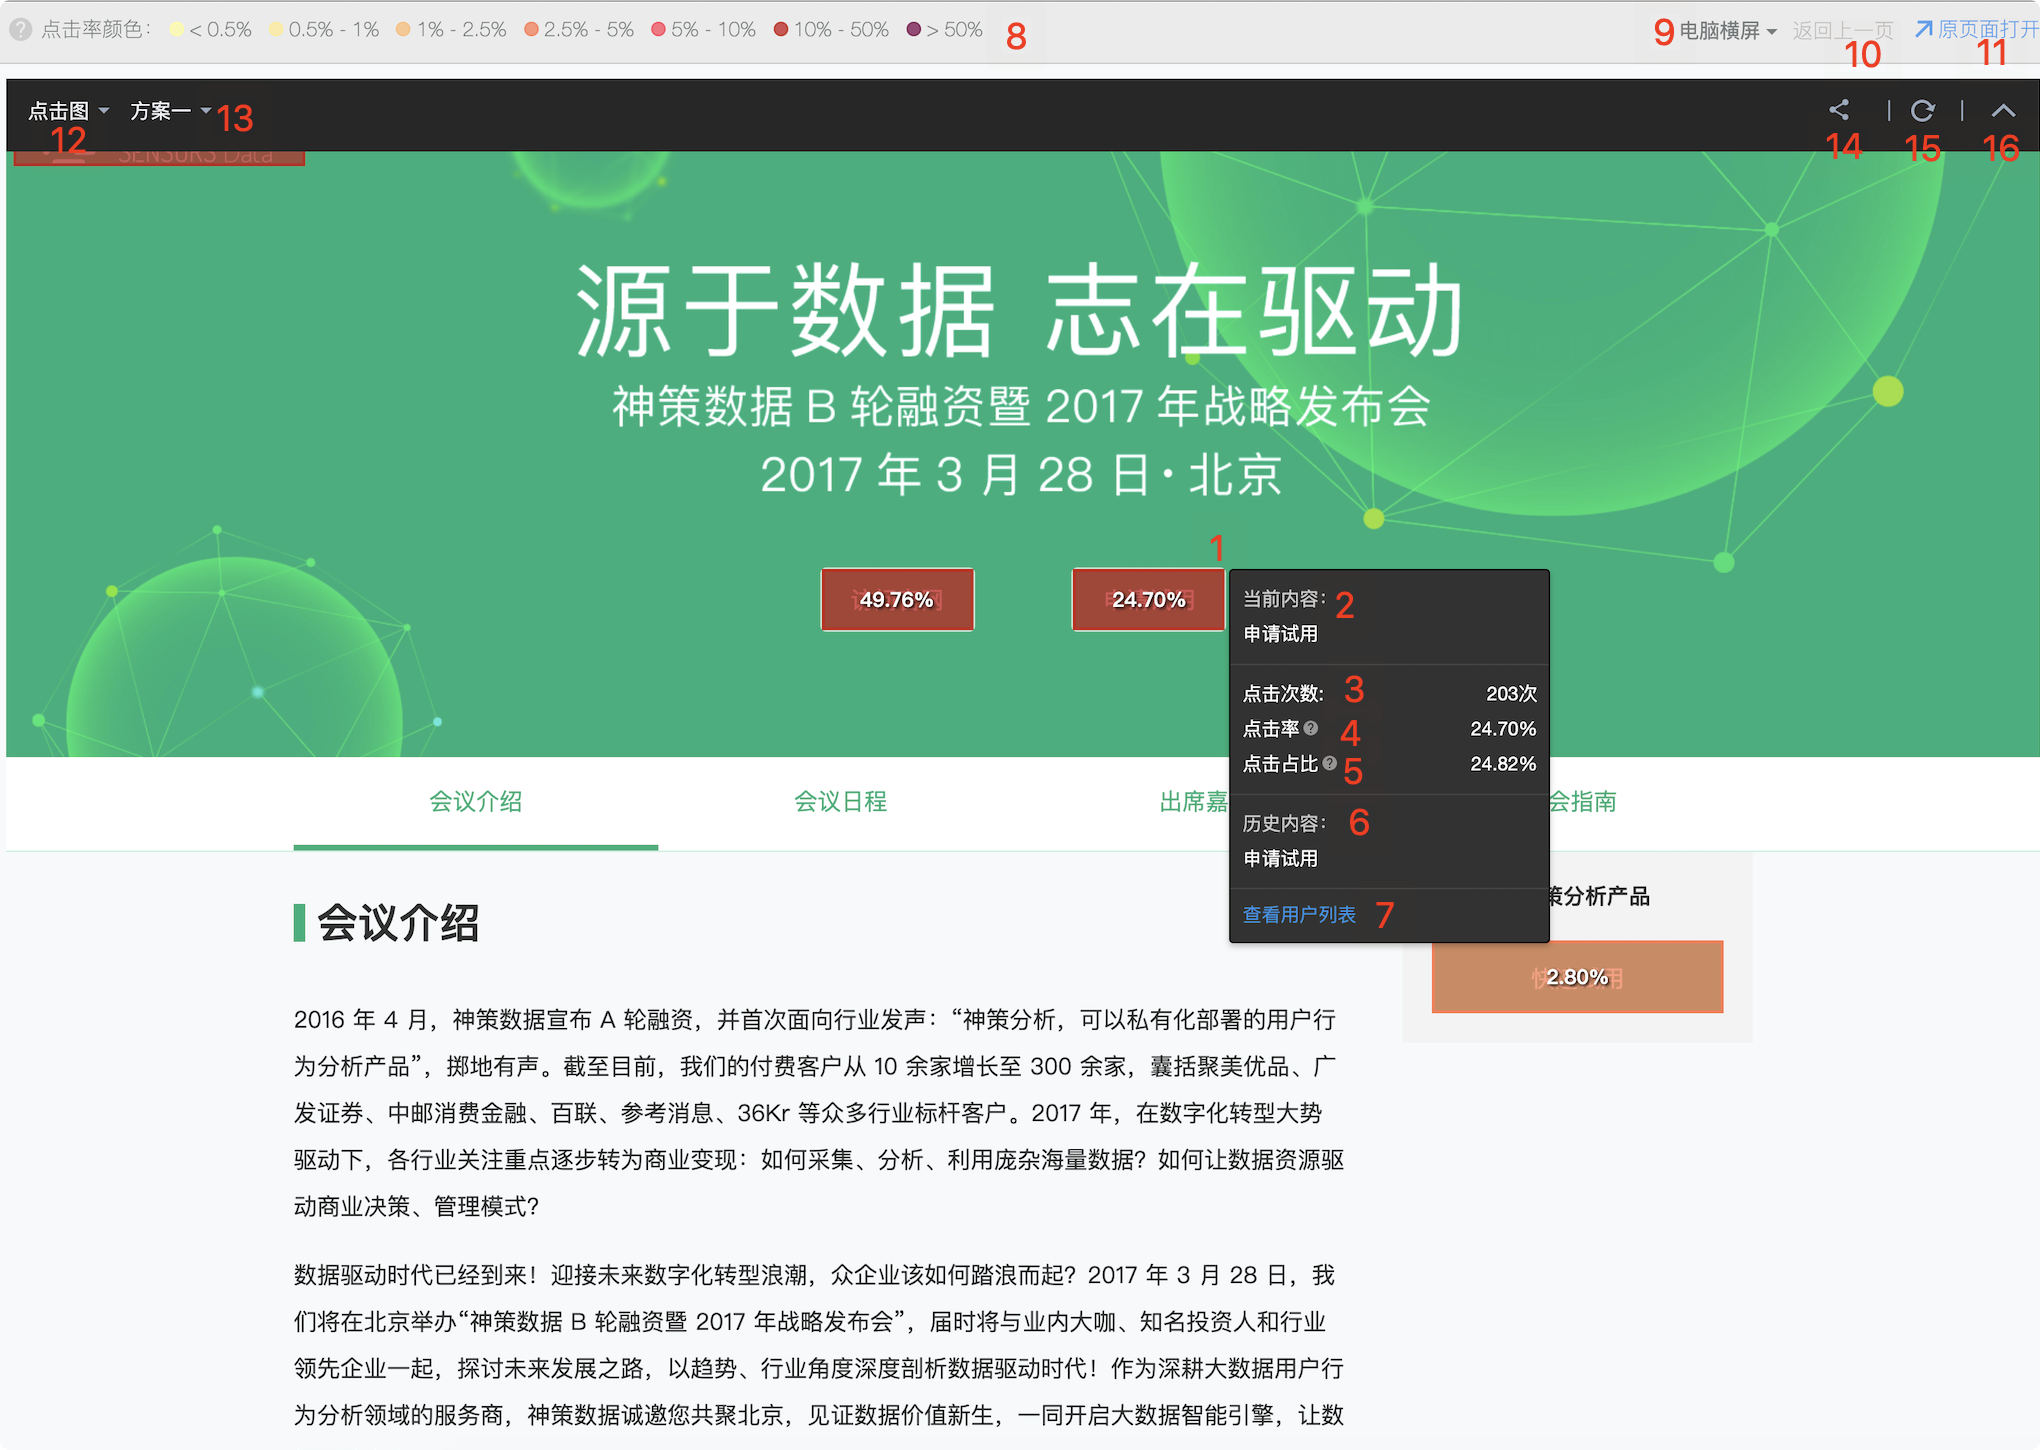
Here, we use the Sensorsdata's official website as a template page (click data is simulated) to introduce the specific use of the click analysis function:
- Indicates the interactive element that has been clicked. The 24.70% displayed here is the click-through rate. When hovering the mouse over these clicked buttons, a click details information box will appear. If you click on this interactive element, the interaction will follow the logic of the original page;
- The current element content refers to the text content inside this interactive element;
- The number of clicks represents how many times this button has been clicked;
- The click-through rate is the number of clicks for this element/total page views (PV);
- The click-through proportion is the number of clicks for this element/all visible elements on the entire page;
- The historical content indicates the most frequently appearing value of this button in history. For example, if it is news, the news in the headline position is different every day;
- Click the user list to see which specific users have clicked this button;
- The legend corresponding to the click-through rate;
- Switch the display schemes under different screen sizes;
- Click on an interactive element on the current page, and you can click here to return to the previous page after page redirection;
- Open in a new window and display the click map directly in the original page, which makes it more natural to view the data;
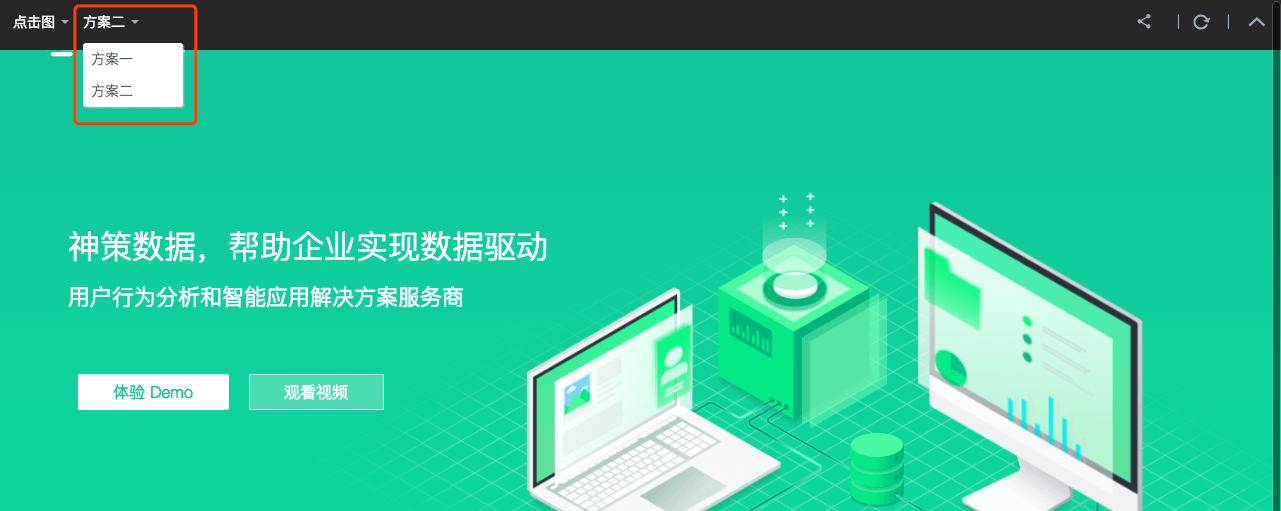
- Select the click map and reach rate graph in the drop-down list;
- Switch different schemes of the click map;
- Share the current page;
- Refresh the data on the current page;
- Collapse the toolbar.
5. Click Map different version switching (supported with version 1.12.1 and above)
5.1. (I) The difference between the two click maps
5.1.1. The first version of the click map
Change the style on the clicked element itself, and add styles to the element by adding after and before pseudo-elements. Also, all a tags will be changed to the inline-block style.
If the clicked elements on the page had after and before styles originally, conflicts in style may arise, causing some elements on the page to not have a click map, or resulting in changes in the page structure.
5.1.2. The second version of the click map
Generate a layer click map on the top of the page based on the relative position of the clicked element on the screen; the click map will be re-rendered every time the scrollbar is scrolled or the page size is changed.
The second version of the click map does not modify the original style of the clicked element, effectively avoiding style conflicts.
The second version of the click map will not render hidden elements; however, for some elements hidden by their parent elements using overflow:hidden and other methods, it cannot determine whether they are hidden or displayed, so it will render them as well.
5.2. (2) Switching Click Map Methods
1. Switch via the first/second version button in the upper-left corner.
2. Switch via the shortcut keys on the keyboard.
'z' key: First version click map
'x' key: Second version click map
5.3. Method to Refresh Click Map
The second version of the click map renders clicked elements based on their relative position on the screen, so the click map data will be re-rendered every time the scrollbar is scrolled or the page size is changed. Please refer to the JS SDK document for the relevant parameter settings of the rendering delay renderRefreshTime.
The second version of the click map only renders visible elements. For some elements that are hidden or displayed manually (such as drop-down menus), you need to manually refresh the click map when displaying the element.
1. Refresh the page and re-render the click map data via the refresh button in the upper-right corner.
2. Refresh the click map data via the 'r' key on the keyboard.
5.4. Precautions
The second version of the click map can solve the problem of style conflicts in the first version of the click map (such as conflicts caused by the 'after' and 'before' pseudo-classes, or the abnormal style caused by inline-block).
The second version of the click map cannot determine whether some elements are hidden or displayed, such as when the display of the child elements is controlled by the parent element's height or overflow:hidden. In this case, the second version of the click map will render all elements judged to be displayed on the page. If the second version of the click map affects your page display, please switch to the first version of the click map.
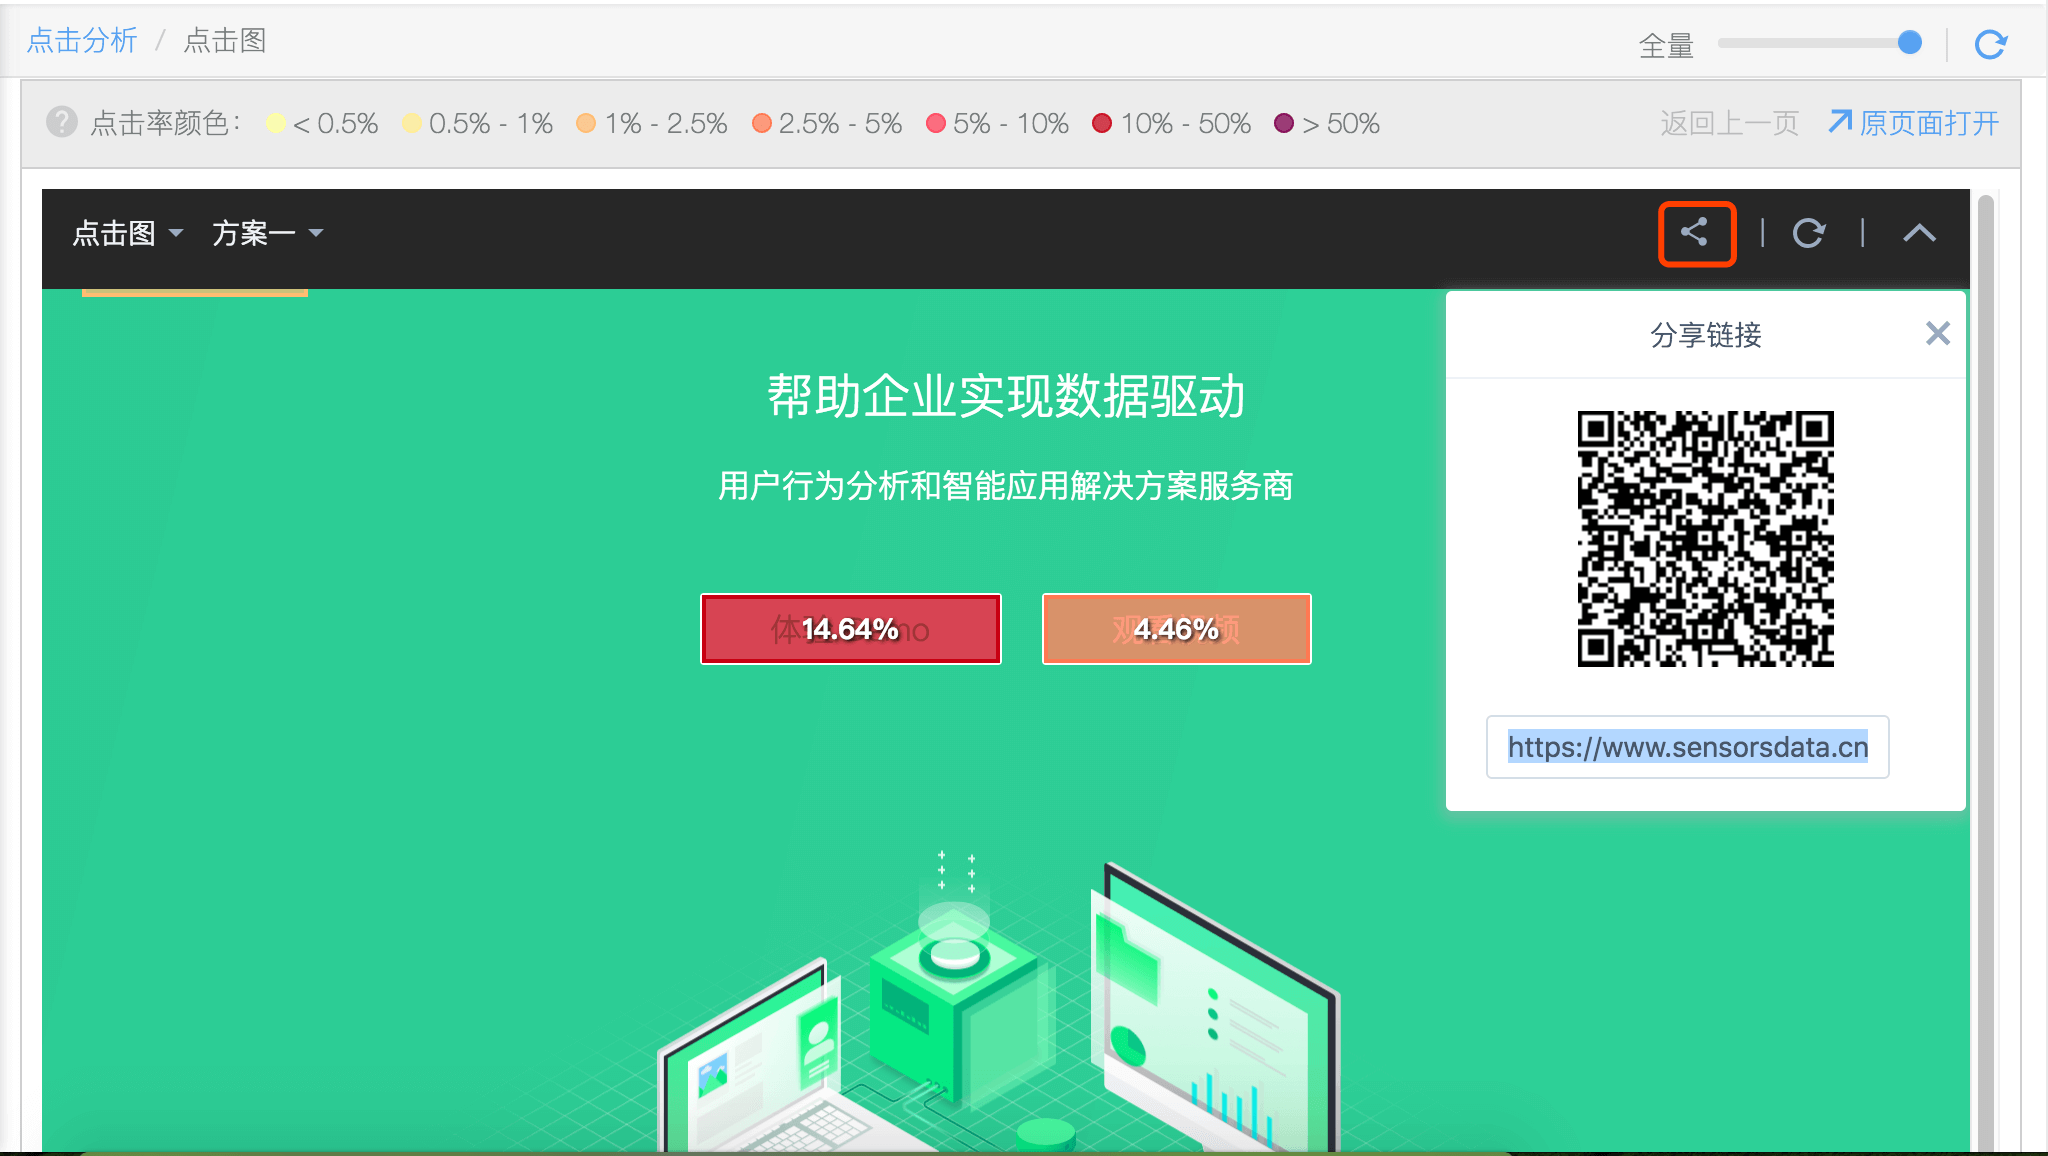
5.4.1. Share Button
Currently, the pre-set $WebClick click event data is collected on various devices with different screen sizes. However, the display of click analysis is shown on a single screen (usually the PC end).
Solution 1: Click the share button and scan the QR code with your mobile device to view the click analysis on a mobile device. We will develop a display solution based on multiple screen sizes in the future, so stay tuned.
6. Instructions for Touch Rate Graph
Effective Stay: Refers to the user paying attention to the webpage area without scrolling during this period. During this period, the mouse can be moved, and clicks and other operations can be performed.
Effective Stay Time: The stay time exceeds the specified time limit (default 4 seconds in the JavaScript SDK, which can be set).
Even if the page scrolls, the previous effective stay period is still valid, that is, if it lasts for more than the default 4 seconds or any user-defined time, the JavaScript SDK will still send a page stay event.
Touch rate refers to the proportion of users who reach a certain position on the webpage under the current filter condition. Sensors Analytics calculates the touch depth of the webpage by counting the deepest position that users reach when visiting the website to generate the touch rate graph, which can be used to analyze the browsing depth of users on detail pages, landing pages, etc., and help optimize the content and structural design of webpages.
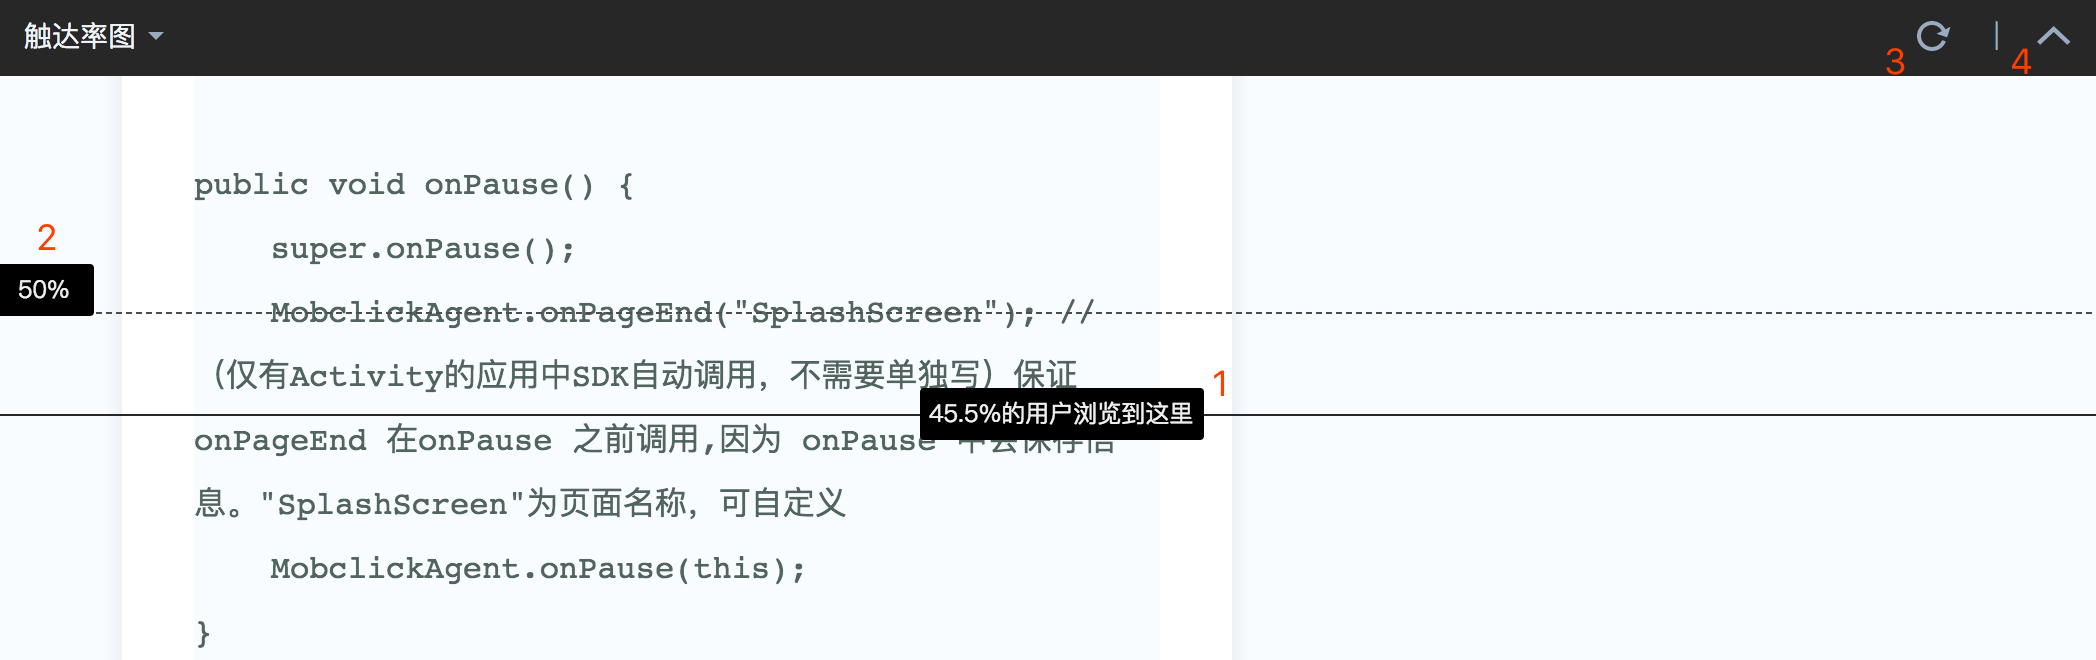
This is to introduce the reach analysis based on a template page (using mock data) on the official website of Sensors Data:
- Represents the percentage (in percentage form) of users who reached the current location under the current filtering conditions.
- It represents the baseline of reach rate for the current page.
- Refreshes the data for the current page.
- Collapse (pull down) the operation toolbar.
The data in the reach diagram is calculated by UV, which is calculated based on the maximum height of a person's reach for this web page.
7. FAQ
To be added
Note: The content of this document is a technical document that provides details on how to use the Sensors product and does not include sales terms; the specific content of enterprise procurement products and technical services shall be subject to the commercial procurement contract.
 Popular Searches