How does Sensors analytics solve problems?
|
Collect
In the previous article, we saw that Sensormatic can support the problem analysis process for different business roles.
Here, we take the e-commerce industry as an example to introduce how Sensormatic helps product, operation, and channel delivery business personnel to quickly analyze data.
1. Standard e-commerce core process
E-commerce users usually go through the following core behavior process:
- Start the app
- Start browsing the homepage
- Click and browse the product details page
- See suitable products and add them to the shopping cart
- Have the intention to purchase and submit an order
- Decide to make payment and pay the order
The core process of the product can be described as:
Start the app - Browse the homepage - Browse the product details page - Add to shopping cart - Submit the order - Pay the order
2. Common data analysis issues in the e-commerce industry
In the specific work of the e-commerce industry, channel delivery business personnel focus on the number and quality of customer acquisition from each channel, operation personnel focus on how to segment users and conduct targeted operations, and product personnel focus on the conversion of each core process and the user experience of each function. Here are the main analysis requirements:
- How many new customers does each promotion channel acquire? Which channel has the strongest ability to acquire customers?
- Is there any difference in the performance of users from different channel sources from app activation to payment?
- What could be the reasons for users to drop out during the payment process?
- What can I do to address the issue of users dropping out during payment?
- How can I comprehensively monitor the number and quality of customer acquisition from each channel?
Let's now explore how to obtain answers to the above questions.
3. Sensor Analytics Solution
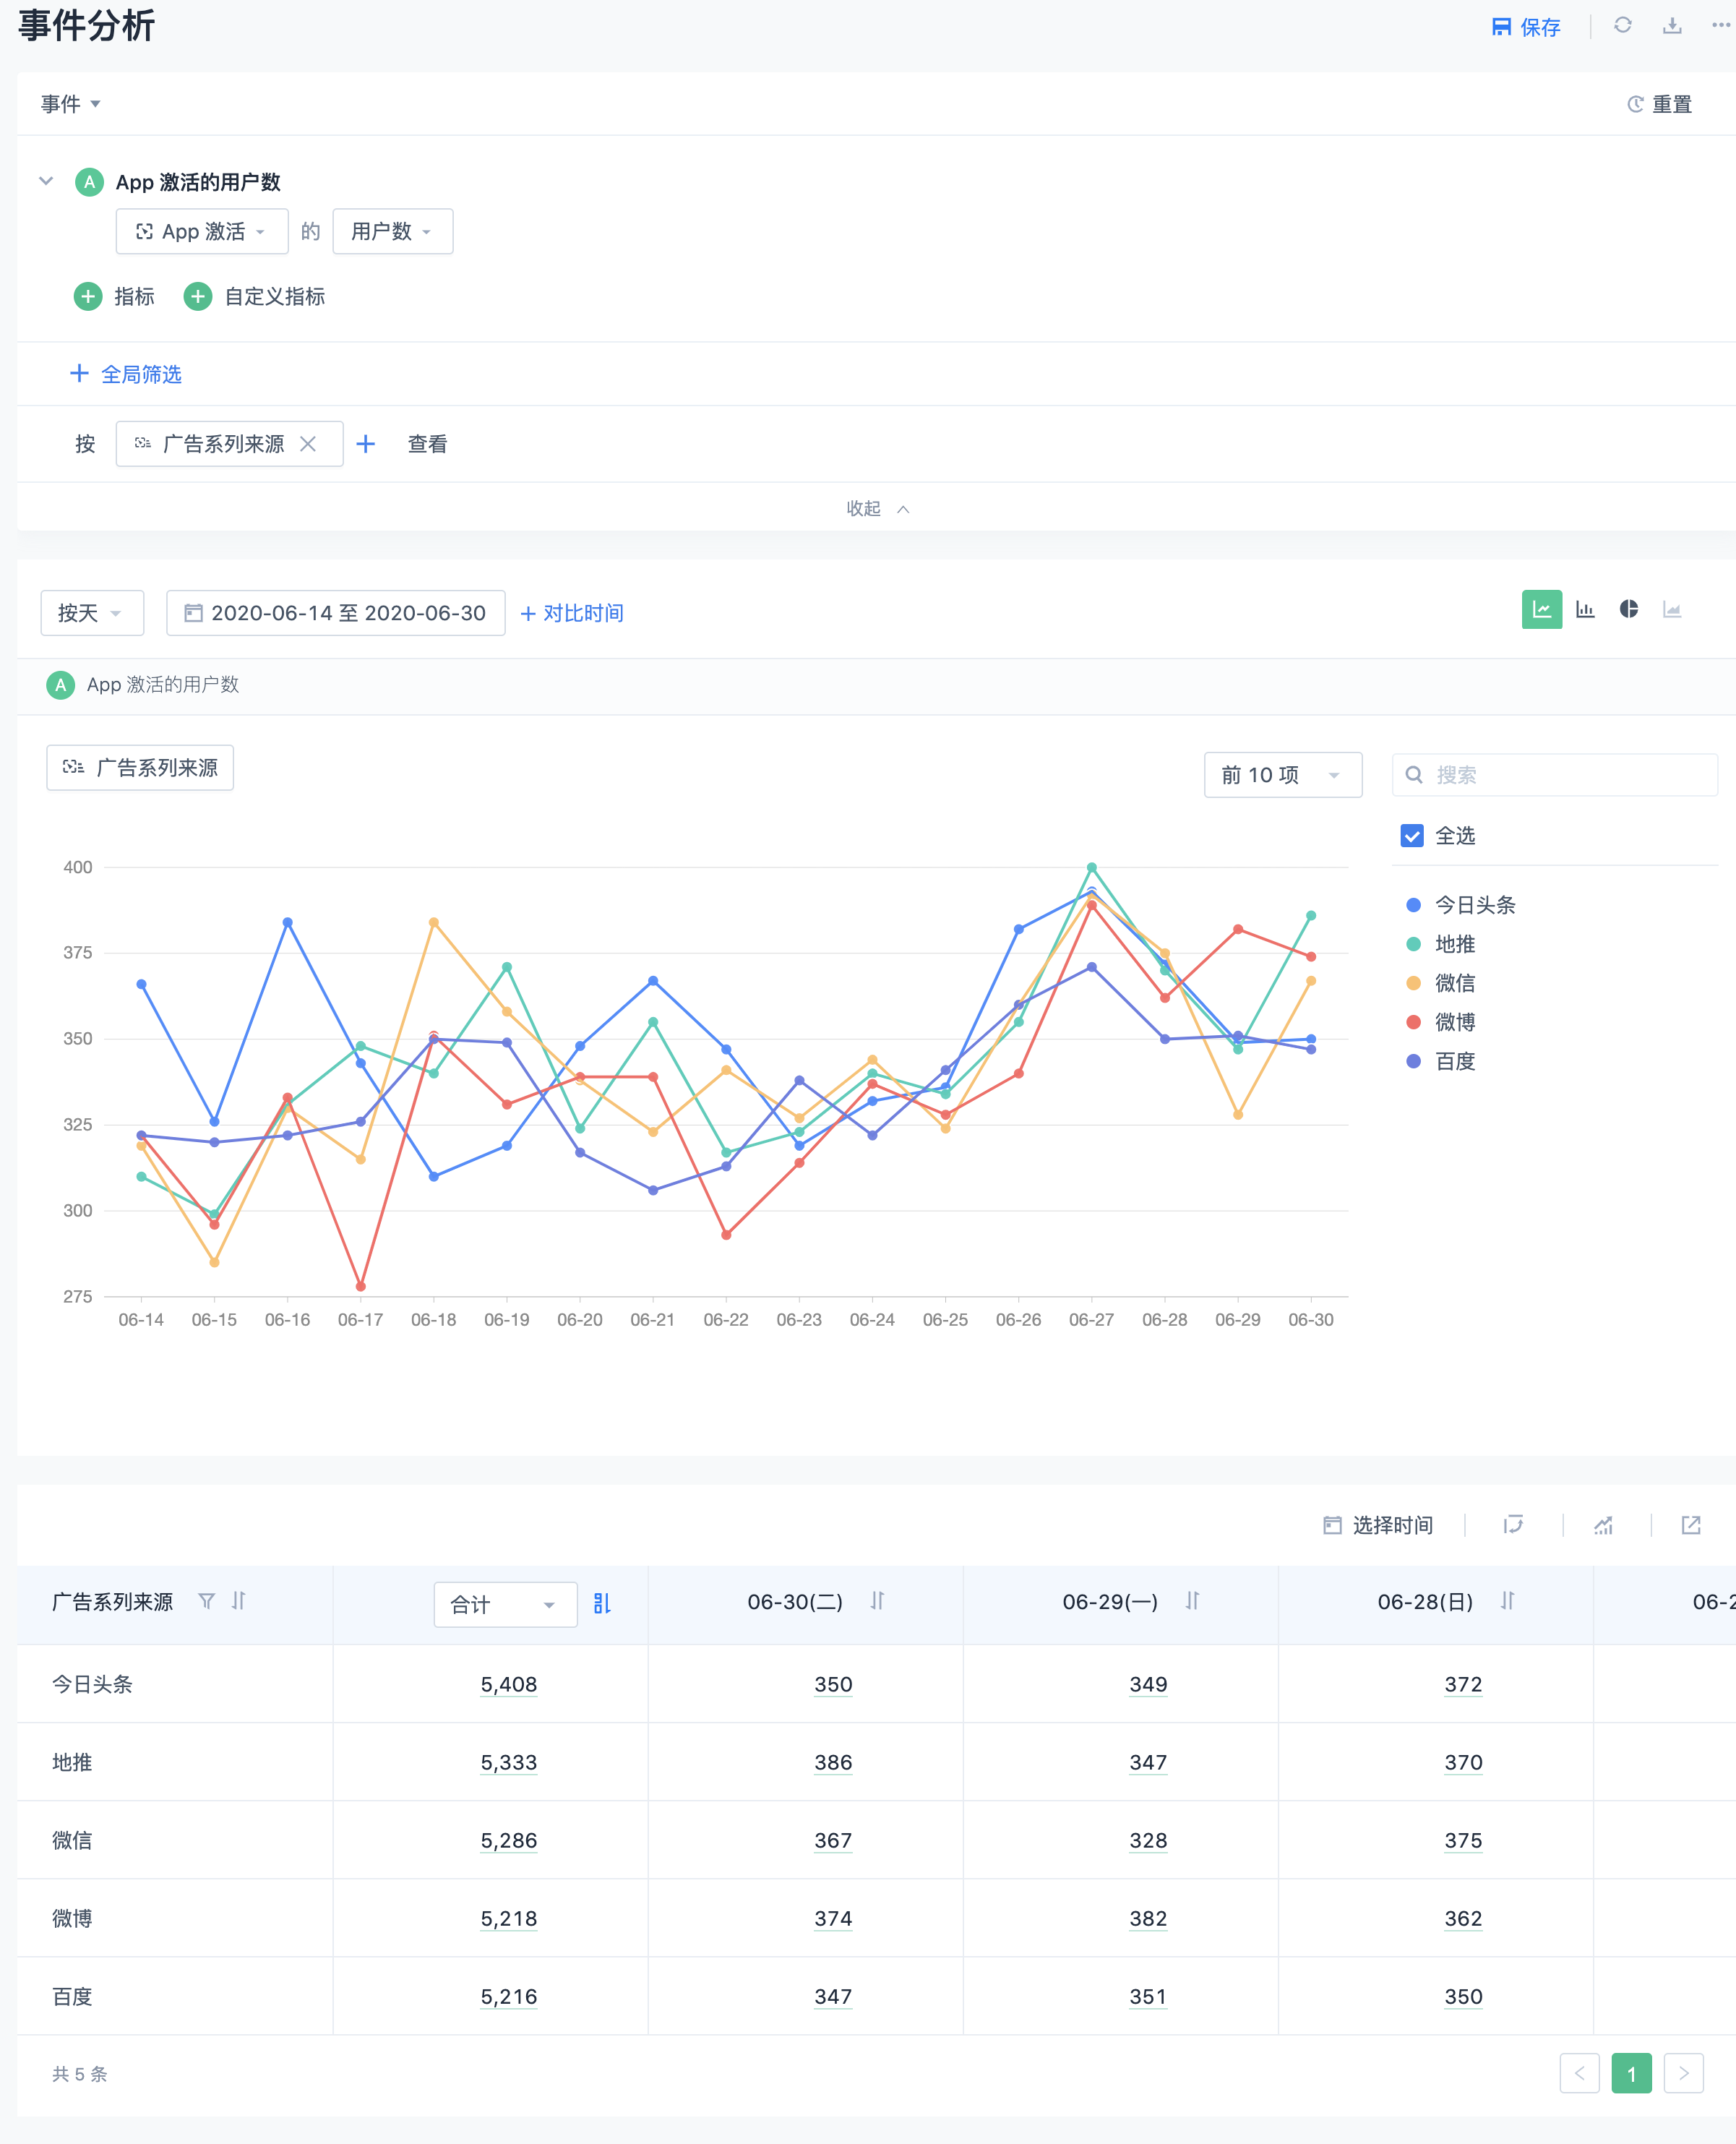
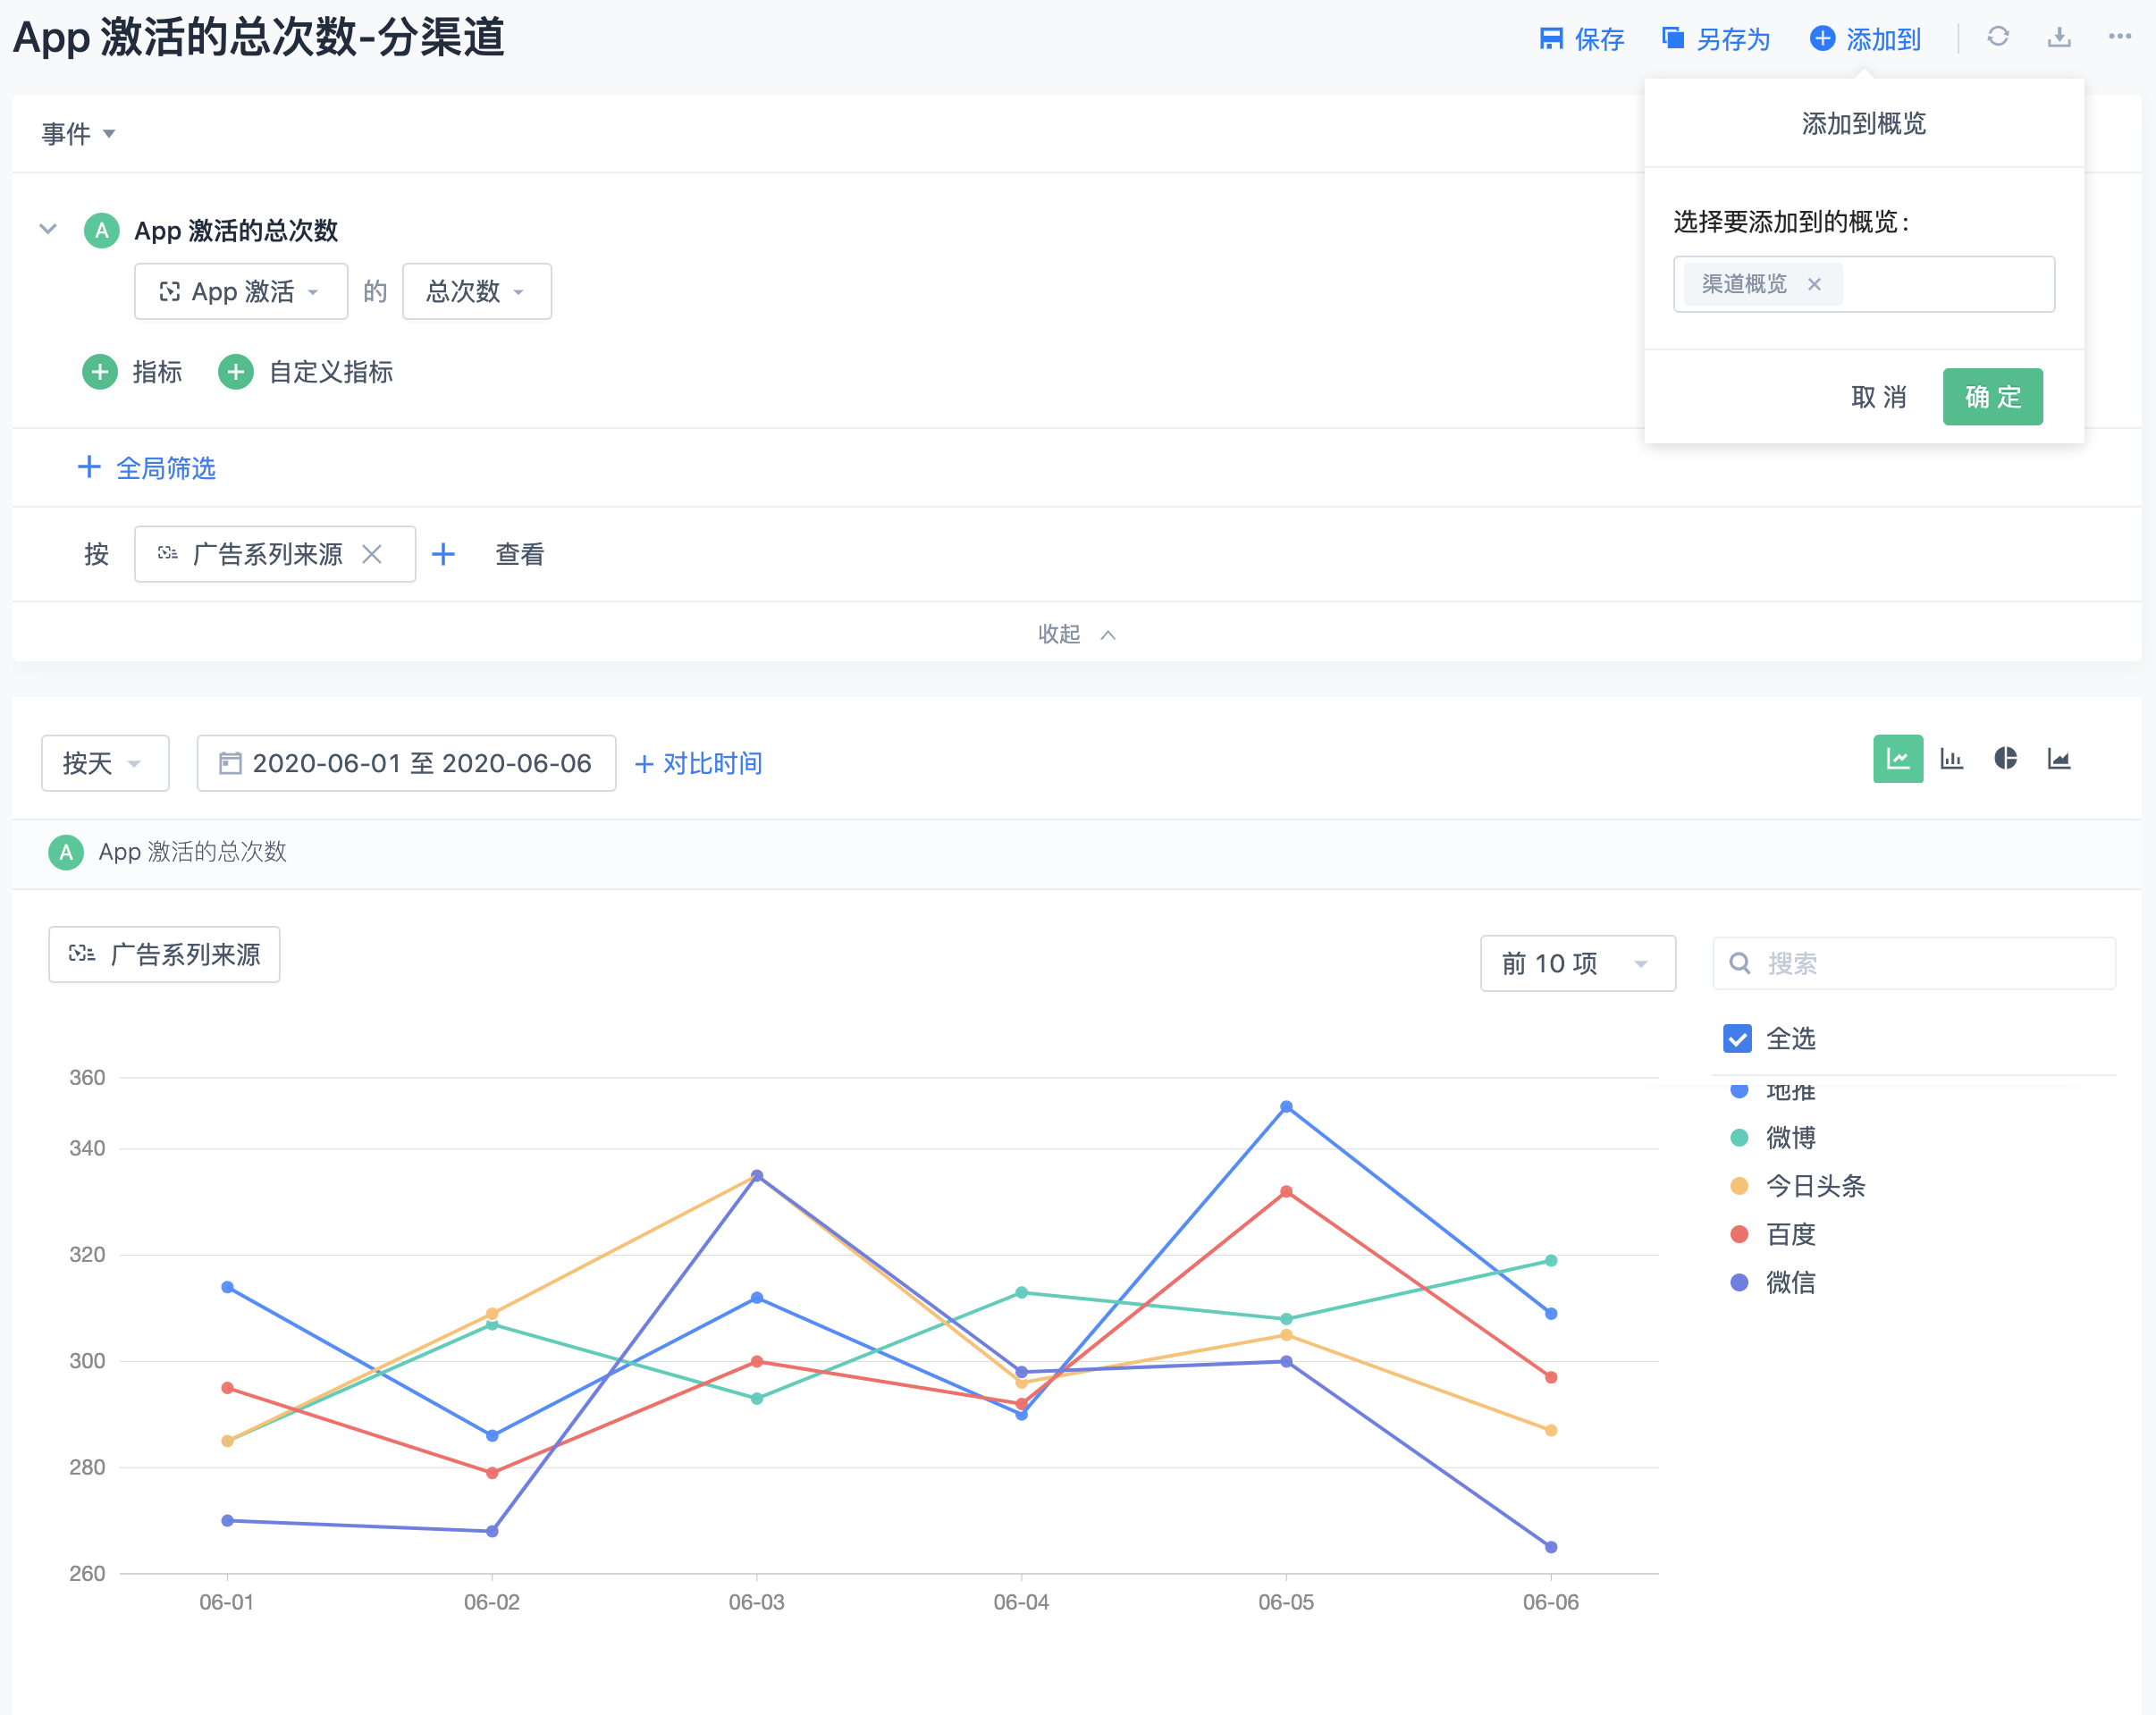
3.1. View the number and proportion of new customers from each channel source
First, we want to understand the ability of each channel to acquire customers and then calculate the ROI based on the cost of advertising. In Sensor Analytics, we can do this:
View the total number of new customers and drill down by date, channel, and other dimensions
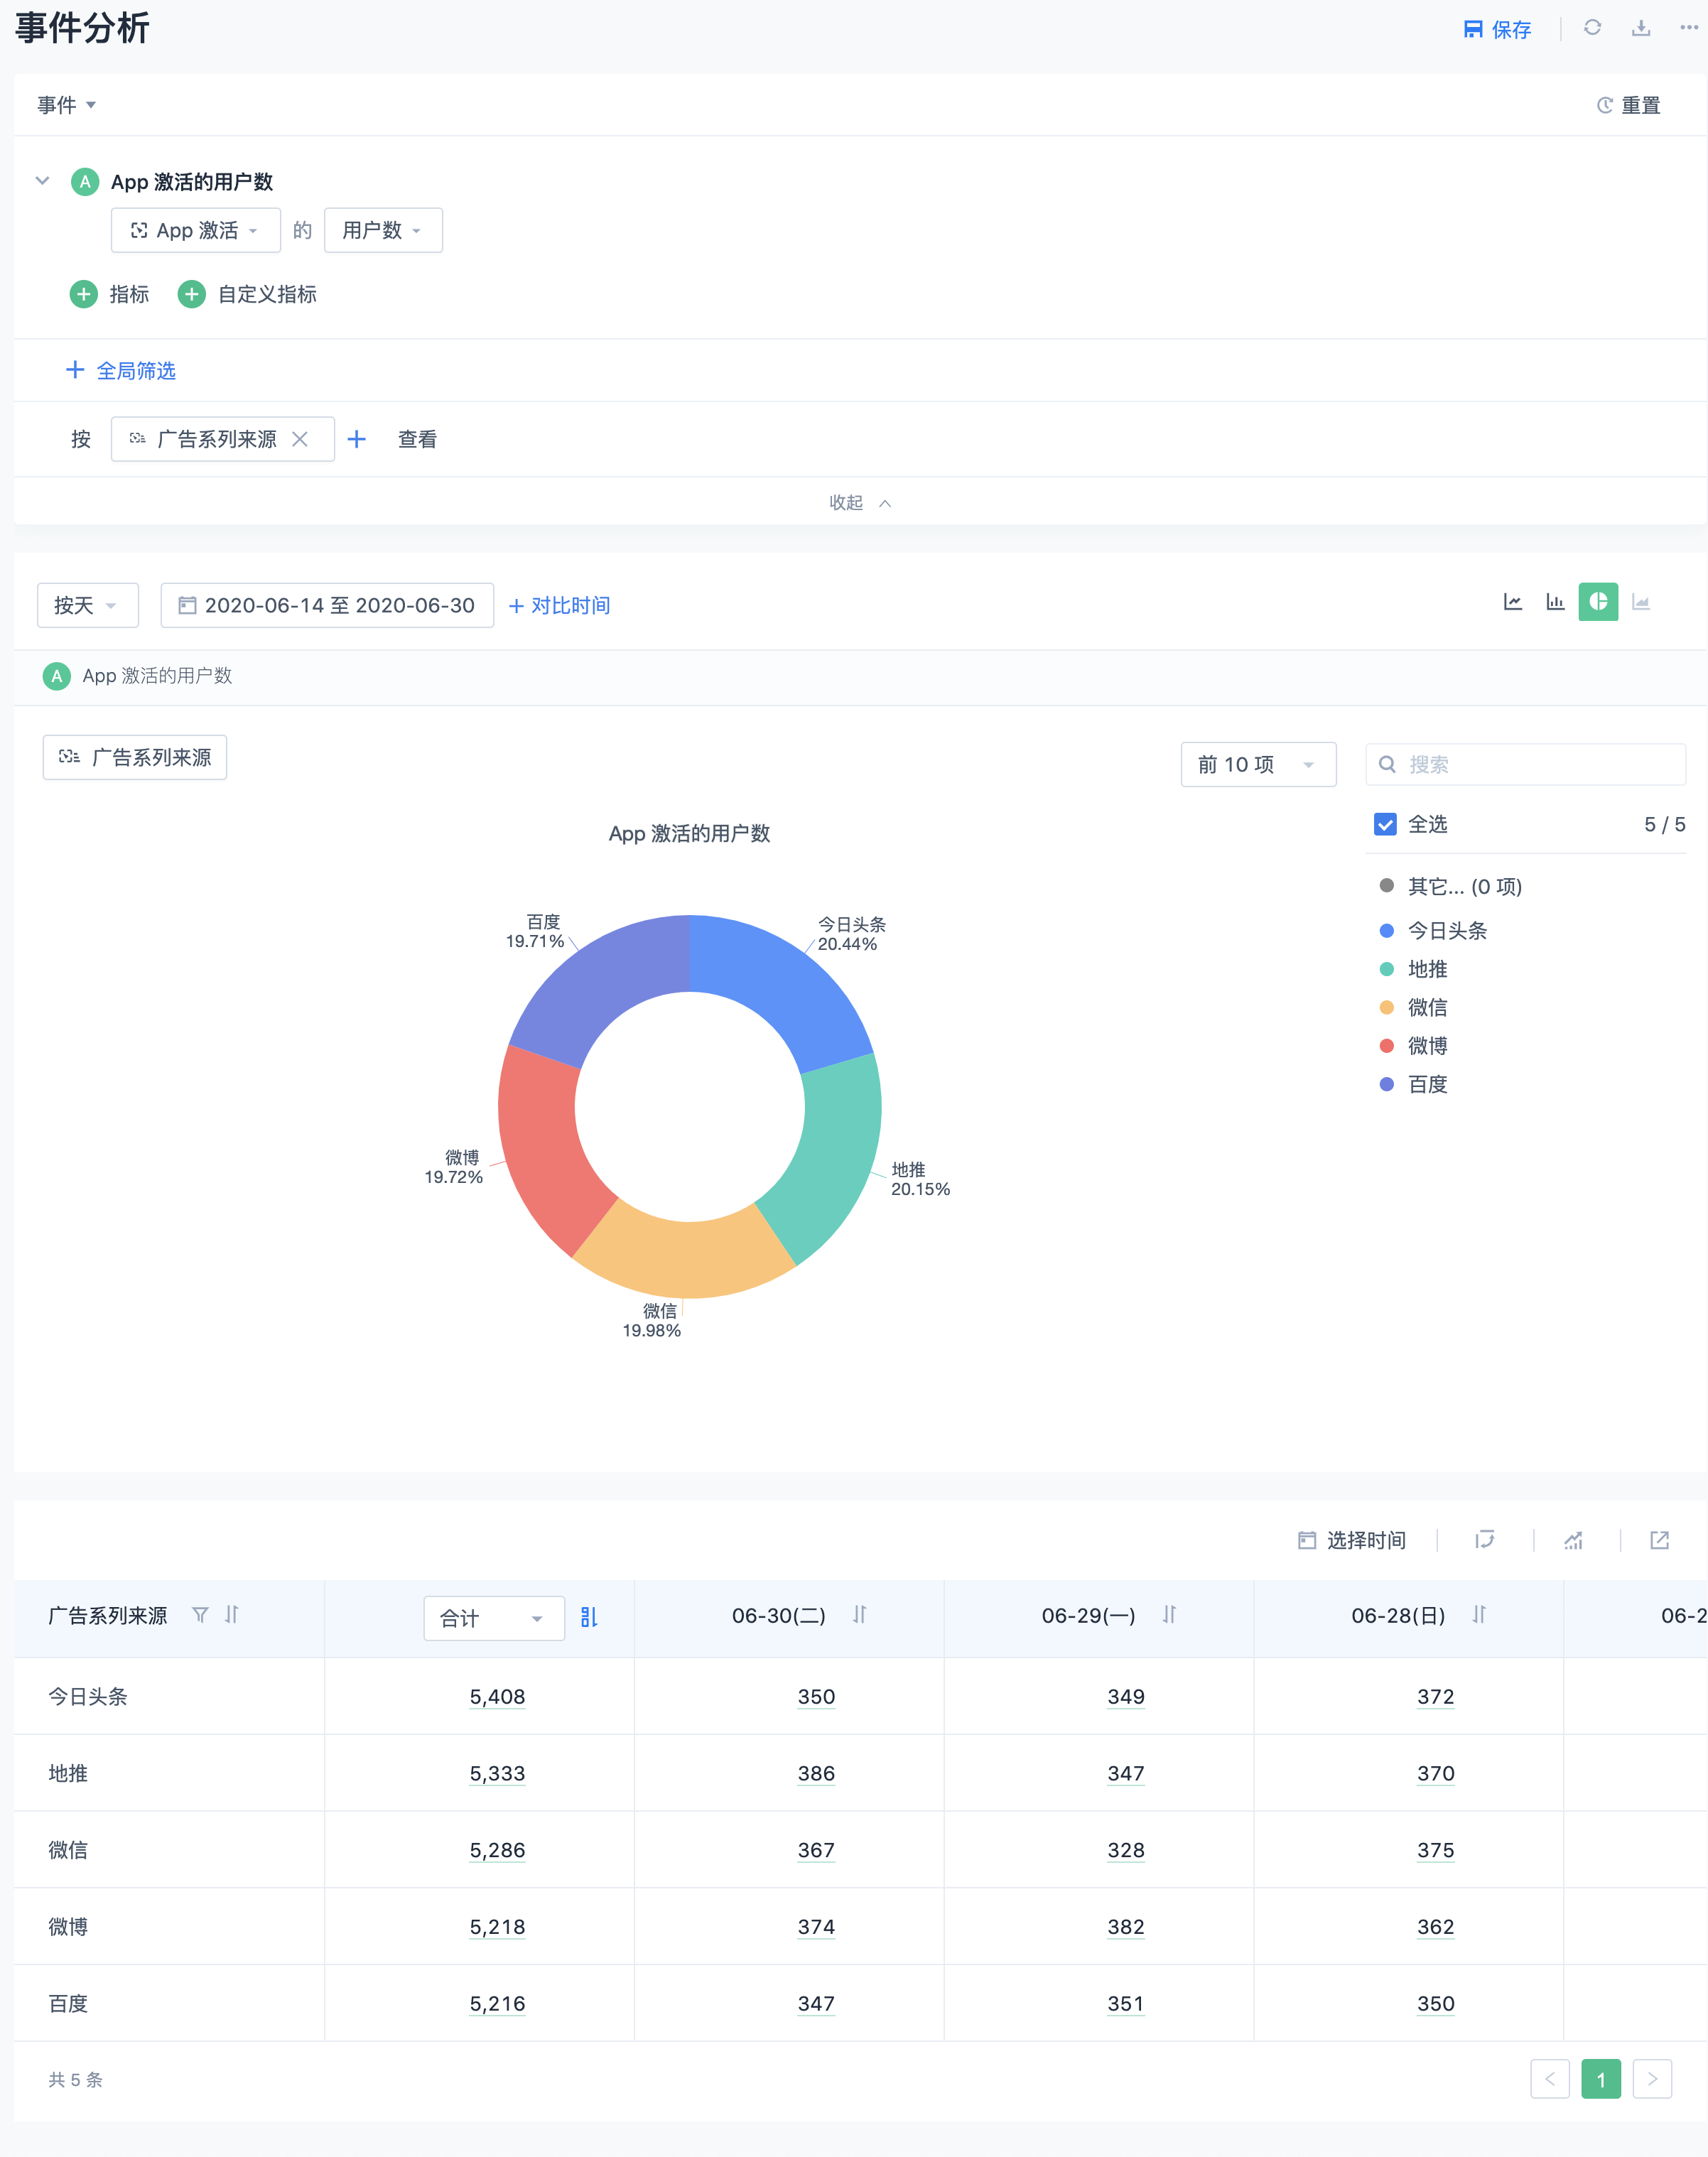
View the proportion of new customers from each channel source to the overall customer acquisition
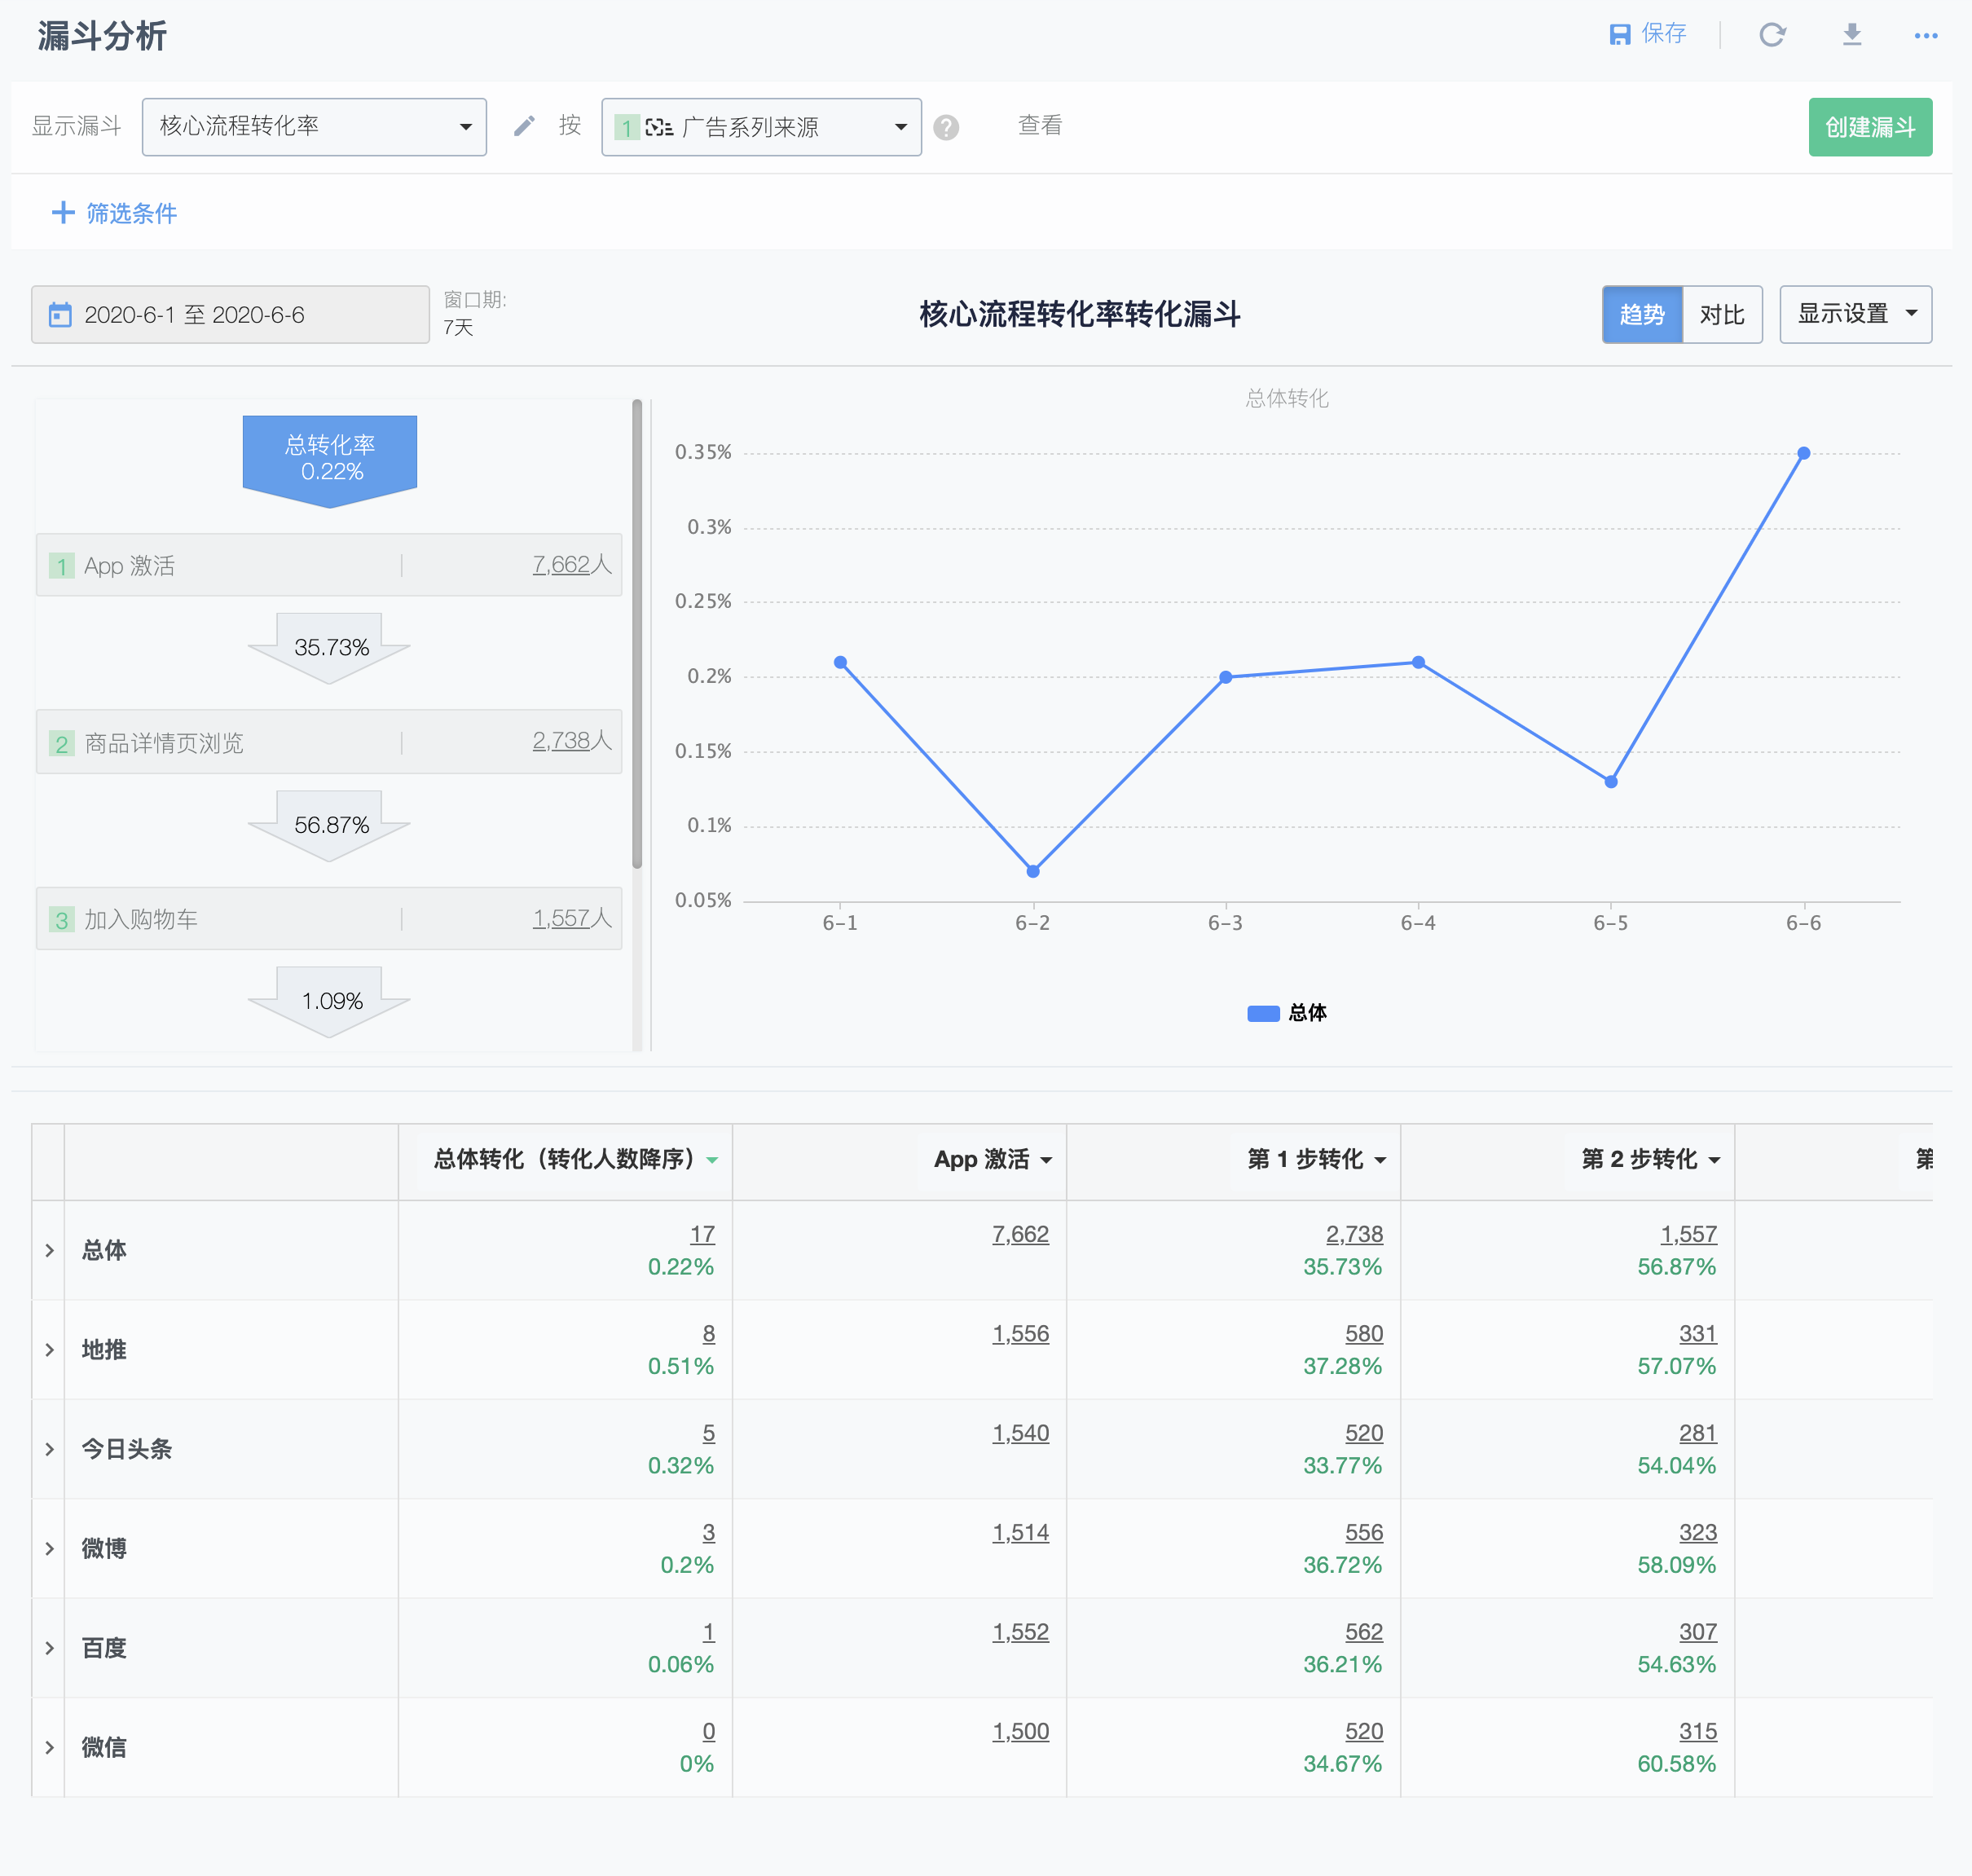
3.2. Analyze the core process conversion rate of users from each channel source
Analyze the total conversion rate of new customers from each channel source in the core process and the conversion rate between each step to find opportunities for improvement in the overall conversion rate
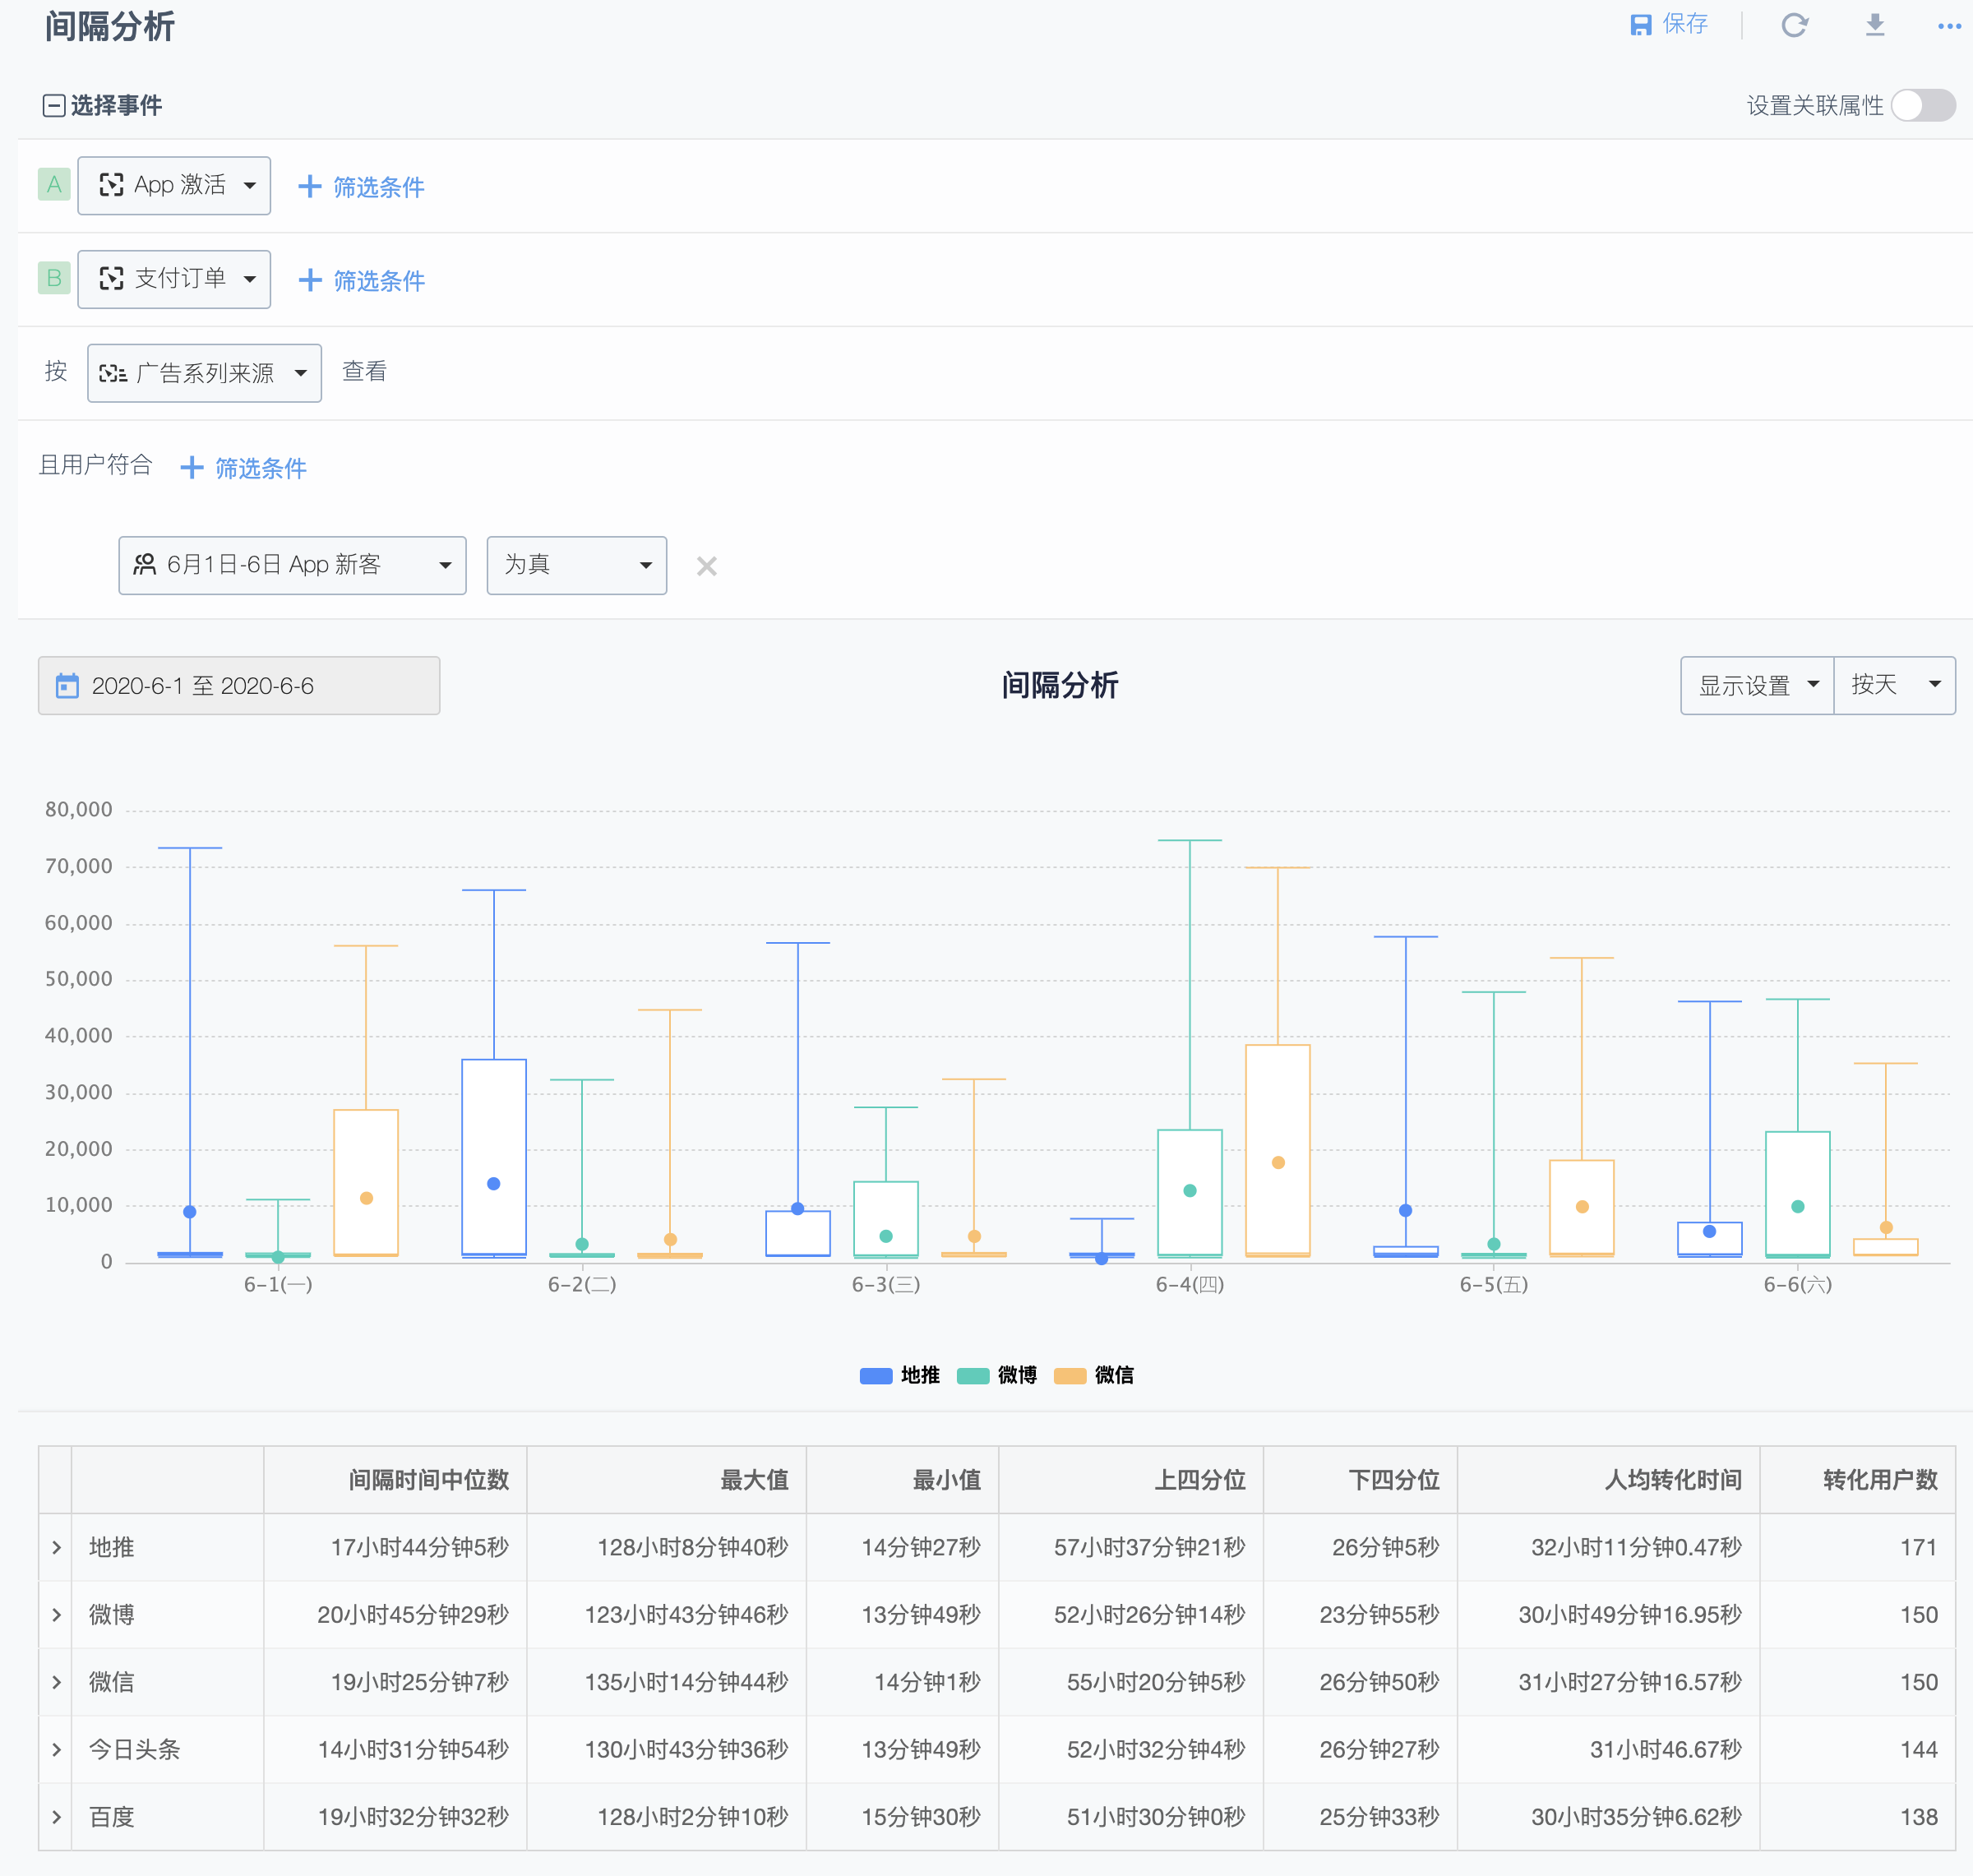
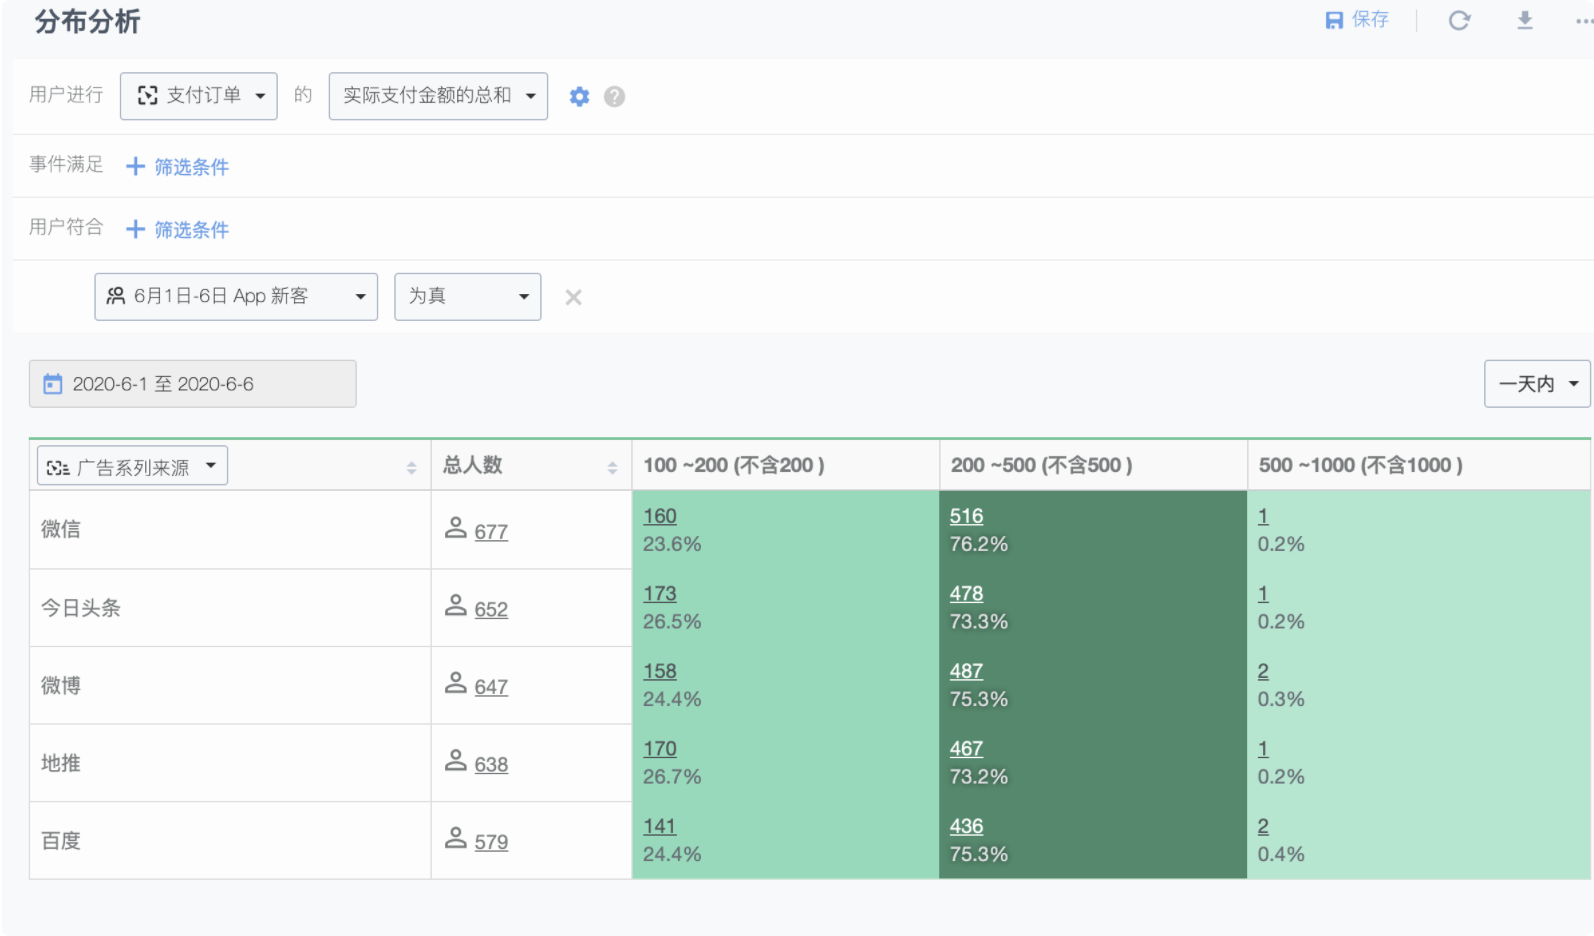
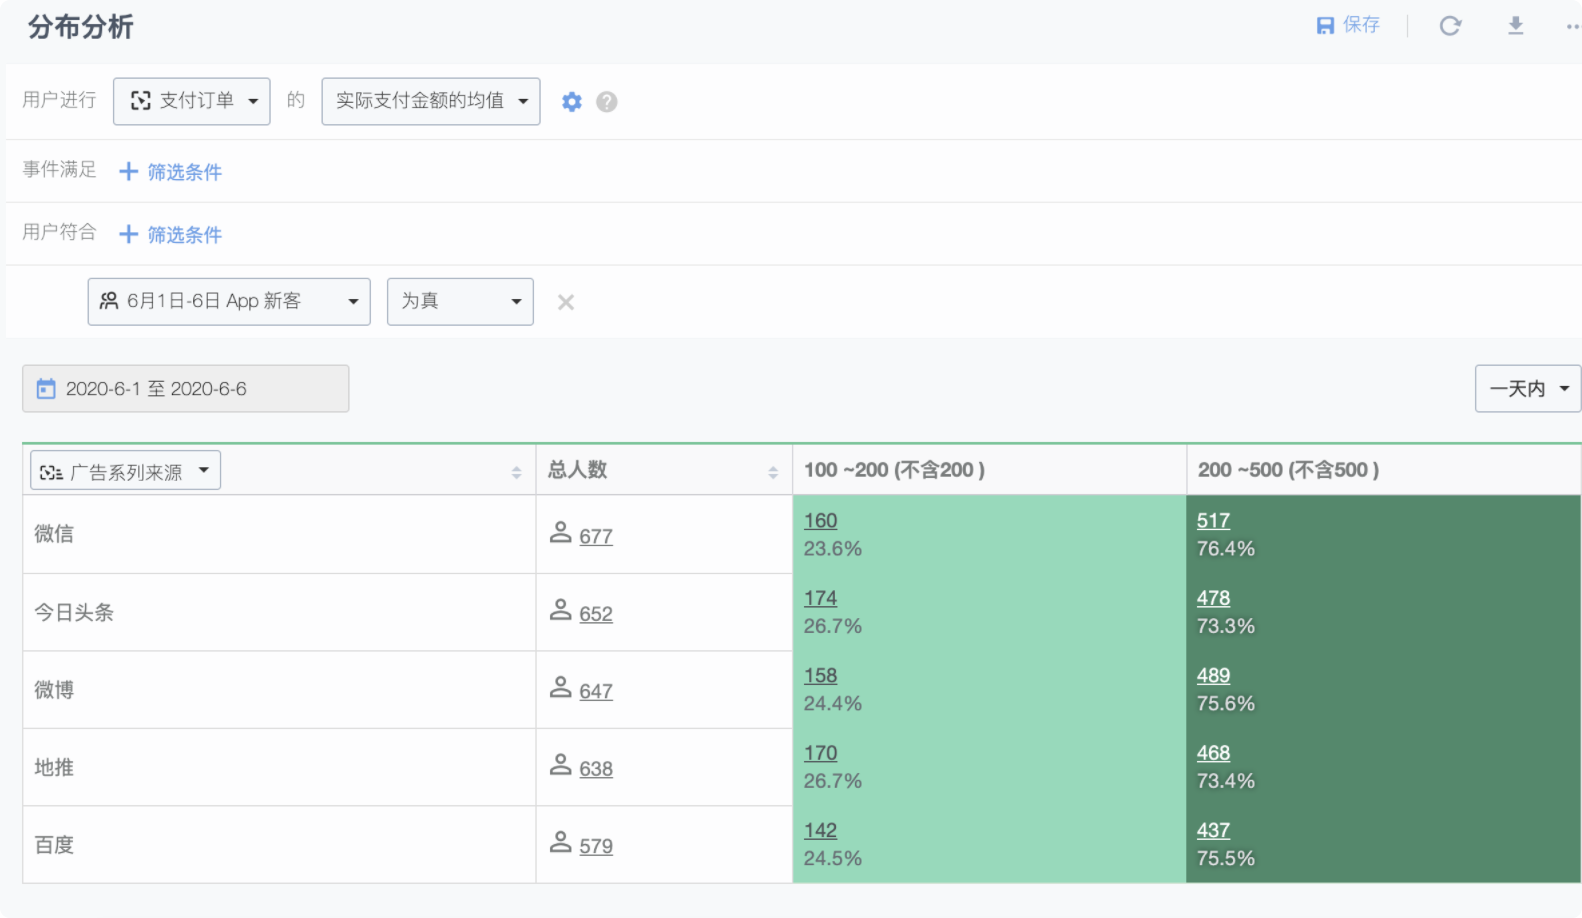
3.3. Analyze the payment behavior of users from each channel source in a multidimensional manner
In the previous question, we saw the conversion rate of users from each channel to the target behavior of the product. At the same time, we also want to obtain more data to evaluate the quality of customer acquisition from each channel.
View the conversion time from app activation to payment order for users from each channel source
View the distribution of average payment order amount and total payment order amount for users from each channel source to determine the impact of channels on user spending power
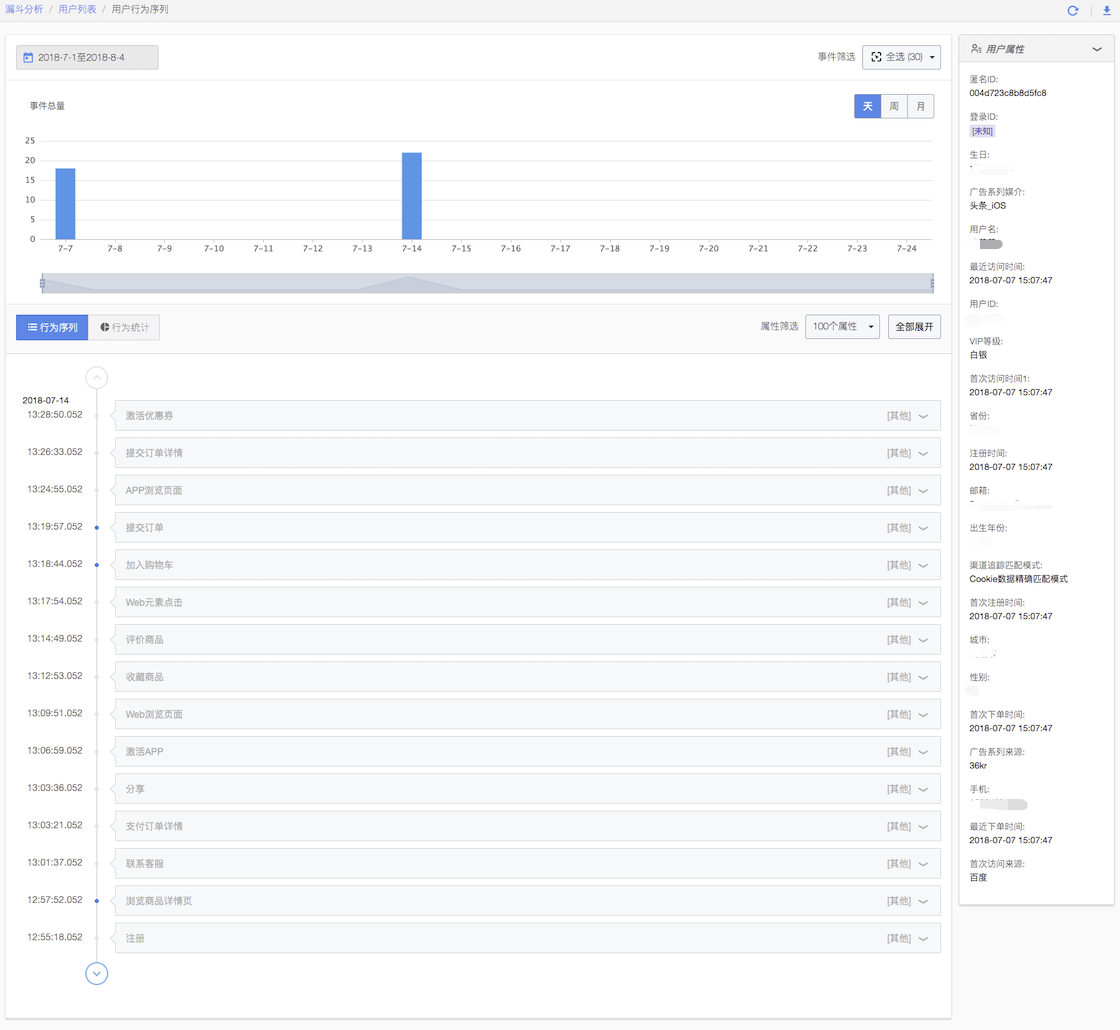
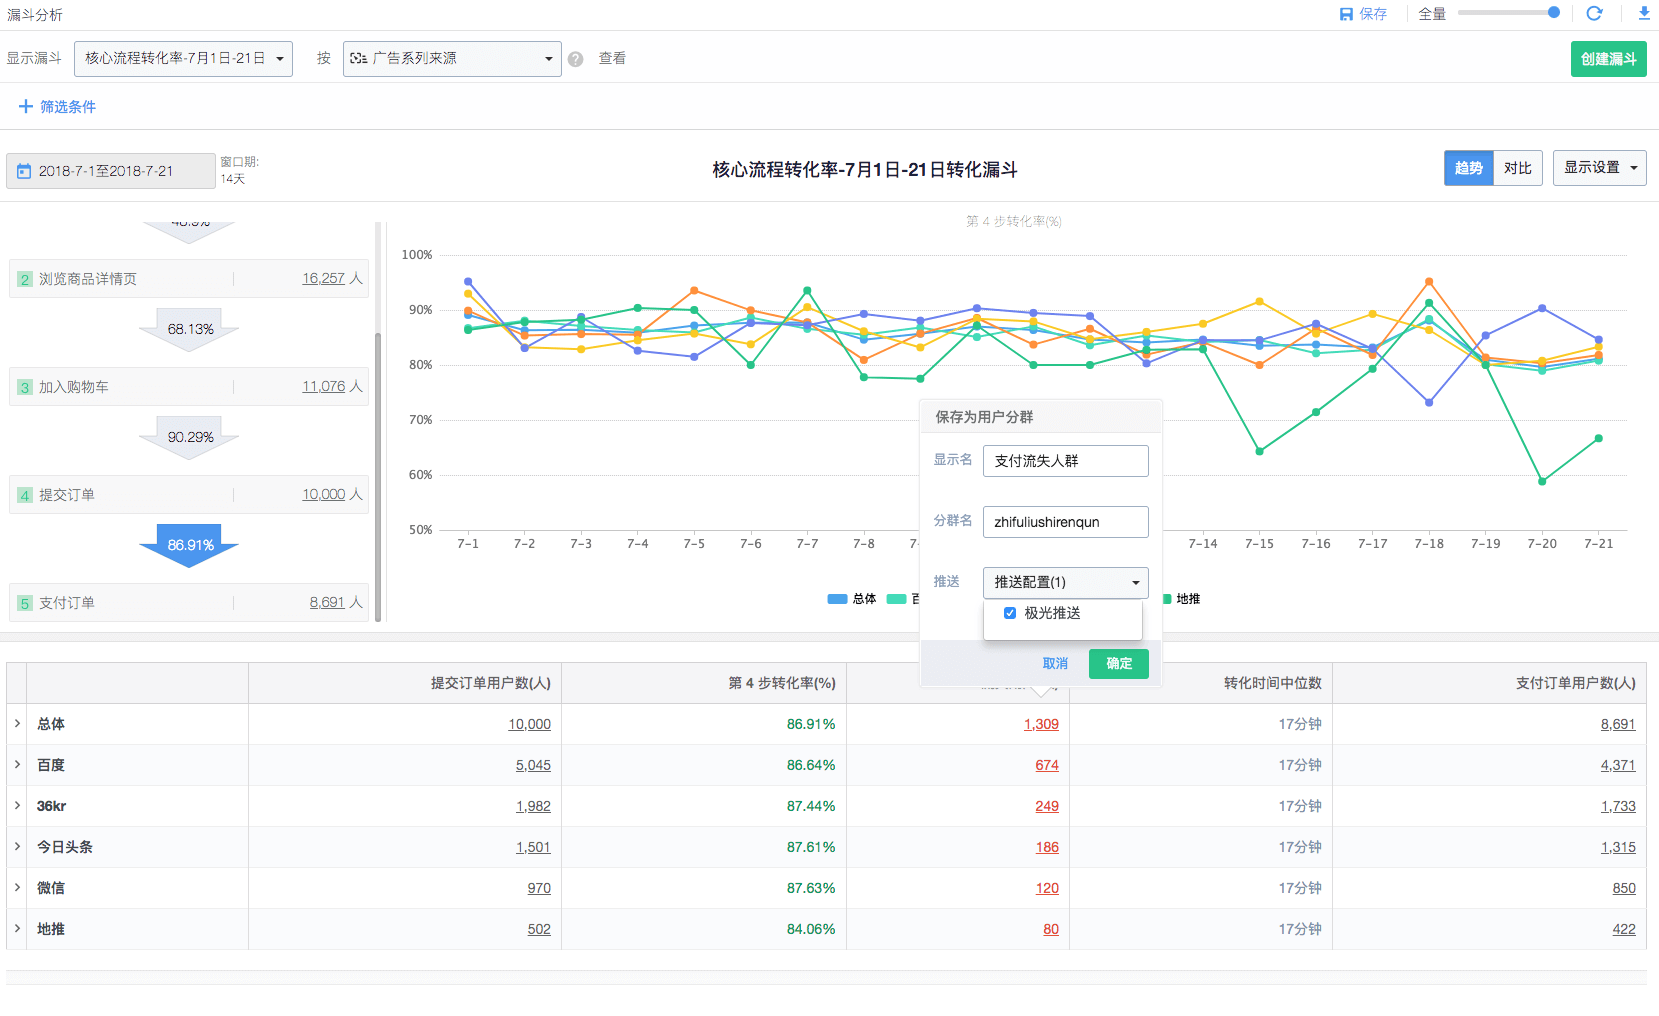
3.4. Analyze the reasons for user drop-off in the payment process
The payment behavior is usually the target user behavior set by e-commerce products, but there is inevitably a large number of user drop-offs in this process. We want to know what the subsequent behaviors of users who drop off in the payment process are. Is the payment behavior affected by other stages?
Sensor Analytics supports viewing the historical behavior sequence of specific user groups, finding the behavior of submitting orders, manually labeling the subsequent behavior to speculate the reasons for not completing the payment process.
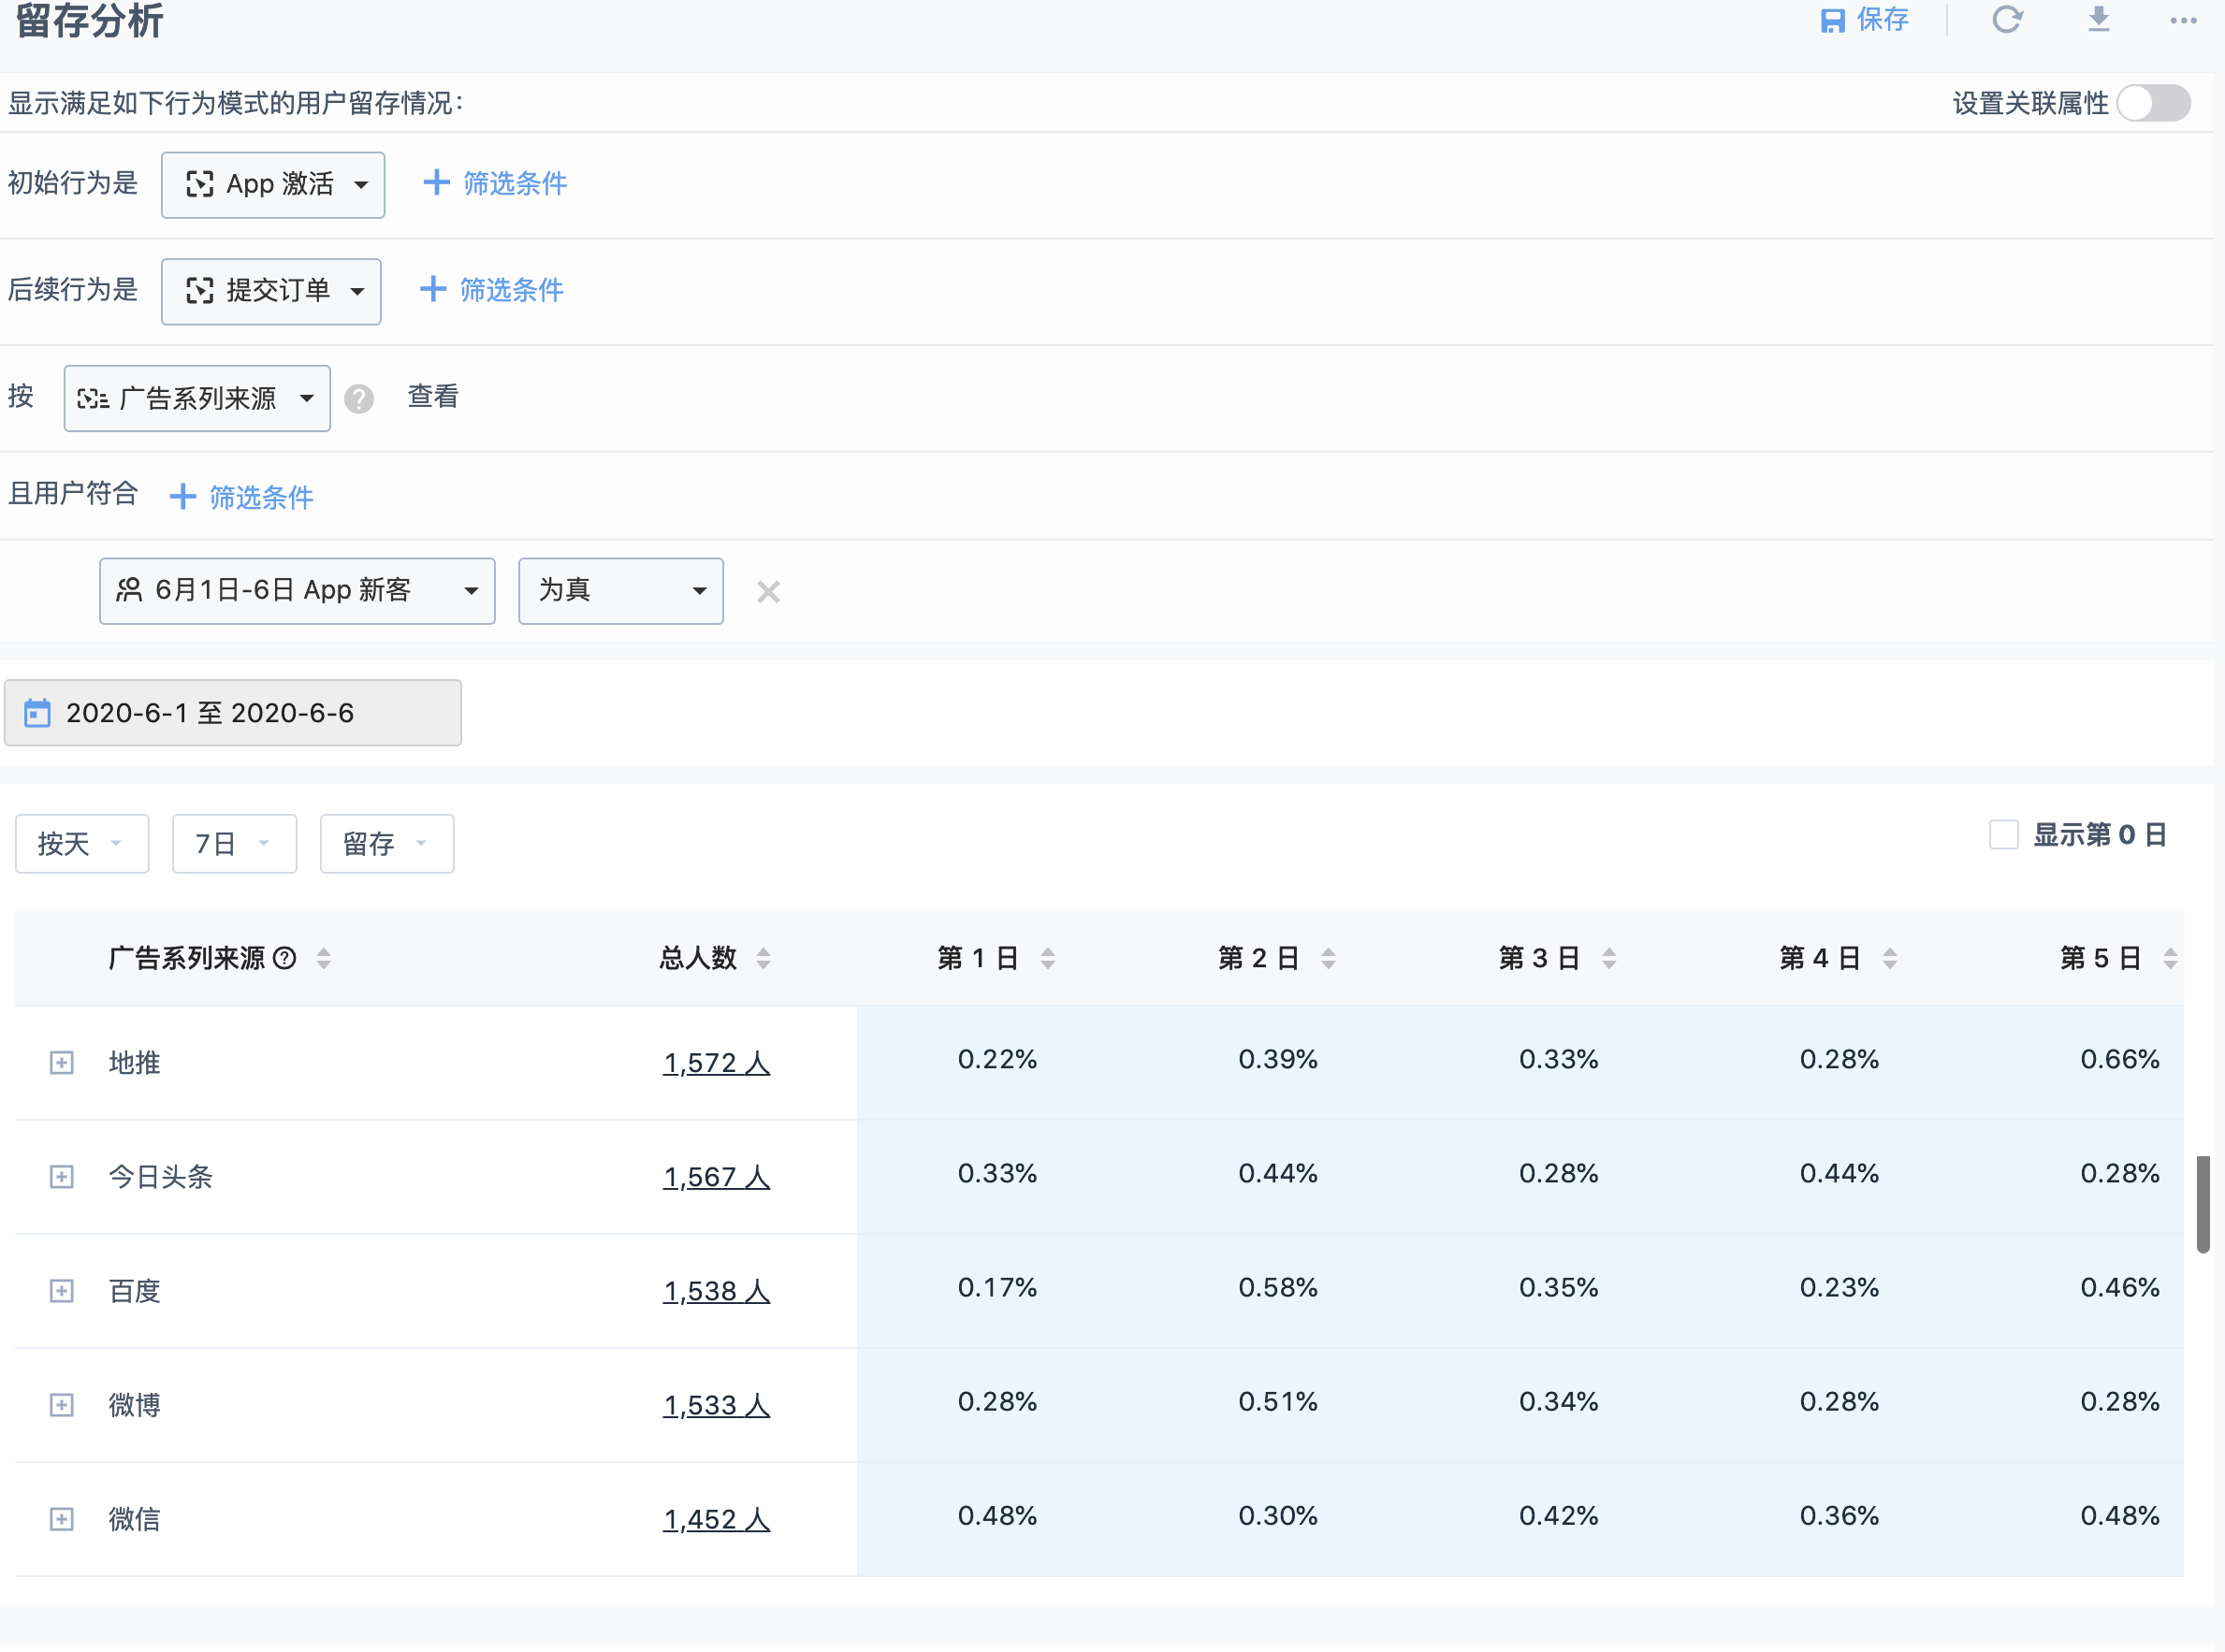
3.5. Analyze the activity of users from each channel source
We want to understand the activity level of users from various channels and the frequency of the target behavior - payment order placement.
View the activity level of users from various channels.
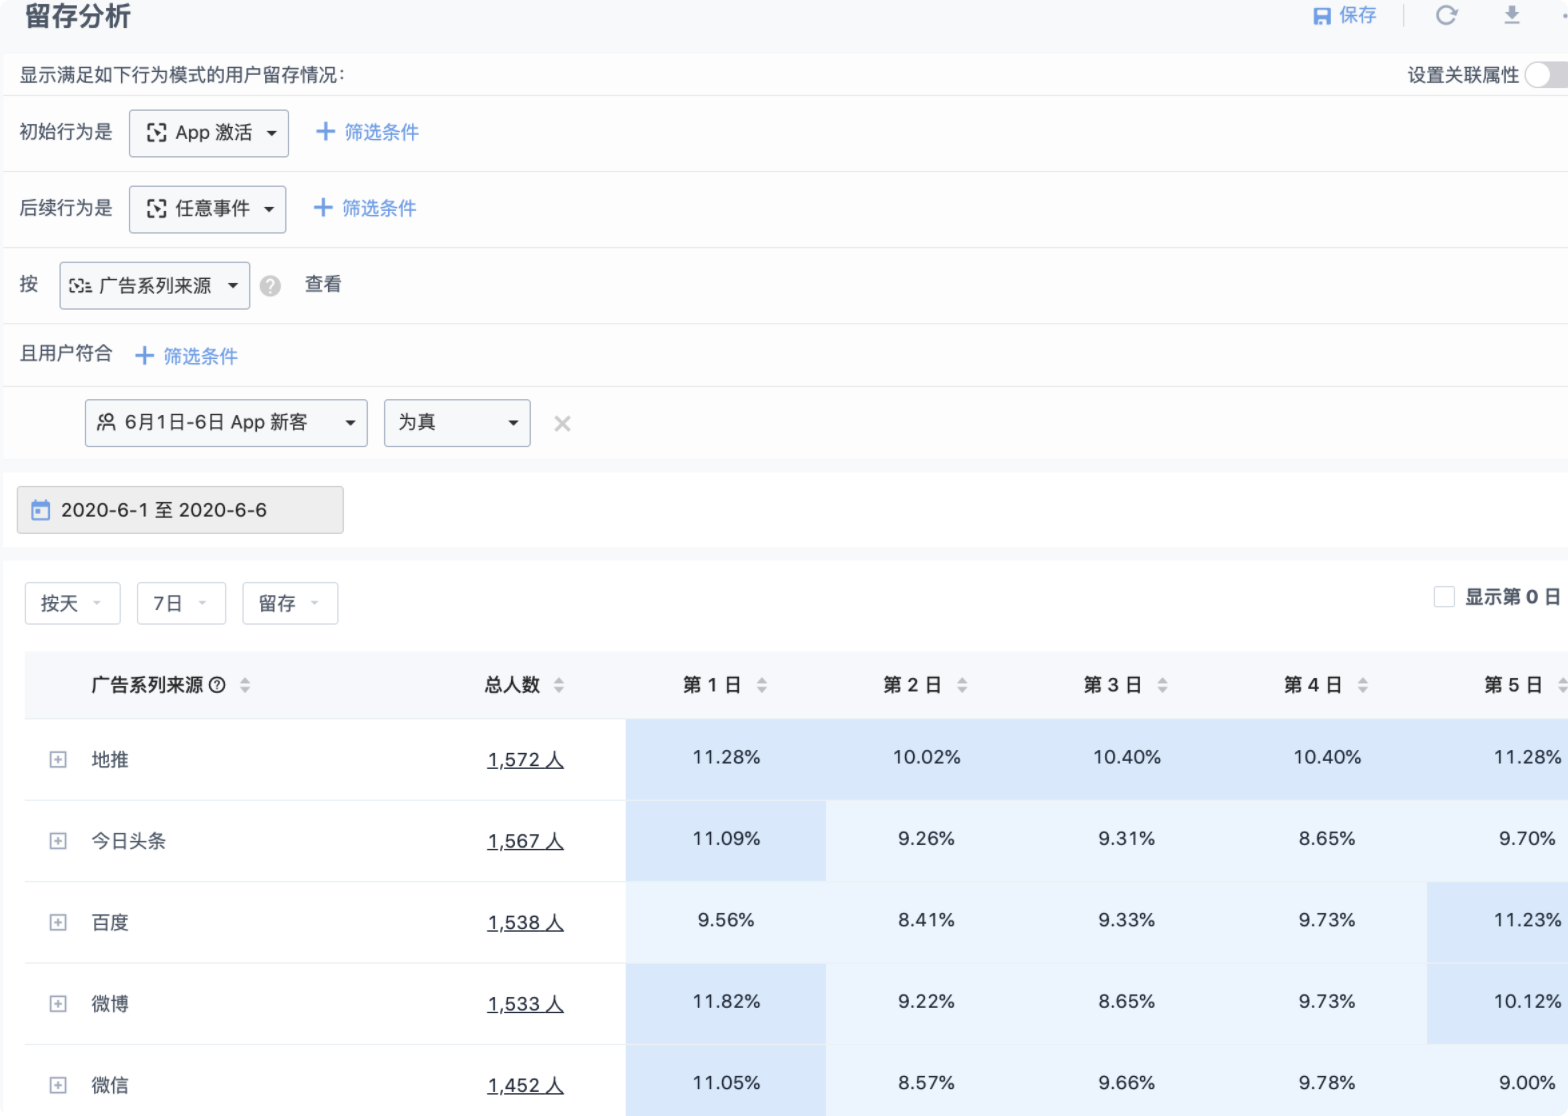
View the frequency of payment orders placed by users from various channels.
3.6. Obtain a list of churned users.
We want to obtain a list of churned users and implement precise marketing for specific segments. Sensors Analytics supports synchronizing specific user device lists with Jiguang/Xiaomi, allowing precise push notifications within the app to be sent to churned users in order to reactivate and recover them.
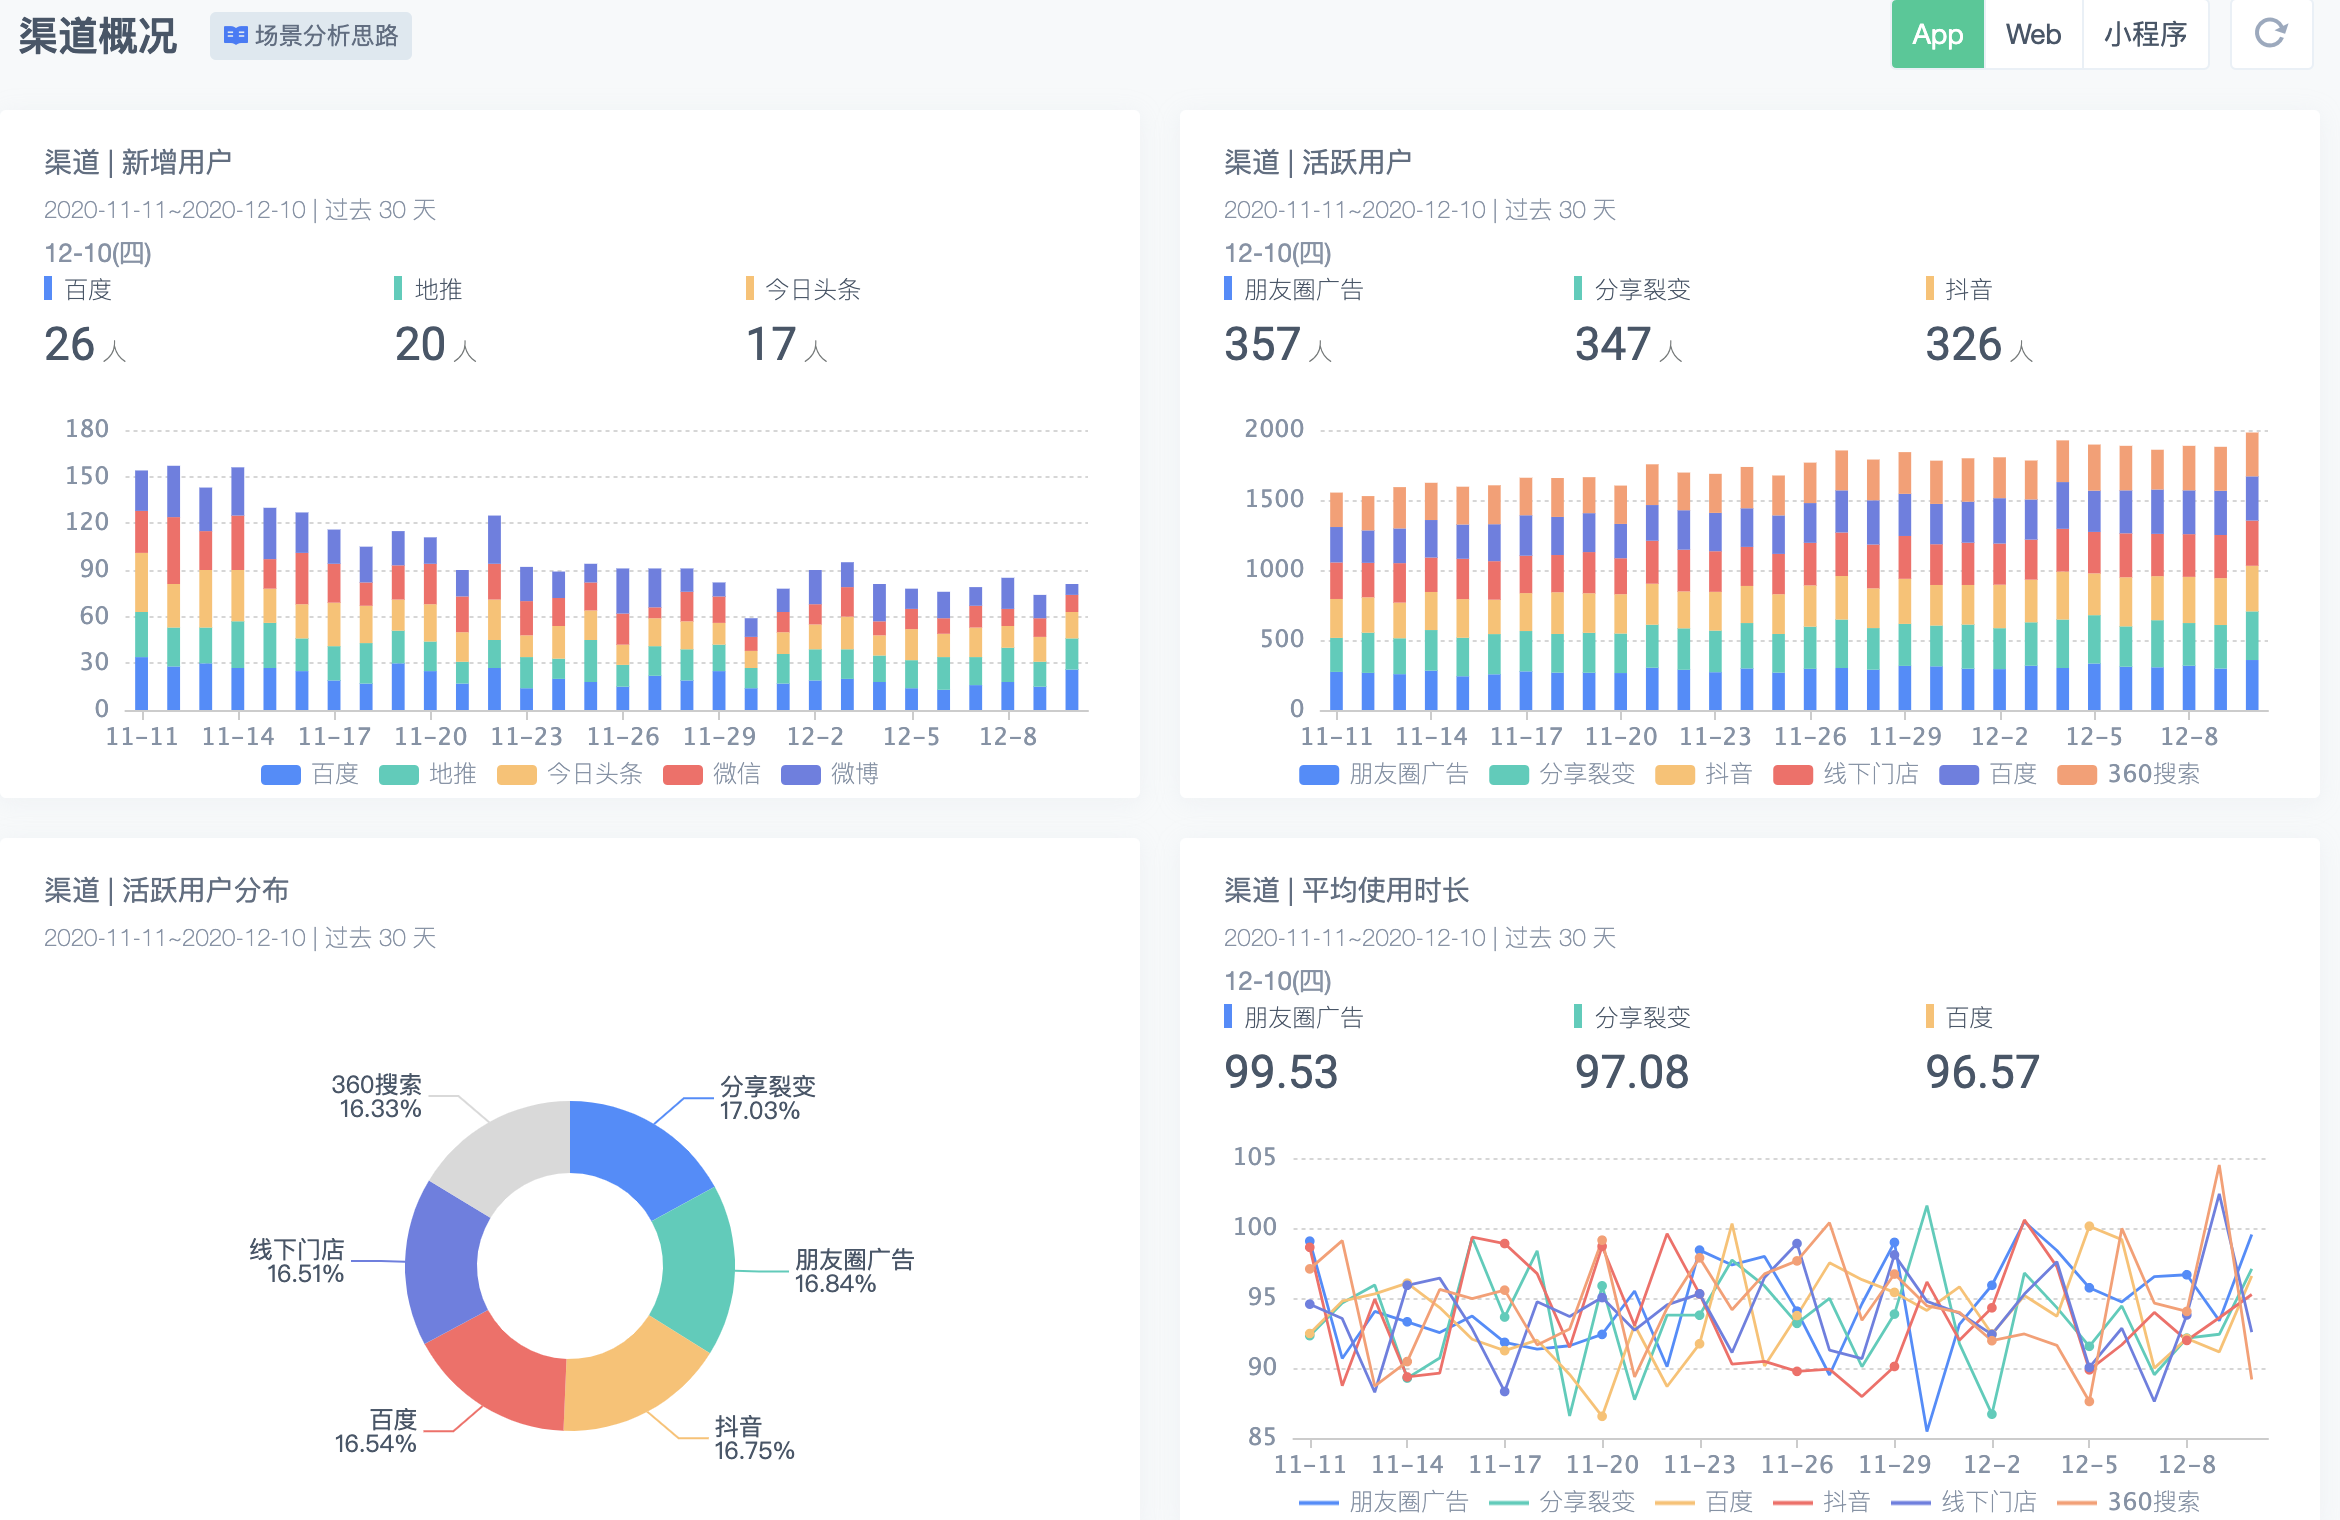
3.7. Comprehensively monitor the quantity and quality of customer acquisition from channels.
If channel operators want to comprehensively monitor the effectiveness of their channels but do not want to reconfigure metrics every time, Sensors Analytics supports adding analysis results to the dashboard, allowing business analysts to quickly obtain the status of the metrics they are concerned about without the need for additional configuration.
This way, you can build an overview of channel analysis to help you quickly understand the current effectiveness of your channels.
This case study helps you quickly understand a simple analysis scenario that involves event analysis, funnel analysis, retention analysis, distribution analysis, interval analysis... Such as divine analysis model, you can further explore more features. If you want to learn more about advanced scenarios, you can go toIndustry Practicelearn more usage scenarios and advanced usage tips.
The above data are analog data and can be accessedElectronic business Demo to experience. The next article will answer the question "Where does the data for Sensors analytics come from?"
Note: The content of this document is a technical document that provides details on how to use the Sensors product and does not include sales terms; the specific content of enterprise procurement products and technical services shall be subject to the commercial procurement contract.
 Popular Searches