Metric Analysis
|
Collect
1. Overview of Metric Analysis
1.1. Overview
In the "Metric Platform," after creating metrics, dimensions, and relationships, you can perform flexible multidimensional analysis in the "Metric Analysis" section.
Metric Analysis supports both simple analysis, using selected metrics, dimensions, and filters, as well as advanced analysis with configurable conditions. It helps product and operation teams analyze daily business data and provides advanced insights for professional analysts. Metric Analysis can meet the following requirements:
- Ad-hoc analysis with multiple dimensions and metrics: Generates analysis results based on unified metric and dimension measures, eliminating ambiguity between different business models.
- Reduces the threshold for data querying and analysis: Generates analysis results by simply selecting and dragging dimensions, metrics, and filters. It provides analysis based on business semantics similar to behavioral analysis models, making it user-friendly for business users.
- Integration of behavior and operational metrics: Based on metrics and relationships, it supports user-level operation and analysis ROIfor businesses by bridging behavioral and operational data.
- Can be used as a tool to generate internal business intermediate tables, creating centrally managed business models. The upper-level visual supports multi-level configuration with secondary aggregation.
After configuring analysis conditions in Metric Analysis, you can publish them to the "DataSet" for the consolidation of analysis conditions and configuration of data update methods. It also allows for fine-grained permission distribution, such as collaborative management and role permissions.
1.2. Common Analysis Scenarios
Scenario 1: Analyzing multiple metrics generated by different analysis models simultaneously
Metrics created by different analysis models, such as event analysis, session analysis, and retention analysis can be analyzed simultaneously in Metric Analysis. For example, analyze the consumption and conversion of different delivery channels by simultaneously examining channel PV (event analysis), total number of sessions by different sessions (session analysis), and bounce rates for different sessions (session analysis).
Scenario 2: Operational Analysis
After quickly generating the required dimensions and metrics in the Metric Platform, you can analyze operational data in Metric Analysis. For example, analyzing sales revenue for different product categories can be achieved by creating metrics (sum(order amount)) from the order table with a filter that selects completed orders.
Scenario 3: Combined analysis of user behavior and operational data
By using existing analysis models to visualize and quickly generate behavioral metrics, such as DAU and next-day retention rate, and by integrating business data at the user level with behavioral data, you can perform analysis in Metric Analysis for user-level operational ROI and other business scenarios, solving the problem of isolated user behavior and operational data.
1.3. Applicable Roles
Permission point \ Role | System Role | Custom Role | |||
|---|---|---|---|---|---|
| Administrator | Analyst | Developer | Regular User | Custom Role Name | |
| Use Metric Analysis | Default Enabled | Default Enabled | Default Enabled | Default Disabled | Custom Configuration |
Dimensions and metrics with "use access" can be analyzed in metric analysis. See the section on metric management permissions for details.
2. Introduction to the Metric Analysis Interface
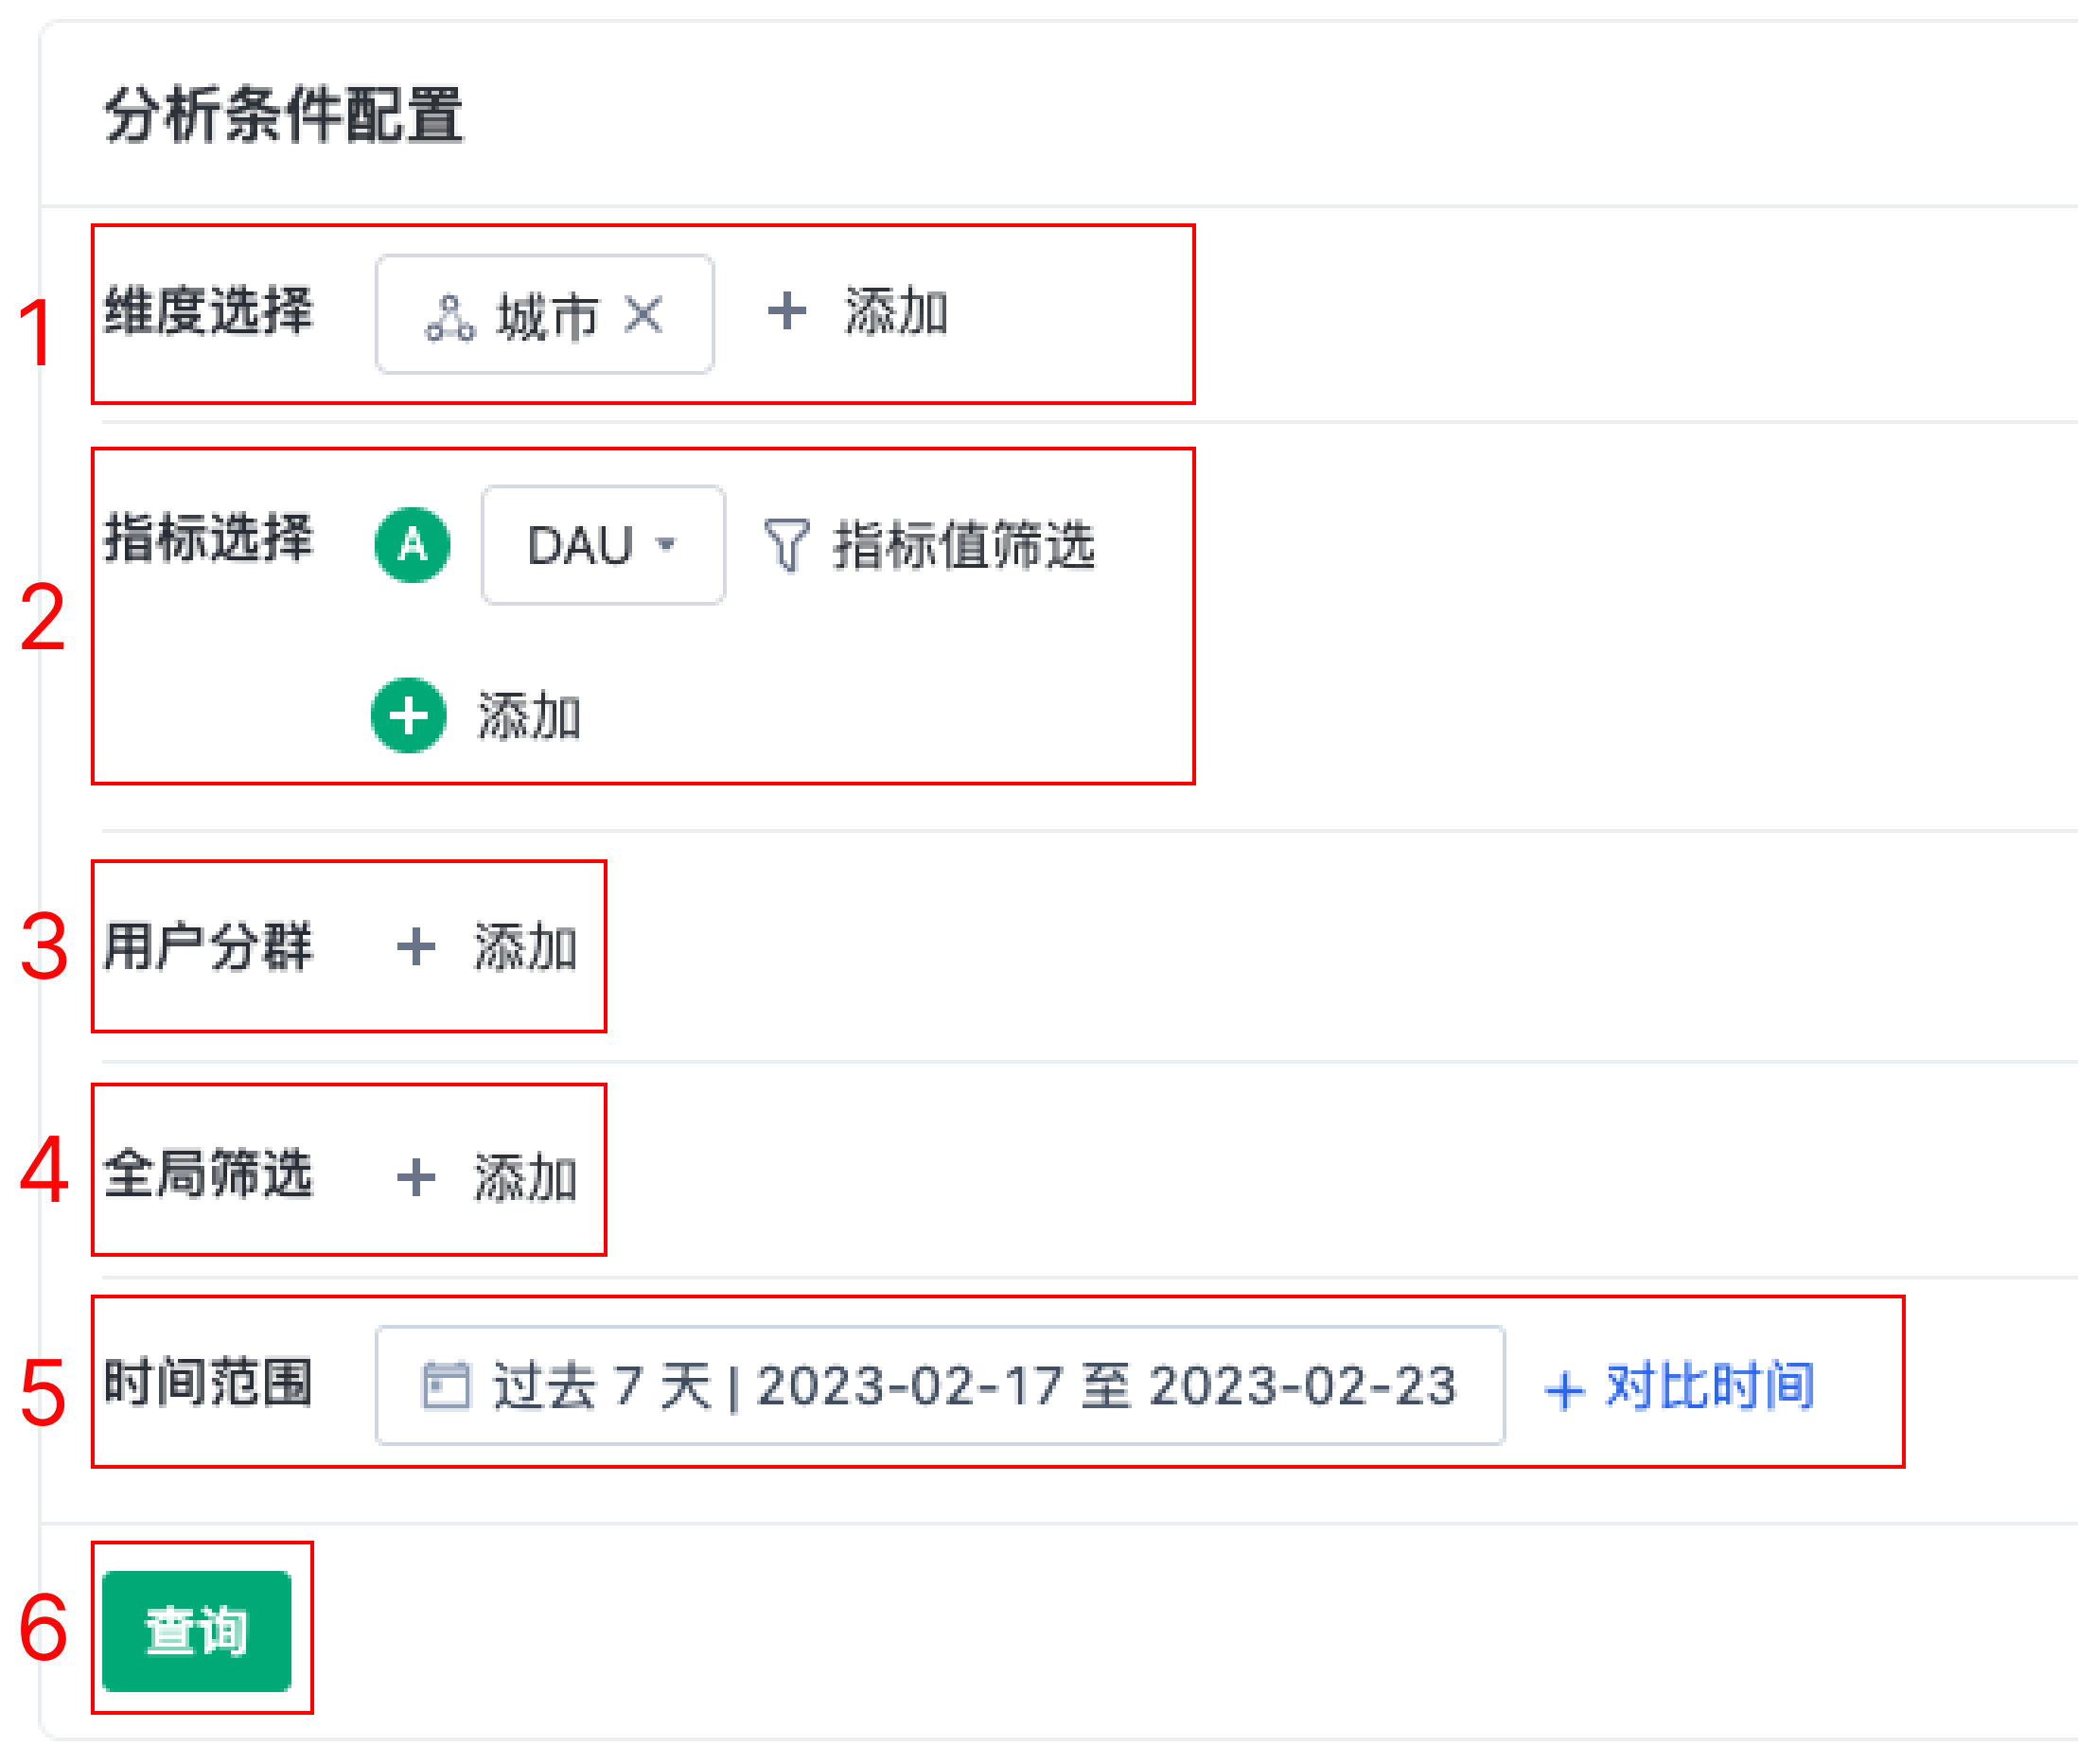
2.1. Basic-Analysis Condition Configuration
Select the required dimensions (1), metrics (2), time range (5), and click query (6) to complete an analysis.
It also supports adding user segments (4) and global filters (5).
2.1.1. Dimensions and Metrics
In the metric analysis, you can choose dimensions or metrics based on your analysis preferences. Metrics are required while dimensions are optional.
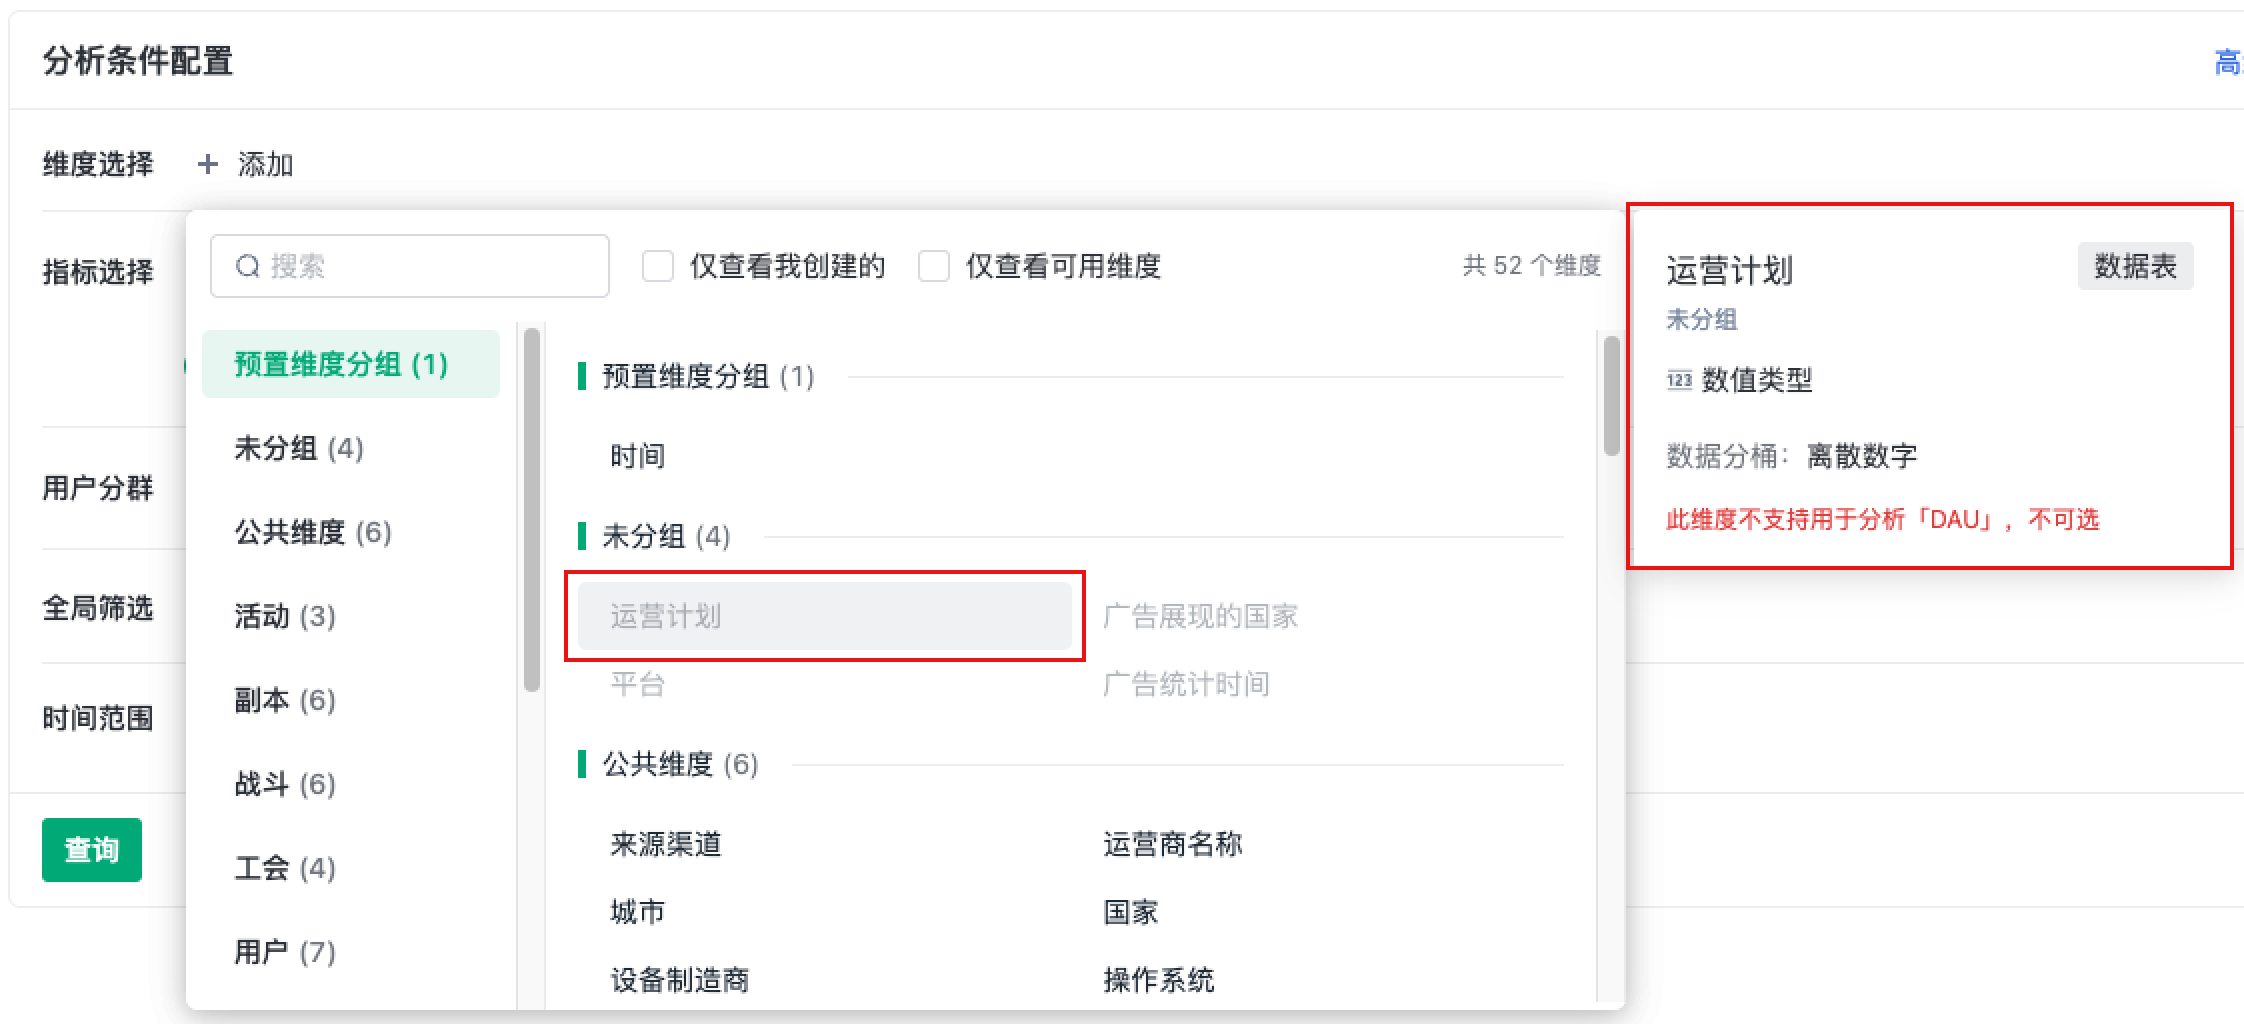
Dimensions and metrics will dynamically change based on the selected content. Hovering over unavailable options will display detailed reasons.
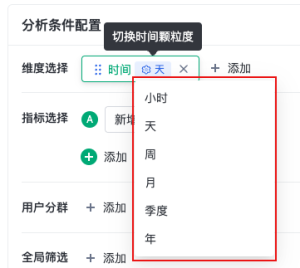
2.1.1.1. The description of dimension-time dimension
The preset dimension-time supports switching between different time granularities during analysis.
Some metrics, such as those used for retention analysis, do not support all time granularities. If you select such metrics first and then the time dimension, the available options for time granularity will be reduced.
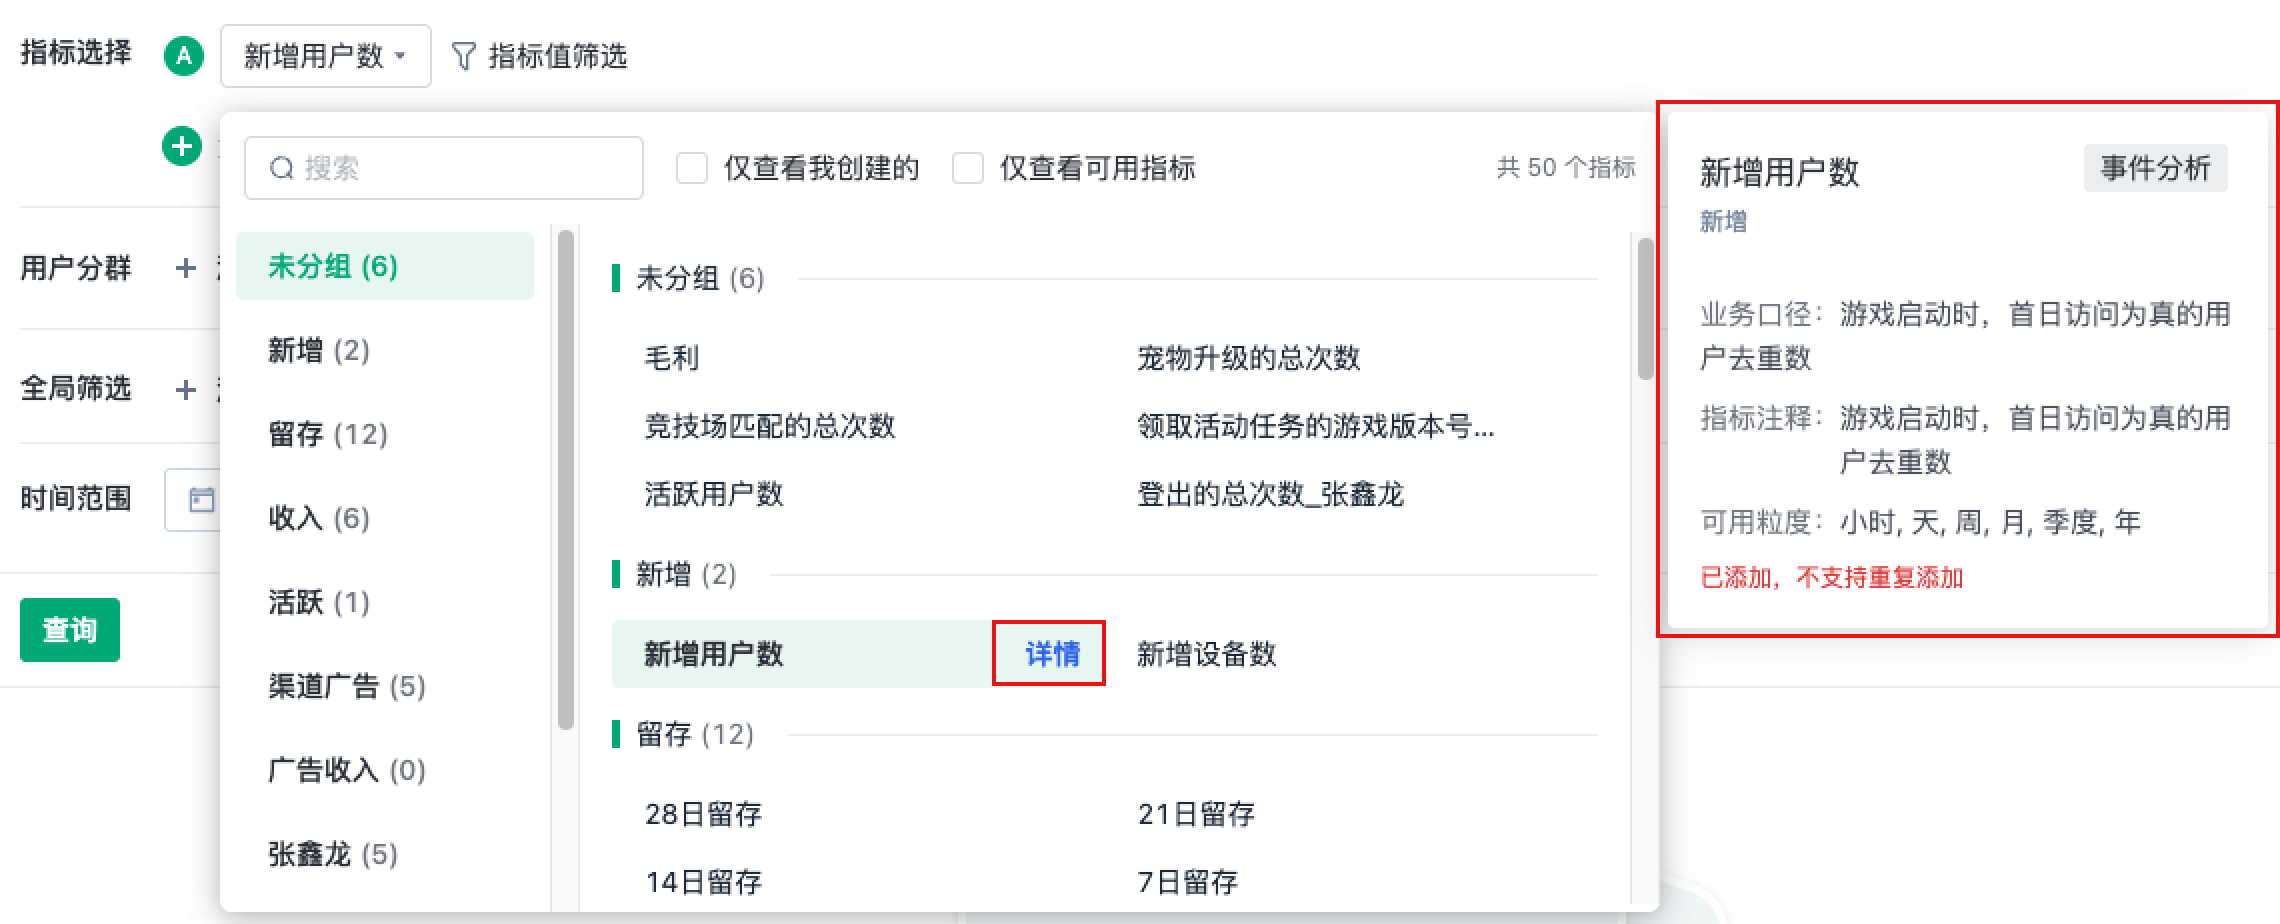
2.1.1.2. Metric - Metric Caliber
The metric-caliber of each metric, such as group, source, business caliber, metric annotations, and available time granularities, can be viewed in the metric caliber card. To further view data calibers, creators, and other information, click "Details" to quickly jump to the metric platform.
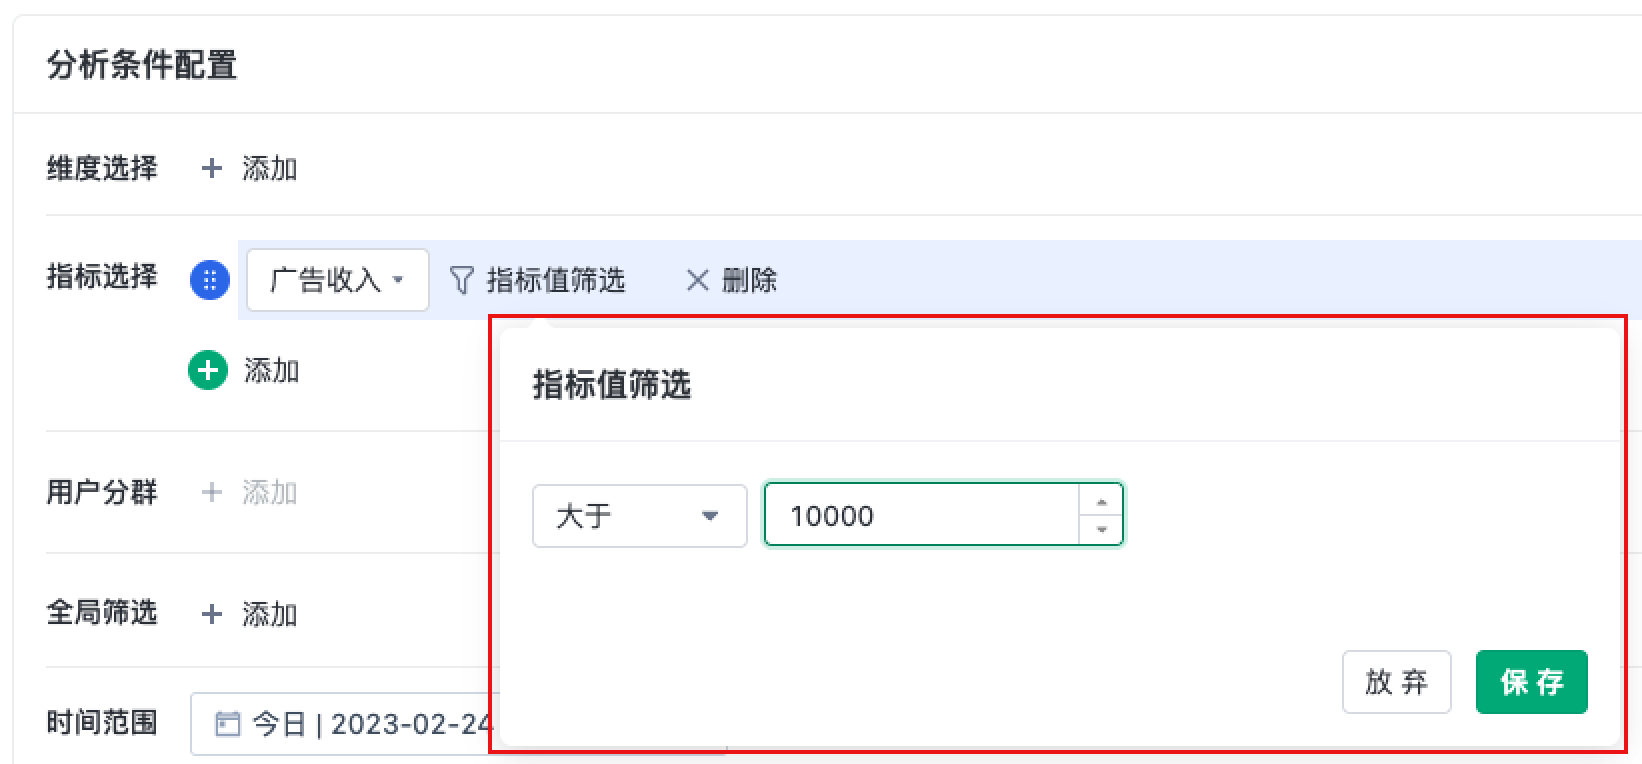
2.1.1.3. Metric-Metric Value Filtering
The entrance to metric value filtering can be used to filter out more focused data after selecting a metric. In one analysis, the metric value filtering added to a metric will affect the data of other metrics, that is, such filtering conditions will affect the data of the entire row.
For example:
Dimension: channel
Metrics: ad revenue (metric value filter, greater than 10,000), ad cost
The query data only returns the relevant data of channels with "ad revenue" greater than 10,000
2.1.1.4. Limitations on the use of dimensions and metrics
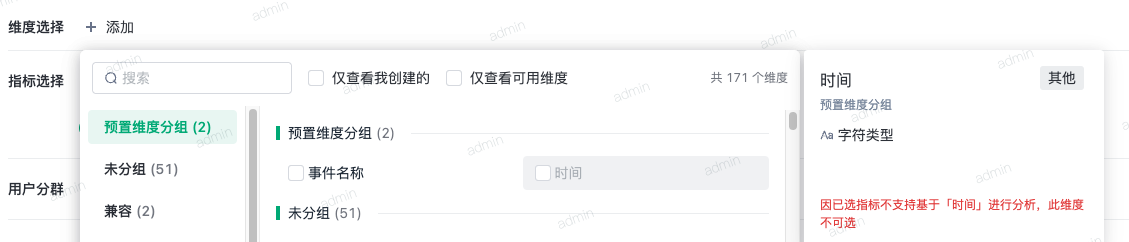
Dimensions
- For dimensions with the data type of "List (Collection)", only one can be selected in one analysis.
Metrics
- If the data table that contains the metric does not have a Datetime field, the "time" dimension and "time range" are not available for this type of metric, as shown in the figure below.
- First select this type of metric, then select the "time" dimension:
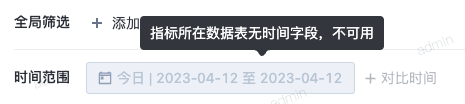
- Selecting this type of metric will disable the "time range":
- Time-based metrics cannot be analyzed together with this type of metric:
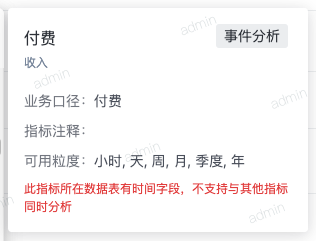
- First select this type of metric, then select the "time" dimension:
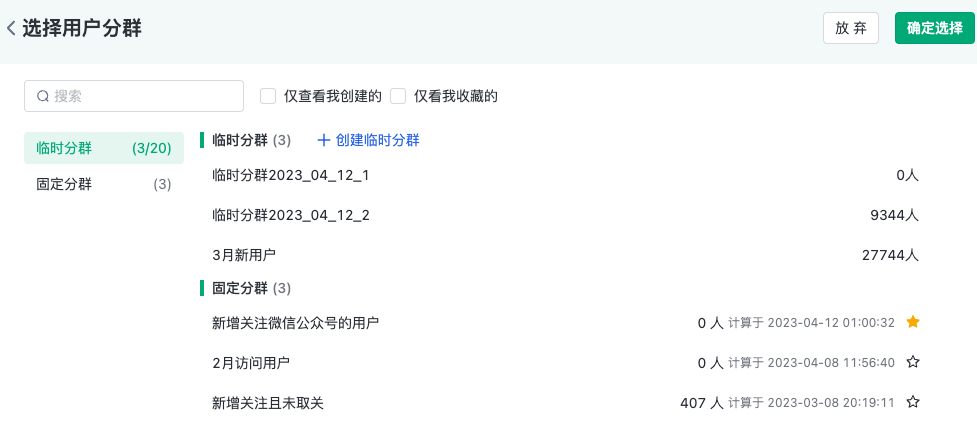
2.1.2. User segment
1. After selecting a metric, if the selected metric has a relevant relationship with the user table, "user segment" will become available.
2. Temporary segment:
In the metric analysis, a temporary segment can be created directly during the analysis process through rule settings based on attributes, tags, and behavior sequences. This allows for real-time and quick selection of the analysis segment without pre-configuring it in the "user segment" module.
Temporary segments can be used in subsequent analyses and will be recalculated based on the segment rules each time.
Up to 20 temporary segments can be stored, and management operations such as deletion and editing are supported.
ps:Note: Currently, only metric analysis supports temporary segments and they are not available in other analysis models.
2.1.3. Global filtering
In the global filtering, dimensions that can be added as filtering conditions are the intersection of available dimensions for the selected metric (excluding dimensions related to user attributes and user tags, filtering conditions related to users can be completed through creating temporary segments in the "user segment" module).
2.1.4. Time range
The "time range" is not available when the selected metric's source data table does not have a Datetime field.
2.1.5. Data truncation
When querying a large amount of data, data truncation may occur. The data displayed will be the top 10,000 groups of data based on the descending or ascending order of the value of the "first metric".
By adjusting the order of metrics and "Advanced Analysis Condition Configuration" - "Default Sorting", you can get the desired data results as much as possible. See 2.2.3 for details.
2.2. Advanced-Advanced Analysis Condition Configuration
2.2.1. Relationship
2.2.1.1. Relationship Concatenation and Switching
1. Cross-table analysis
Dimensions and metrics created from the same data table can be analyzed together;
After establishing relationships in "Metric Platform-Relationship Management", metrics and dimensions can also be used across tables
Example:
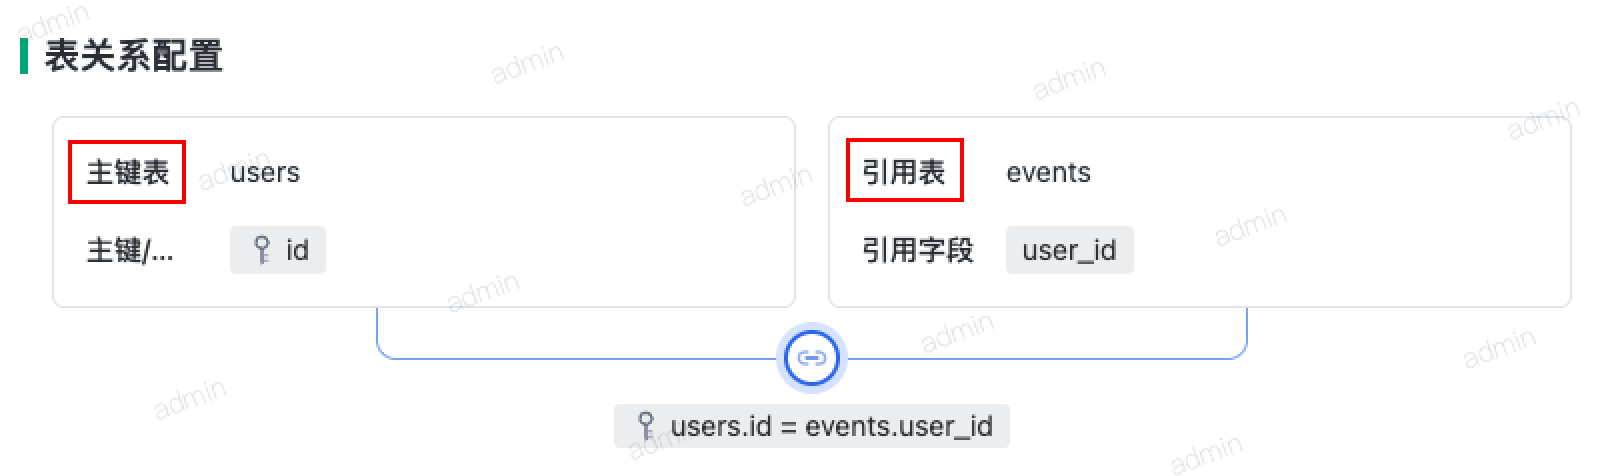
"Product Basic Information Table" stores basic information such as category and id of each product; "Event Table" records the product id included in each order event;;
After establishing a relationship with "Product Information Table" as the primary key table and "Event Table" as the reference table, you can use product category as a dimension to analyze the number of purchases, amount, and other metrics for different categories
2. Relationship Concatenation
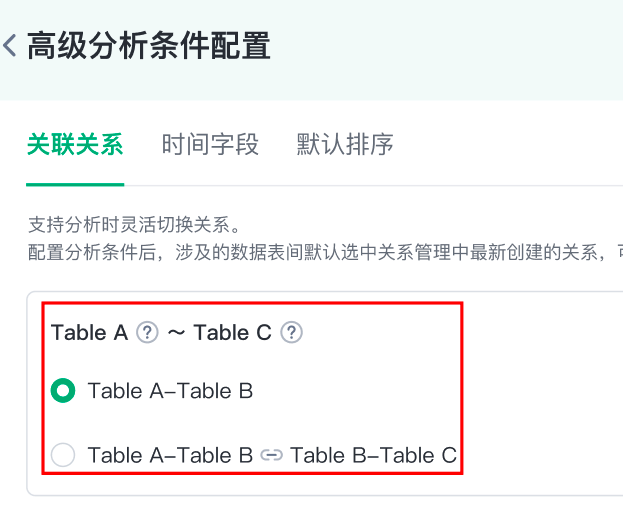
In relationship management, the relationship between two data tables is built; during analysis, all relationships are concatenated up to a maximum of 4 degrees (Table A-Table B <> Table B-Table C <> Table C-Table D <> Table D-Table E), allowing the use of dimensions and metrics across tables with up to 4 degrees of separation.
3. Switching Relationships during Analysis
Support flexible switching of relationships between dimensions and metrics in data tables during analysis; the calculation will be performed according to the selected relationship when performing a query.
The default setting selects the most recent and shorter association relationship between two tables. Example:
Three relationships are created in relationship management as follows:
- Relationship 1: Table A — Table B
- Relationship 2: Table B — Table C
- Relationship 3: Table A — Table C
When selecting dimensions and metrics during analysis from Table A and Table C, there will be two available relationships in "Advanced Analysis Condition Configuration-Relationships" between Table A and Table C:
- Relationship 3: Table A-Table C
- Relationship created by combining Relationship 1 and Relationship 2: Table A—Table B <> Table B—Table C
Default selected "Relationship 3", supports switching to "Relationship created by combining Relationship 1 and Relationship 2"
Scenarios for switching relationships during analysis:
If there are "group initiator" and "participants" fields in the "group order table", the user information of the initiator and participants are stored in the "user information table".
In "relationship management", two relationships can be established between the "group order table" and the "user information table": one with "group initiator" as the foreign key, and the other with "participants" as the foreign key.
During analysis, you can choose to view metrics such as order amount based on the "group initiator's membership level" (relationship with "group initiator" as foreign key), or the "participants' membership level" (relationship with "group participants" as foreign key).
4. Limitations on the direction of metric dimensions
Dimensions on the primary key table can be used to analyze metrics on the referenced table, but not vice versa.
2.2.1.2. Special instructions for metric analysis models
In metric analysis, metrics from "analysis models" and dimensions from "event attributes" will still be judged based on the relationship between "events" and "attributes".
The dimensions expanded based on relationships will also be limited to the dimensions created on the data table when the attribute of "this event" is used as the reference field.
In other words, dimensions and relationships created from attributes other than this event are not available for metrics of this event.
| Metric Source | Specific Source | Event Attribute Scope and other explanations |
|---|---|---|
| Session Analysis / Event Analysis | Specific metrics for events | The properties of this event |
| Session Analysis / Event Analysis | Metric of the virtual event | The union of the properties of the events included in this virtual event |
| Session Analysis / Event Analysis | Custom Metric | The intersection of the properties of the events involved in the custom metric Relationship: Requires that the atomic metrics have a conditional relationship with the corresponding data table |
| Event Analysis | Metric of any event | The intersection of the properties of all visible events |
| Predefined Metric | Metrics created through predefined metrics in event analysis, can be queried with "day" granularity, and must add the "time-day" dimension to initiate the query | |
| Session Analysis | Metric of Session overall/any event | The union of the properties of the events within the session |
| Retention Analysis | —— | Metrics created through retention analysis. Currently, using dimensions (including dimensions created on data tables with relationships to event tables) with the source "event property" as dimensions or filters is not supported. The corresponding "time" dimension must be added with the corresponding granularity to initiate the query |
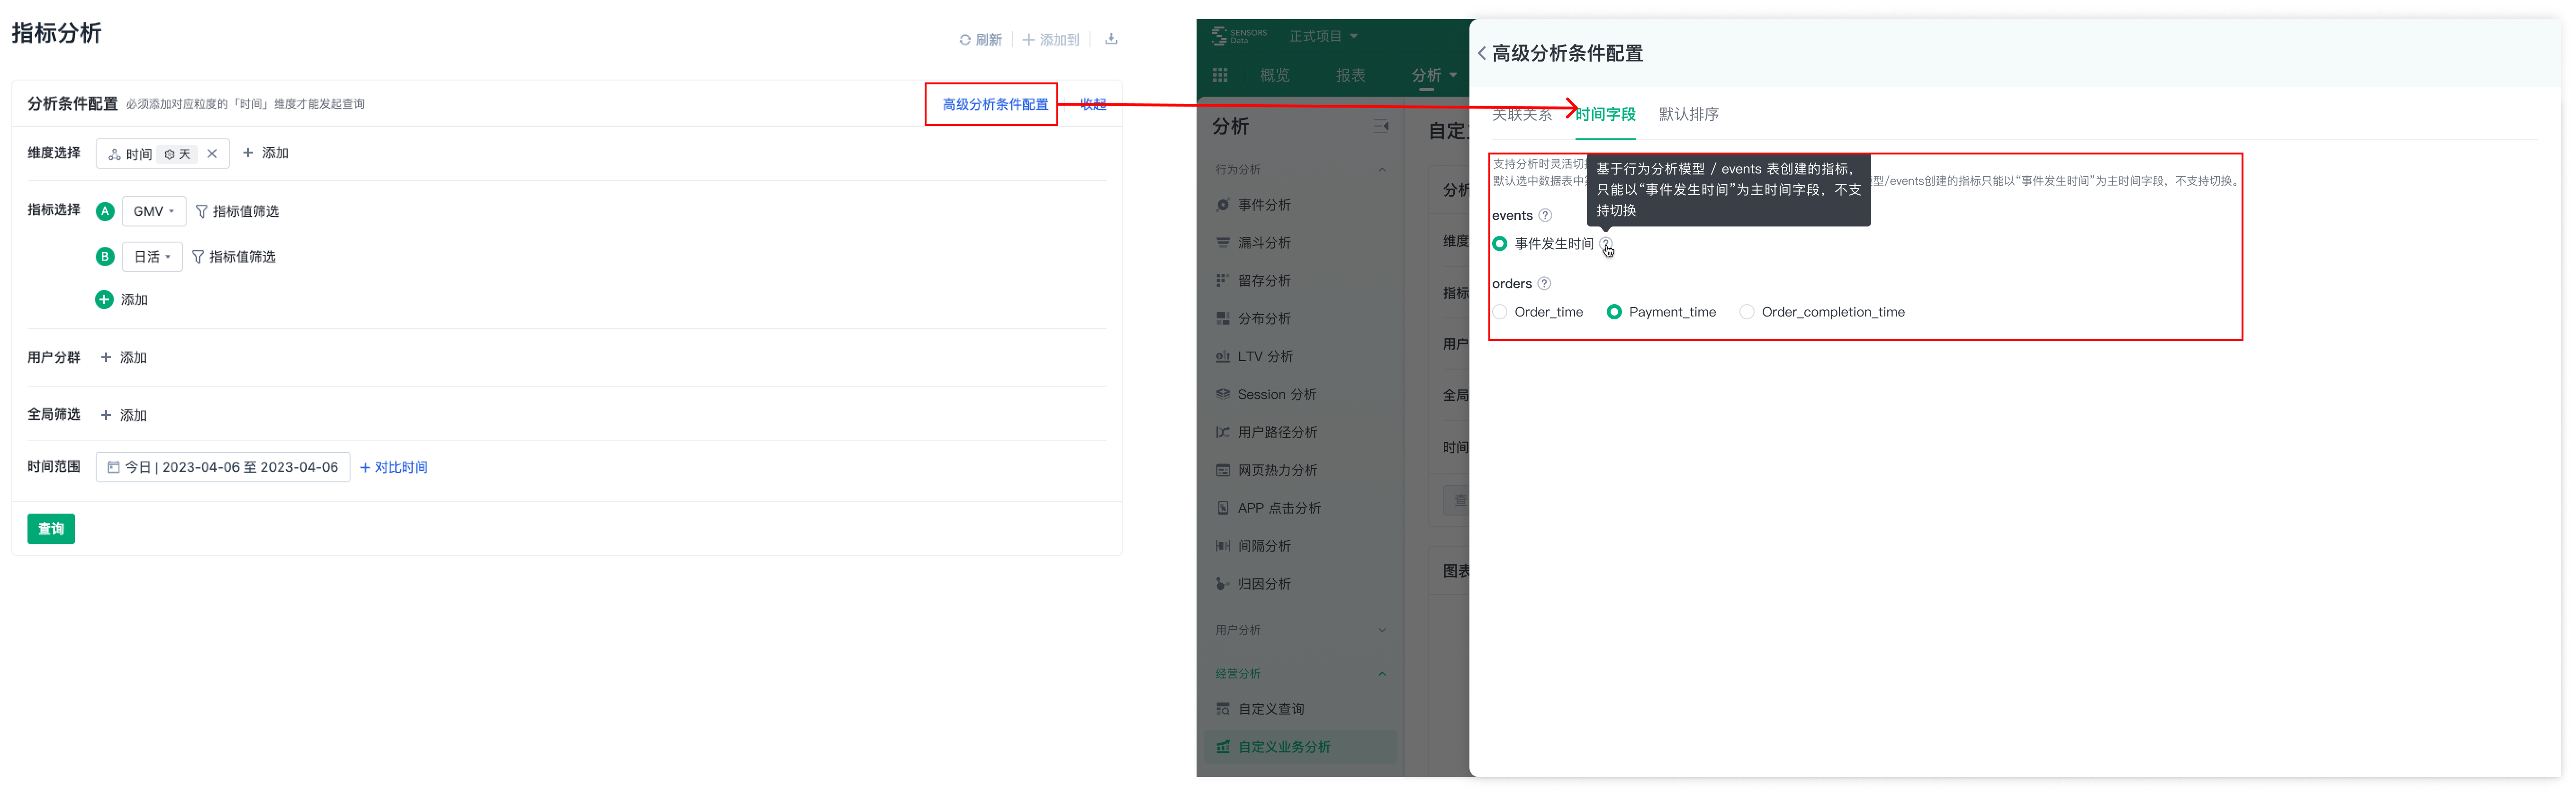
2.2.2. Time Field
Time range filtering and the field corresponding to the "Time" dimension behind the preset system are called "Primary-Time Dimension".
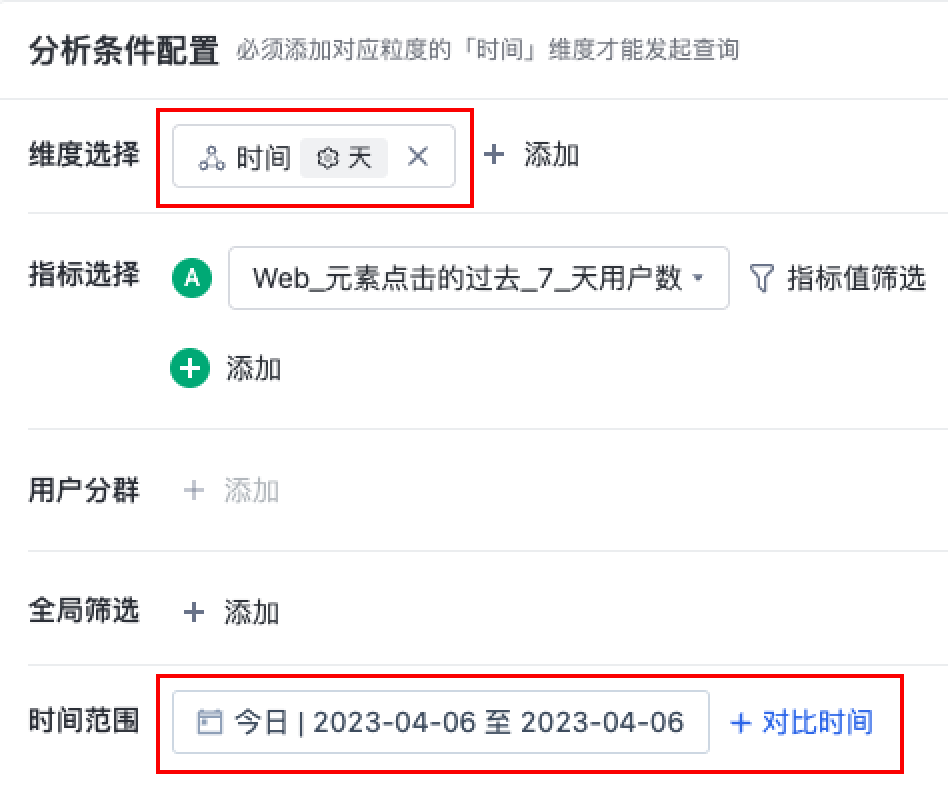
1. In metric analysis, when metrics come from different data tables, the system will automatically select the first column with a data type of Datetime as the primary-time dimension field in each table. These fields are consolidated together to achieve consistent time filtering and dimension value expansion for all metrics.
2. When switching the "Primary-Time Dimension" for each data table during analysis, the field's data type should be Datetime. Specifically, for the metrics created based on the Behavioral Analysis Model / events table, only the "Event Occurrence Time" can be used as the primary-time dimension and cannot be switched. Switching may cause performance issues.
For example, when analyzing both GMV and DAU, where GMV comes from the order table and DAU comes from event analysis, the time range is set to 2023-04-06. The time filtering will be applied to both the order table and event table. The primary-time field of the order table can be switched, allowing you to view the GMV where "Order Time" is equal to 2023-04-06, or switch to "Payment Time" or "Order Completion Time".
2.2.3. Default Sorting
When querying a large amount of data, data truncation may occur. The data is displayed by grouping the top 10000 based on the "First Metric" value in "descending" or "ascending" order.
1. In "Advanced Analysis Condition Configuration"-"Default Sorting," you can switch between "descending" or "ascending".

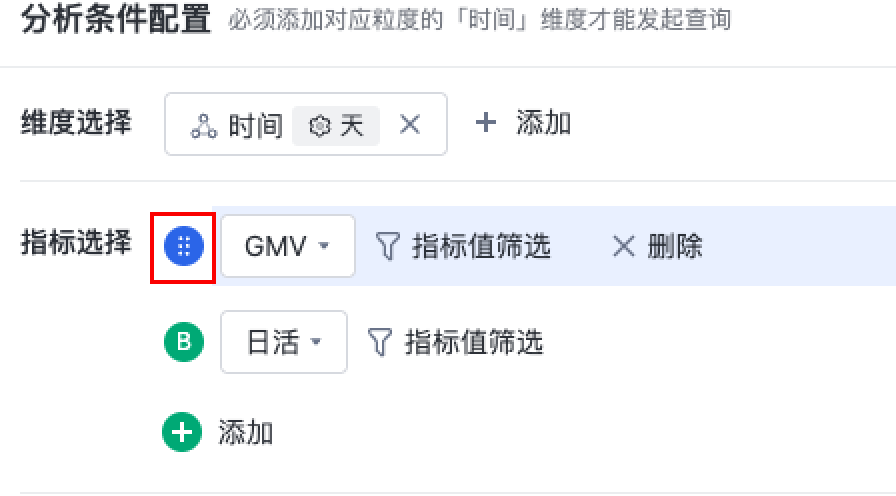
2. In the analysis condition configuration area, you can drag the metrics to adjust their order: Hover over the letter index before the metric, and it will become draggable. Move it up or down to adjust the order of the metrics.
Note: The content of this document is a technical document that provides details on how to use the Sensors product and does not include sales terms; the specific content of enterprise procurement products and technical services shall be subject to the commercial procurement contract.
 Popular Searches