Product problem
|
Collect
1. How do I view daily PV and UV?
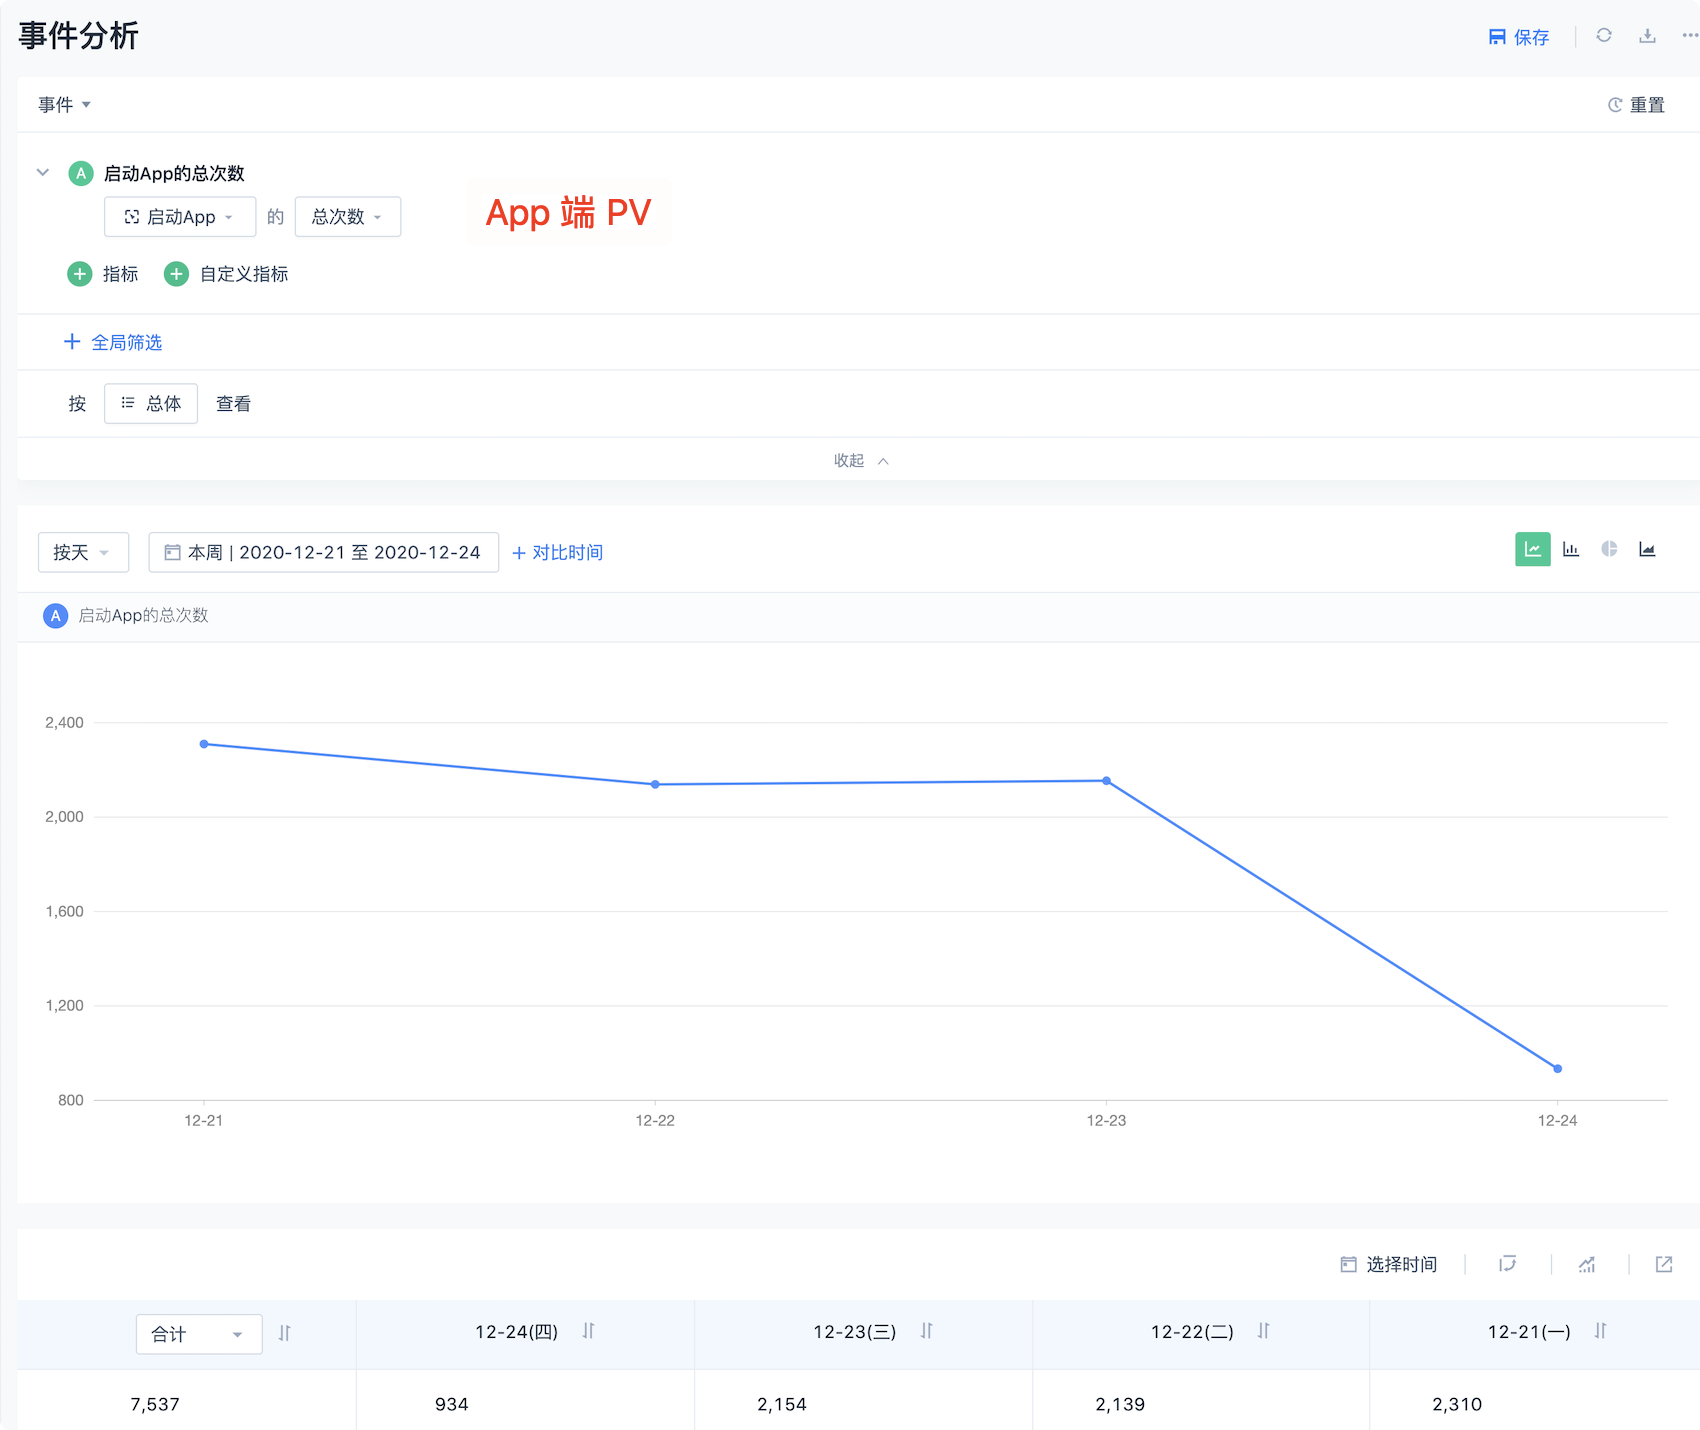
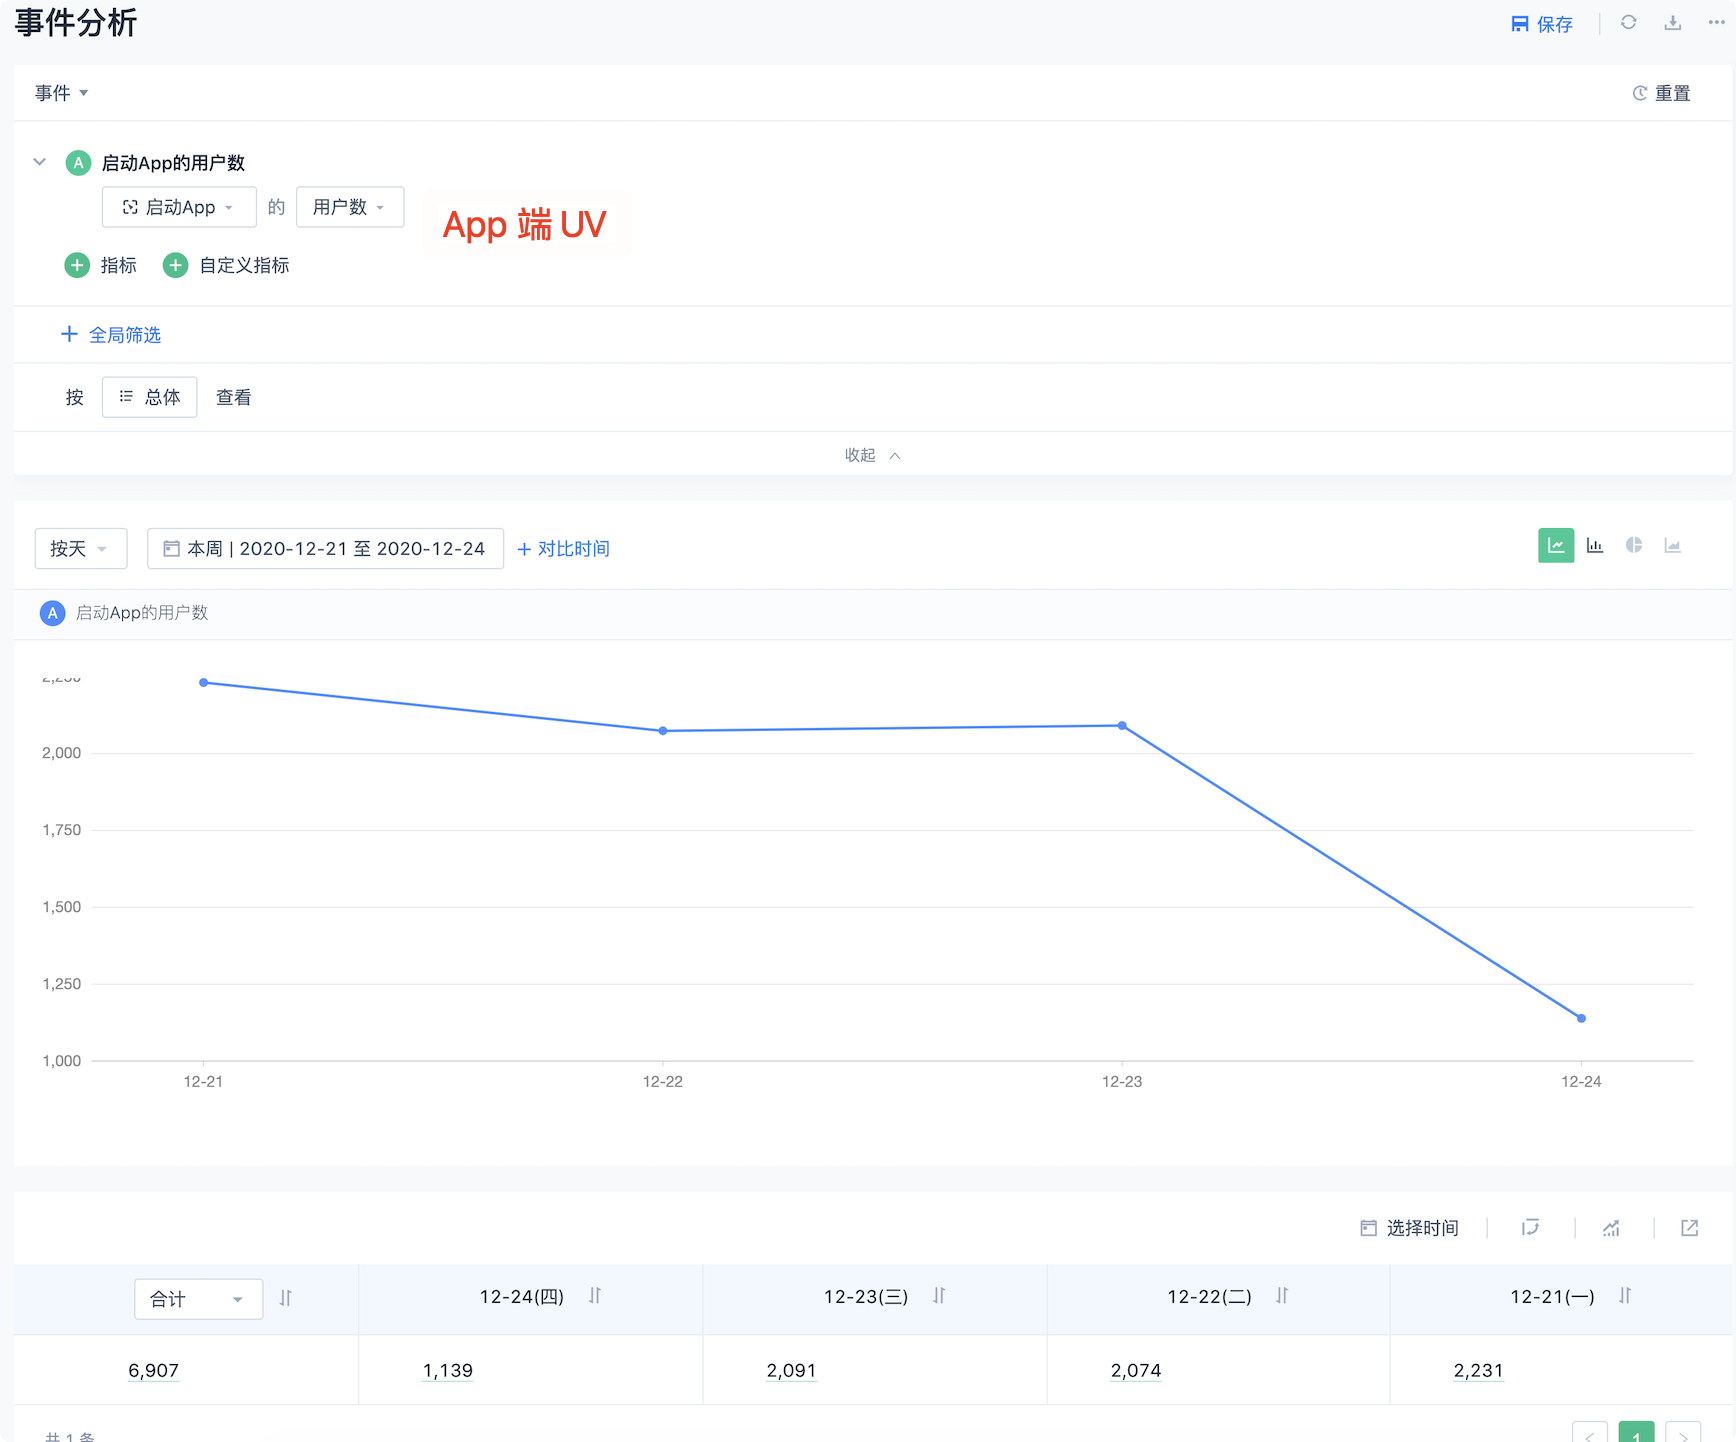
If it is an App side product, you can use Shenze's all-buried event App to start the event to view the daily PV and UV. (The trigger time of the App startup event is when the full buried point is opened. Every time the App is opened or woken up from the background, an App startup event will be triggered.)
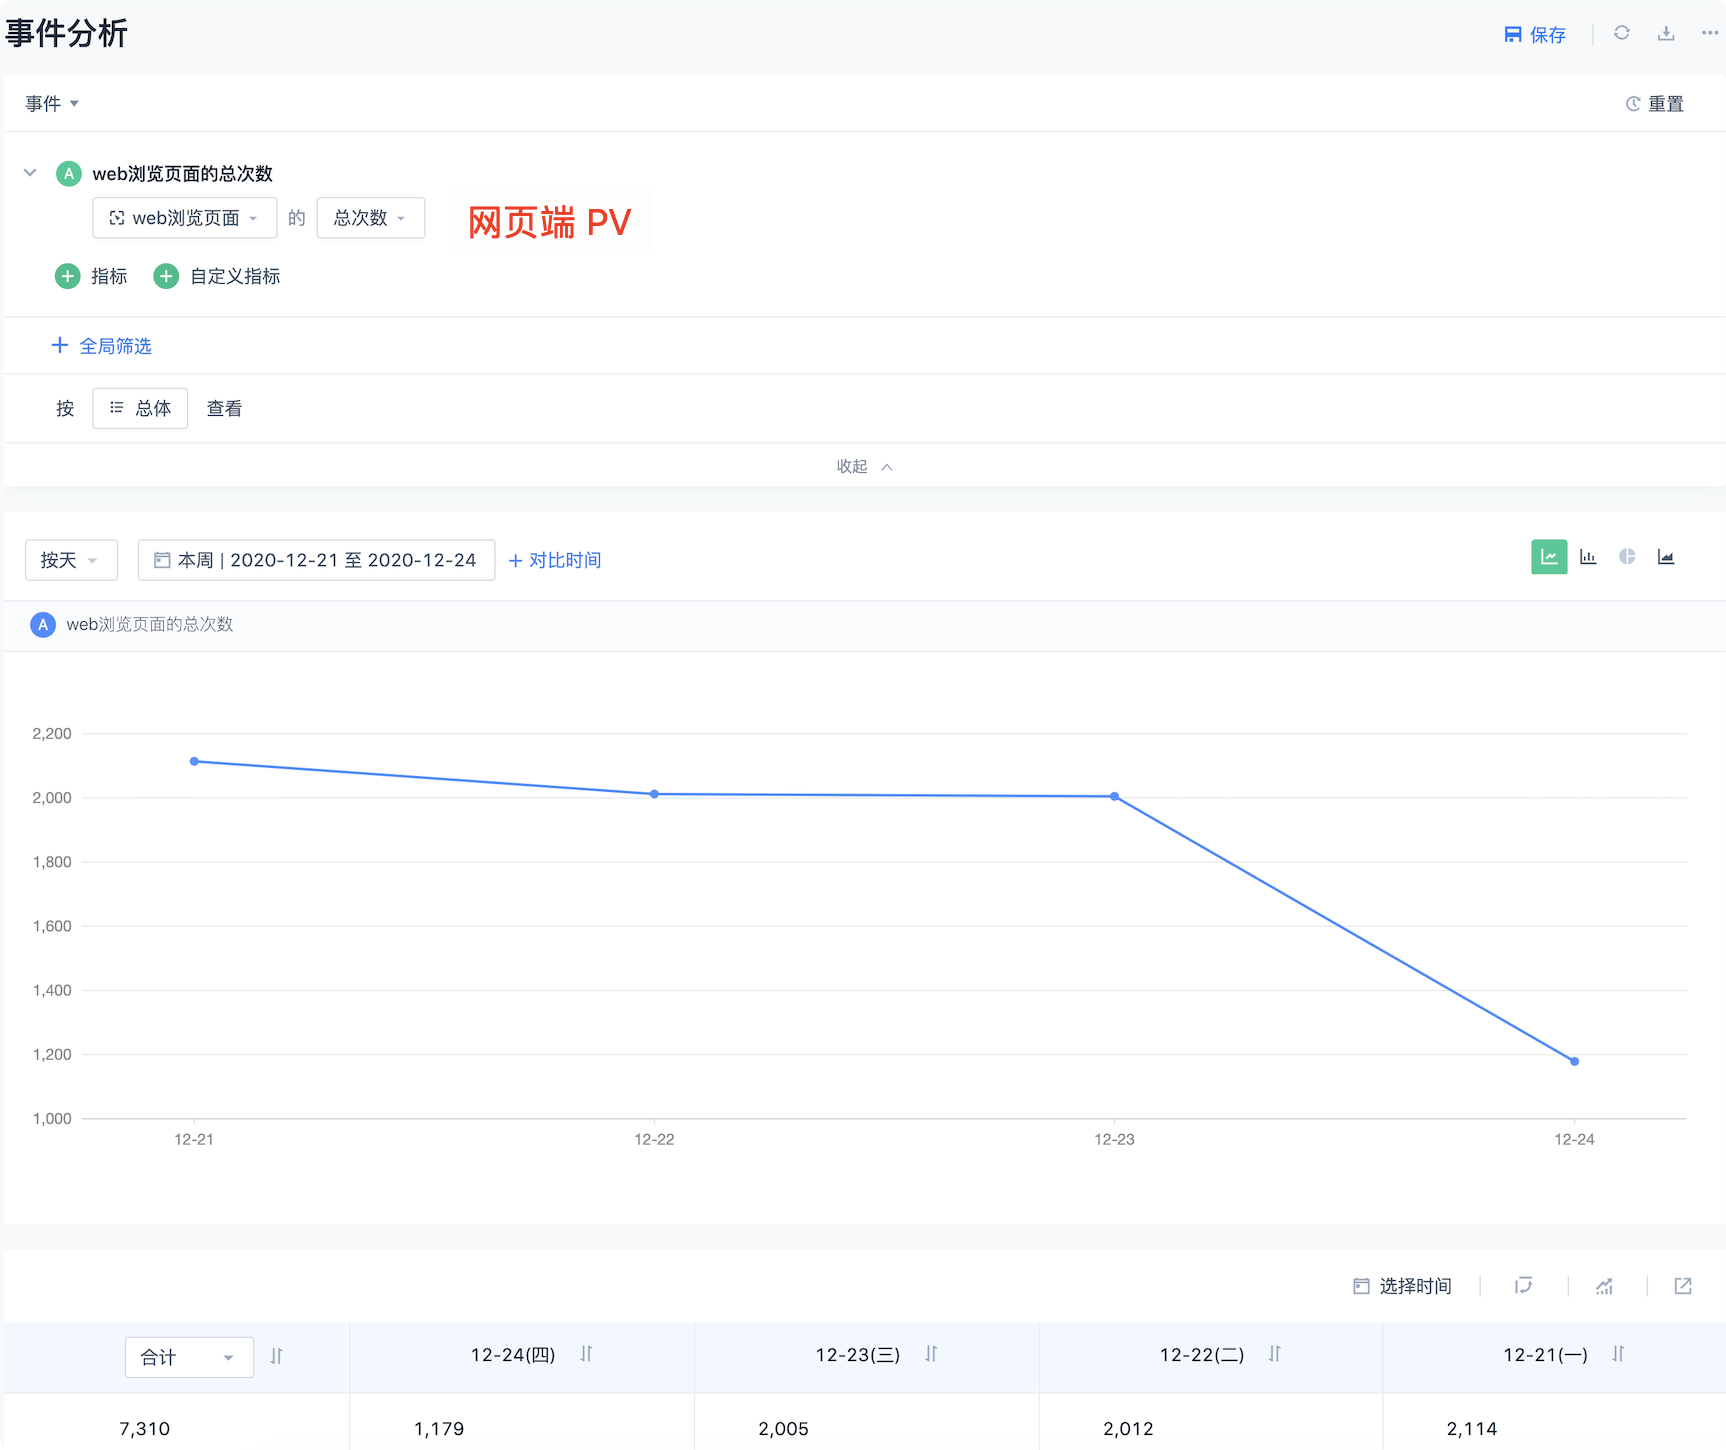
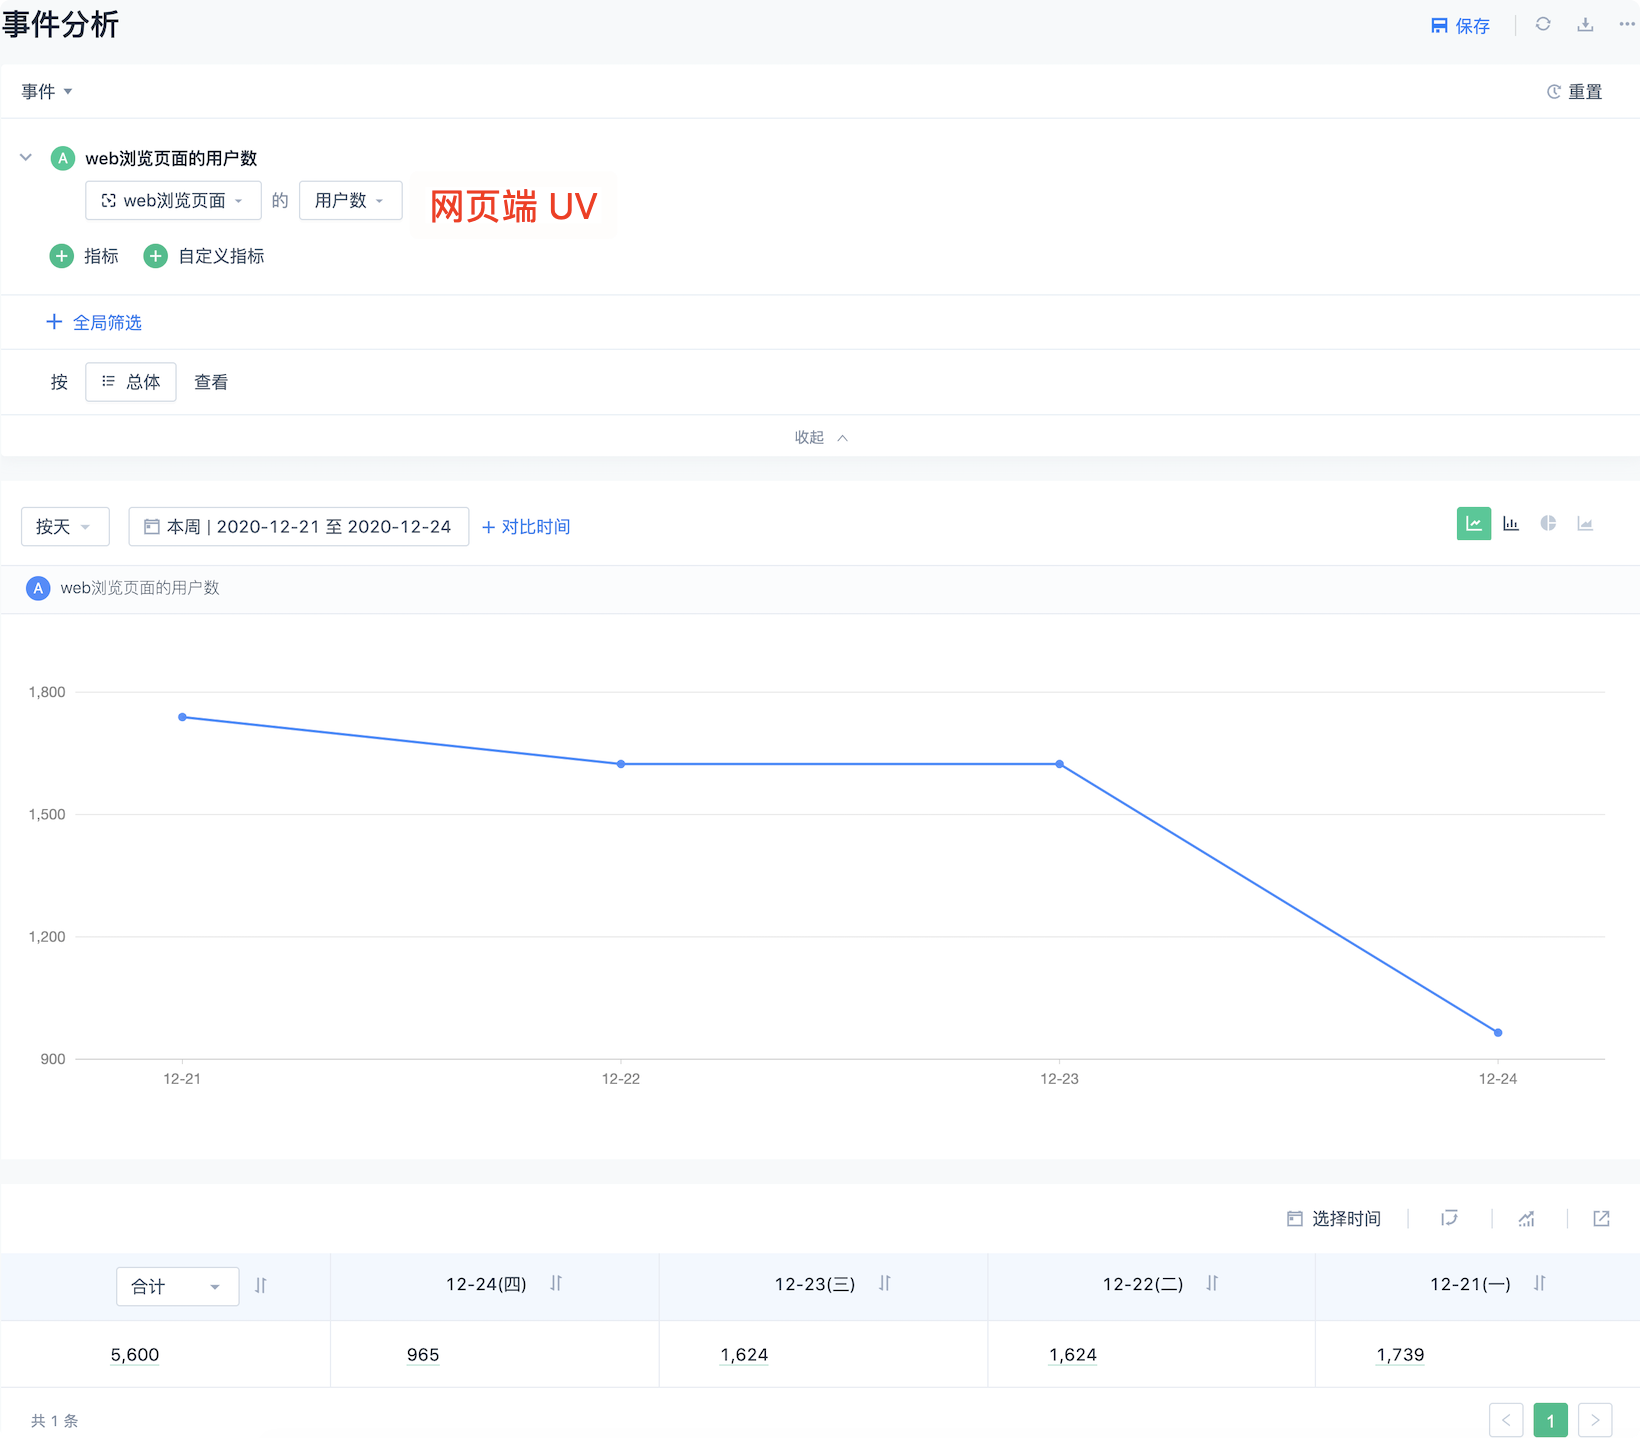
If it is a Web side product, you can use the web side buried event Web page browsing event to view PV, UV. (The collection time of Web page browsing event is in the case of opening the full buried point, when opening the page, a Web page browsing event will be collected)
2. How to check the page stay time?
By default, the browsing duration of each page is not collected for the preset Web page browsing/App page browsing/applet page browsing events. If you want to analyze the time spent on each page, there are two ways:
- The customer needs to customize the buried point to collect the browsing time attribute of each page, so that the calculation result is more accurate, but the buried point is time-consuming.
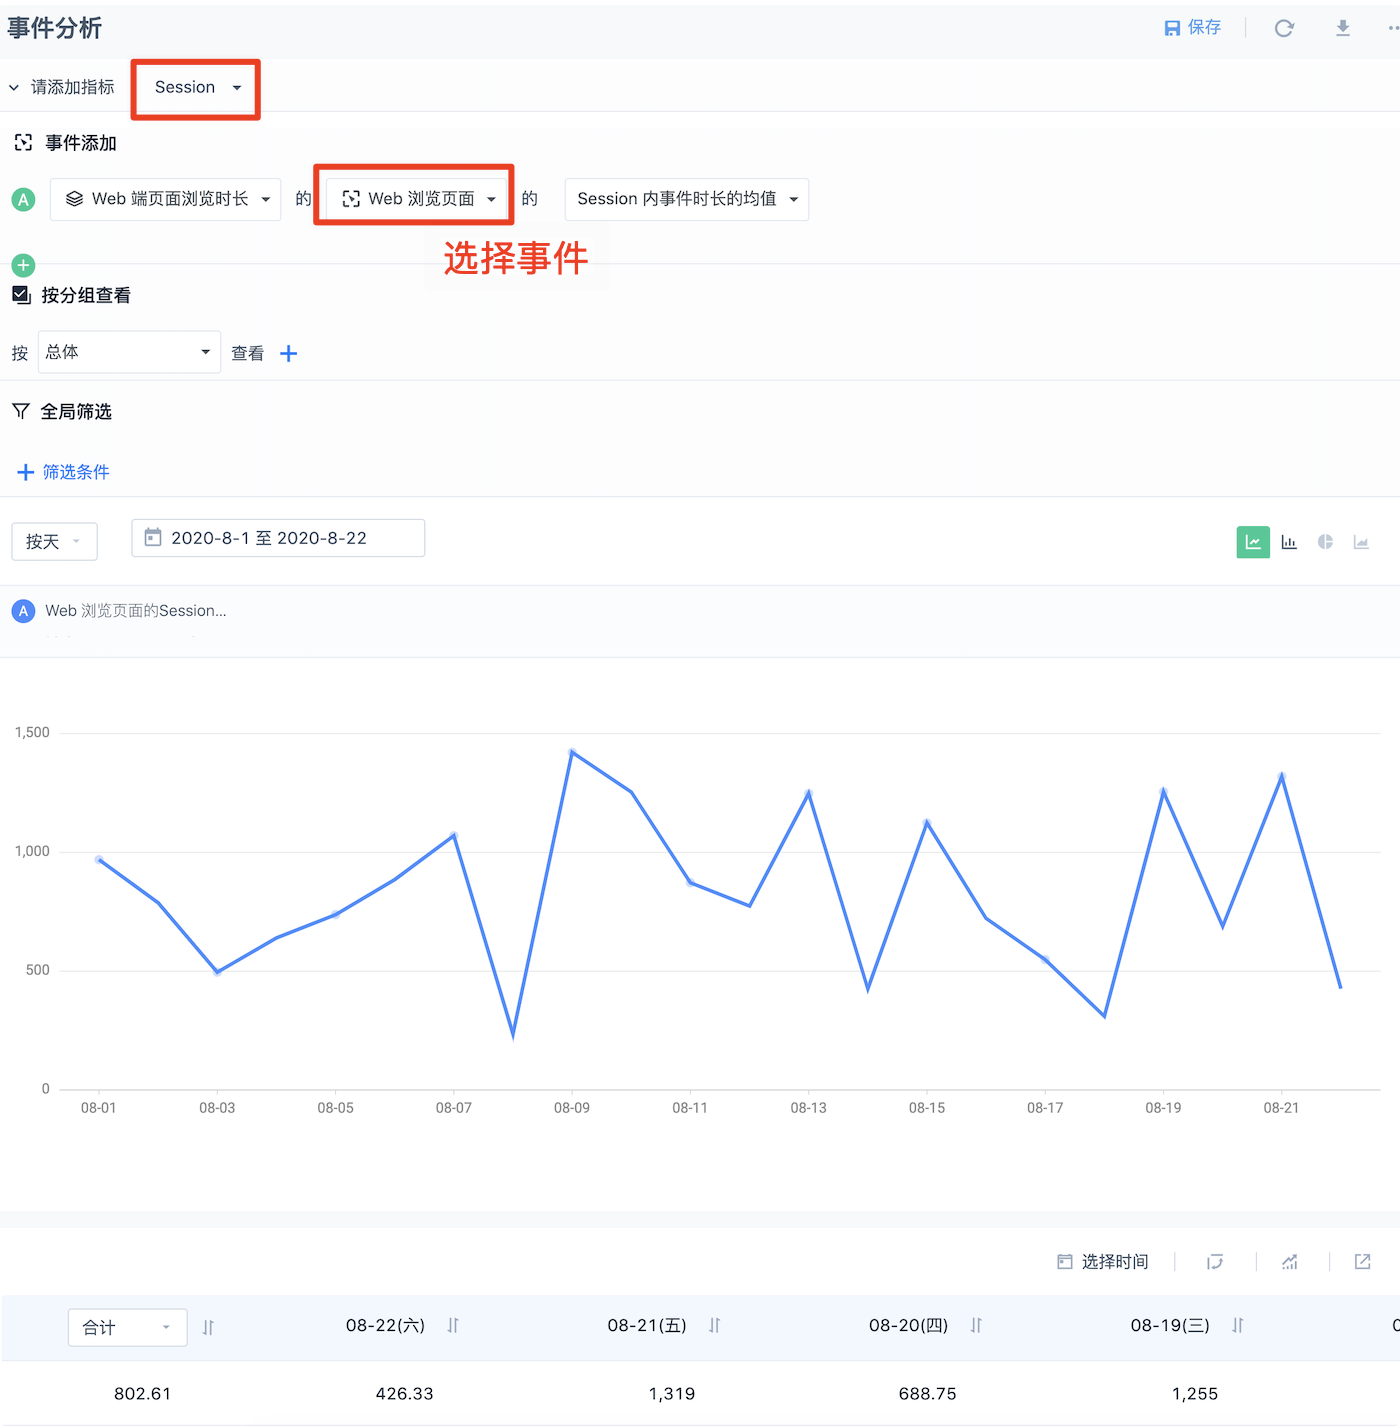
- Using Session analysis, roughly calculate the browsing duration of each page through the definition of the Session (the general meaning is that the session definition is different, and the duration of each event may be different), and then analyze the duration related indicators. The following uses Session analysis to analyze the browsing duration on the Web. (The analysis of the App side and the applet side is similar, and the events contained in the Session need to be replaced with App page browsing/applet page browsing events)
First, define a Session that contains Web page viewing events, and set the cut time to 30 minutes (experience).。

Secondly, check the average visit time of the page according to the screenshot below
3. How to check App usage time?
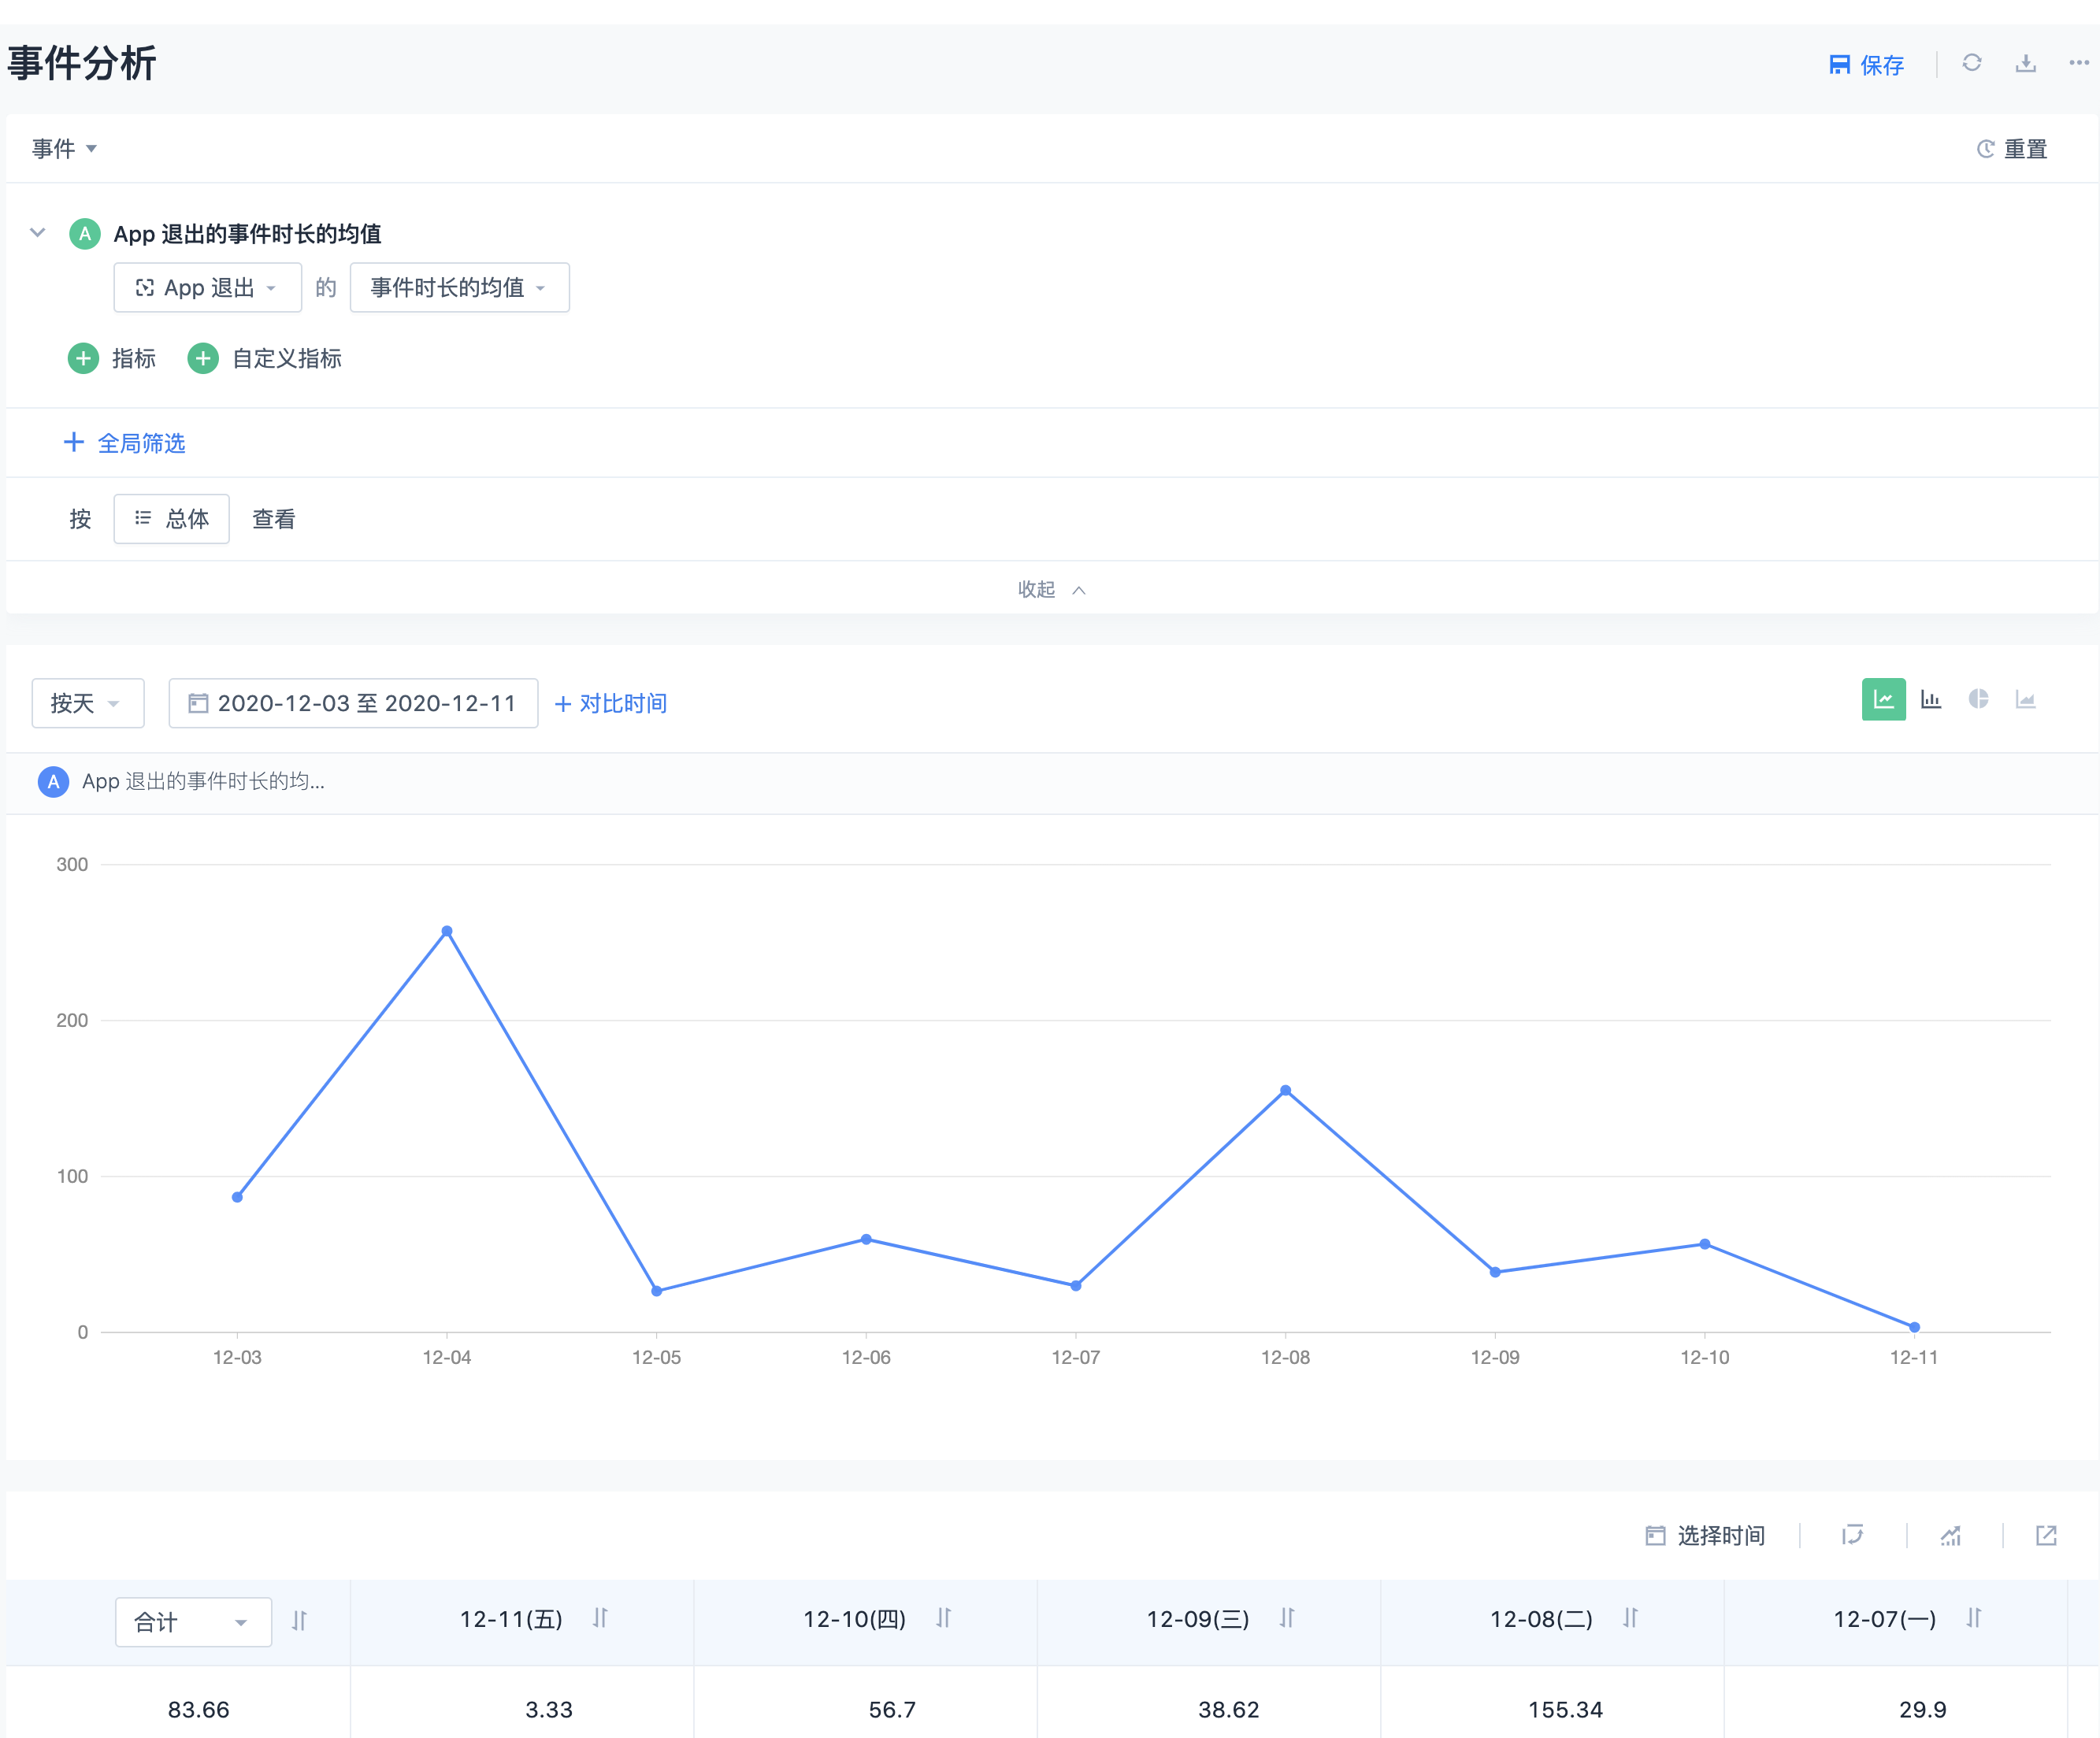
By default, when the App exits, the usage duration of the accessed App (the access interval from App startup to App exit) is collected. You can view the average usage duration of the accessed App by viewing the average event duration of App exit.
4. How to create a purchase conversion funnel?
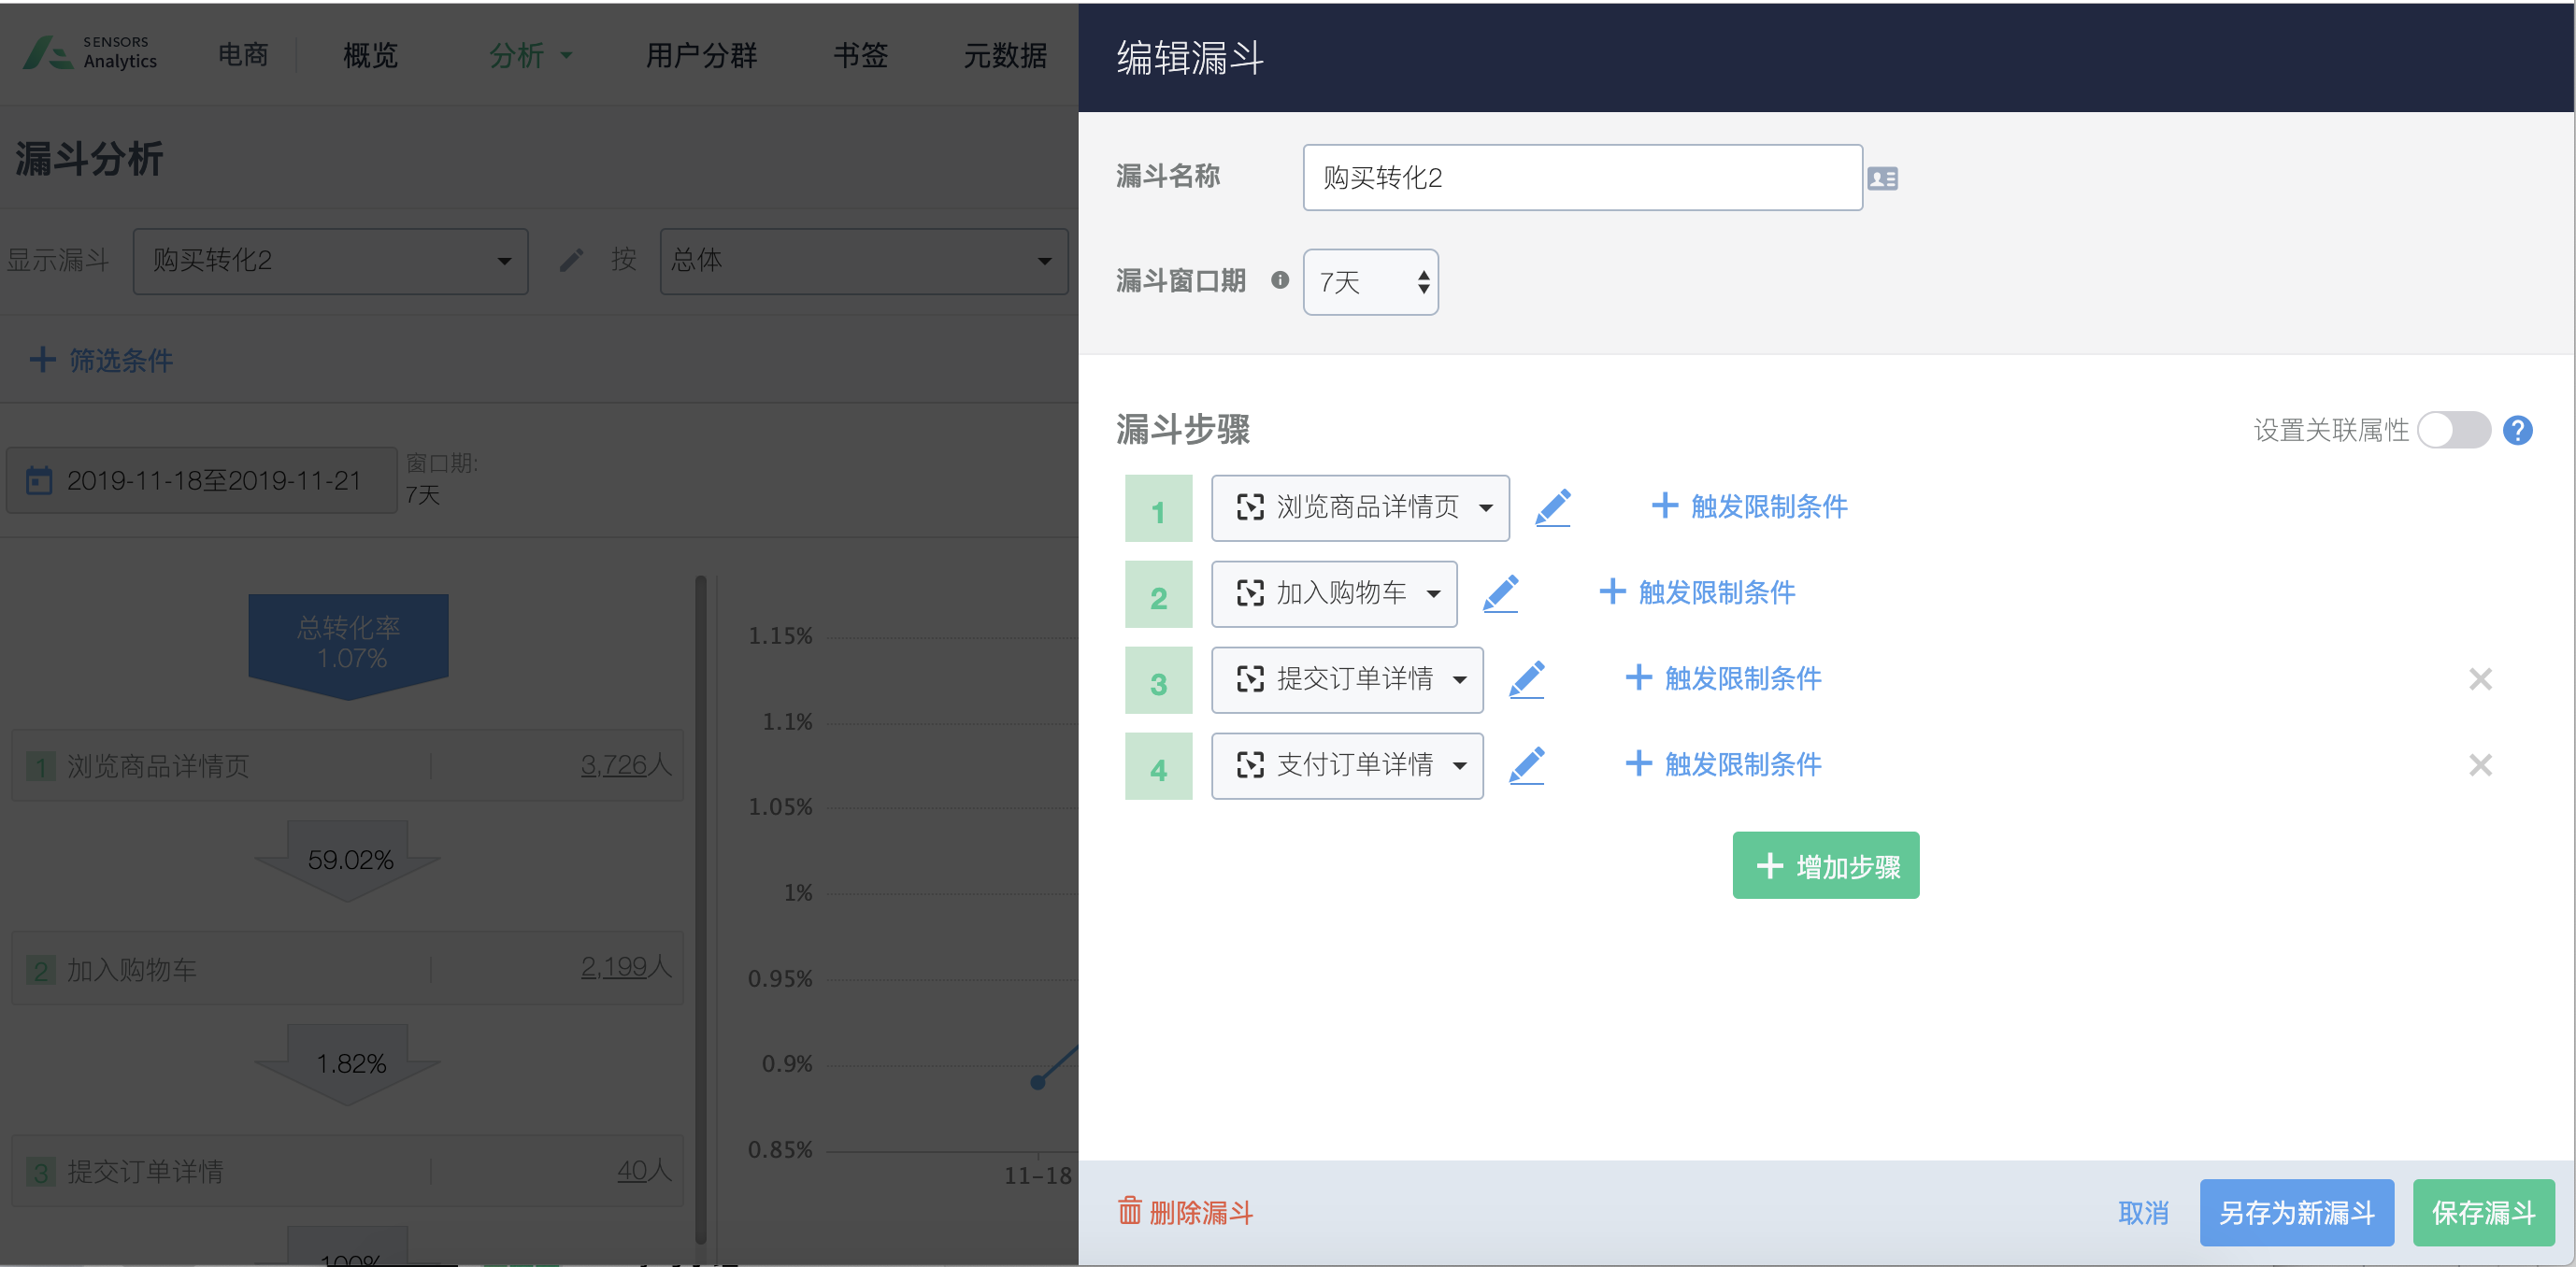
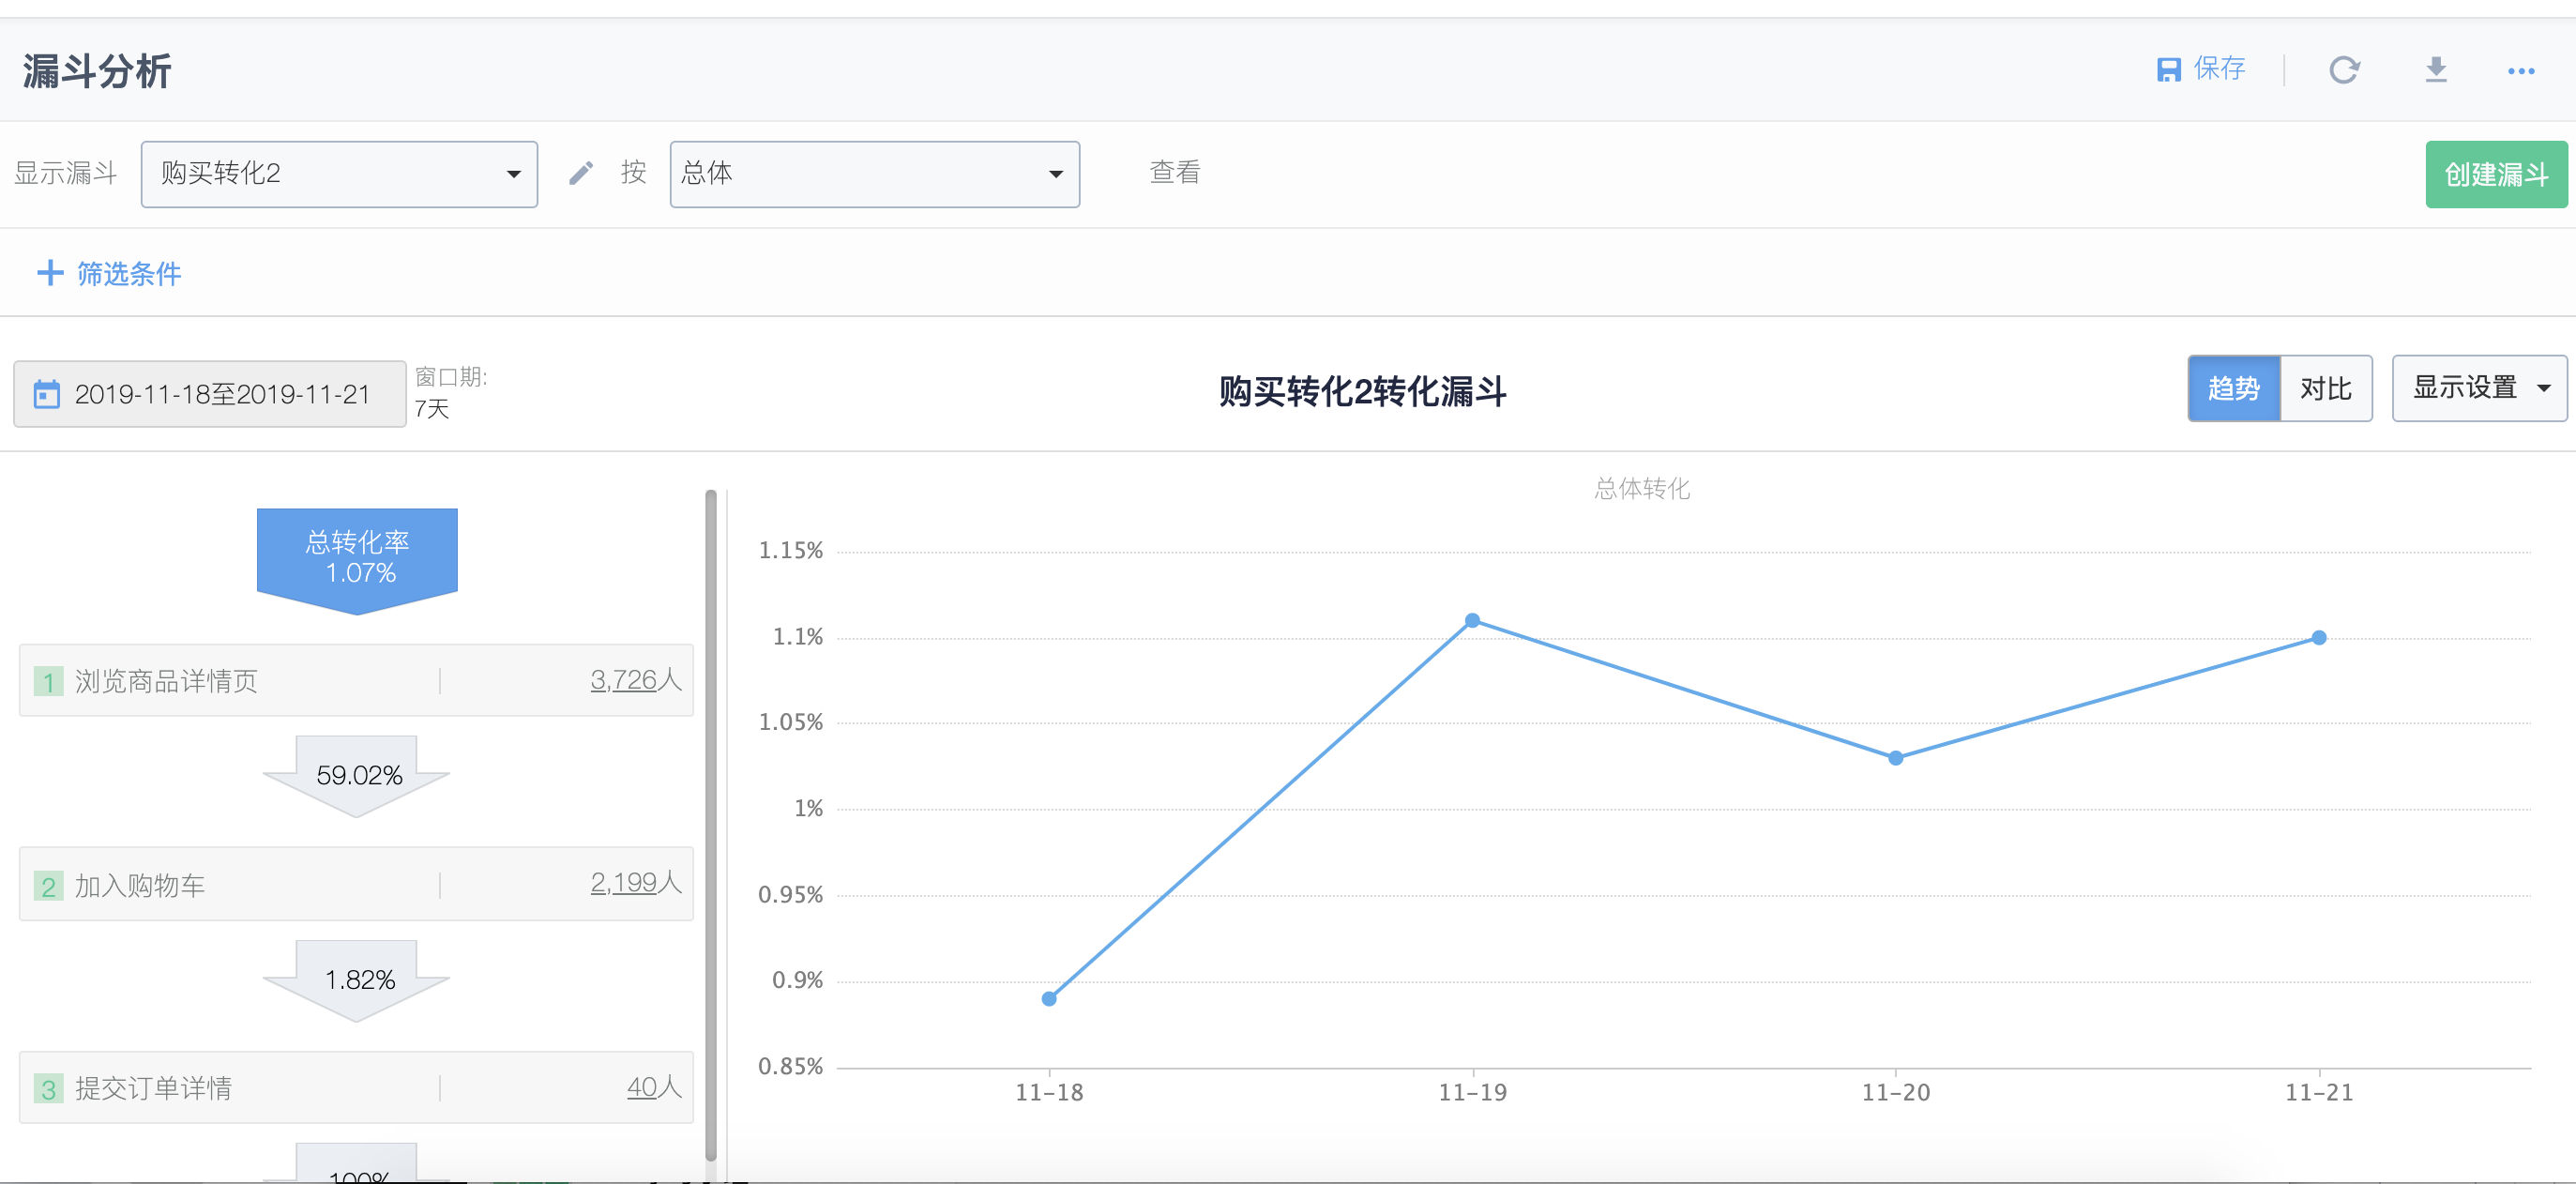
Select the funnel analysis model, create a new funnel, and select the purchase conversion behavior event you defined in the funnel, for example, define the funnel conversion step as: Browse product details - > Add to cart - > Submit order details - > Pay the order details, after the creation is complete, you can view the conversion process of the corresponding funnel.
5. Why is the data queried by Sensors different from the data collected by the third-party platform/own business database?
5.1. Compare the data with third-party platforms
Since the logic and calculation rules of data collection on different platforms may be different, it is of little significance to simply compare the statistical results. When comparing the statistical data of Shenze analysis and the data of third-party platforms, you can first confirm whether the logic and calculation rules of the data collection of the two platforms are the same.
At present, the comparison platforms supported by Sensors include Baidu Analytics, Google Analytics, and Youmeng. Comparison is not recommended on other platforms. If comparison is required, the logical description of the data collected by the third-party platform, the description of the calculation rules, and the corresponding query conditions and query results should be provided, and the students on duty of Shence should assist in the investigation.
5.2. Compare with the data in your own business database
For example, the number of users of registered events collected by Sensors Analysis is different from the number of users of the customer's own business platform. It can be queried as follows:
a.First of all, confirm whether the events collected by Shenze analysis are consistent with the collection logic of the customer's own business database data. If the collection logic is inconsistent, it is impossible to compare whether the data is consistent.
b.Secondly, check whether the calculation rules of the query are consistent with the rules of marking users. Both the calculation rules and the way of marking users directly affect the statistical results. The calculation rules and user marking methods of Shence analysis indicators can be referred to the official documents of Shence.
c.Then confirm what is the proportion of differences, whether there are daily differences, and whether the differences are stable.
d.Let the customer query the specific user according to the user information, which user is missing in the Shence system/customer's own business database, and then query whether the user is data in the Shence system.
6. Event Analysis page Why is the data from the past day viewed today different from the data viewed yesterday?
Cause: Check whether the event data is collected by the App. By default, the App receives data within 10 days. Because the App will have delayed data reporting (for example, before the data is sent, the user forcibly kills the APP, the data will be stored locally, and will continue to be reported when the APP is started next time), if the data within 10 days is queried and the cache is forcibly refreshed, there may be a small number of changes.
Suggestion: You can view the data generated 10 days ago. When querying the data for the first time, click Refresh cache in the upper right corner of the analysis page to update the cache. Then compare whether the data queried at different times is consistent.
7. How to identify the specific keywords that users come through Baidu?
There are two main situations for users to jump to their own website through Baidu search results:
One is to click on the promotion results (generally known as sem) through their own purchase of keywords, for this scenario, we recommend that when doing keyword placement, for different keywords, make a distinction on the URL placement, for example, the website home page ishttp://www.example.com,Then, for the keyword keyword1, the URL ishttp://www.example.com/?utm_source=baidu&utm_term=keyword1,In the actual display of the page, it is still to show the home page, but you can know from the URL that the user is through which keywords to come;
The other is through natural search results (generally known as seo), because Baidu in 2015, has removed the keyword display in the referer, so there is no good way for third parties to get specific jump to the keywords.
8. How can we help different colleagues configure different reports when using it?
Sensors Analysis currently provides a complete permission model, where administrators can configure data overviews and share them with others. Specifically, there are three types of default accounts that can also be customized, each with the following functions:
- Administrator:
- Permission management: has the "Account Management" function and can also "Authorize Reports";
- Data analysis: All data analysis functions can be used;
- Overview: Can view overviews shared by oneself and others, create overviews, edit self-created overviews; and can share overviews with other users through the "Overview Authorization" function;
- Funnel: Administrators can create funnels and delete their own funnels, and the created funnels are visible globally;
- Analyst:
- Data analysis: All data analysis functions can be used;
- Overview: Can view overviews shared by oneself and others, create overviews, edit self-created overviews; due to the lack of the "Overview Authorization" function in the "Permission Management" function, overviews can only be used for personal use;
- Funnel: Analysts can create funnels and delete their own funnels, and the created funnels are only visible to themselves;
- Normal user:
- Overview: Can view overviews shared by others; and when clicking into an overview, can only adjust the time interval without making other filtering and grouping adjustments.
Note: The content of this document is a technical document that provides details on how to use the Sensors product and does not include sales terms; the specific content of enterprise procurement products and technical services shall be subject to the commercial procurement contract.
 Popular Searches