Reports
|
Collect
To enable this feature, please consult with our customer success team.
Note: It is necessary to upgrade the sensors analysis version to 2.5 and above, report 0.7 and above.
Product positioning
As a next-generation self-service big data analysis tool, Reports aims to help businesses quickly build a self-service analytics platform for all members to fully understand and utilize their data.
Users of Reports can handle and analyze data on their own, thereby assisting decision-making and improving business effectiveness.
In terms of capabilities, Reports provides enterprises with an all-in-one business intelligence solution that includes functions such as data preparation, data processing, visual analysis, data sharing, and management. It is built around the unique analysis module of Sensors Analytics to help users quickly create user analysis and business analysis scenarios, ultimately enhancing the value and efficiency of visualization.
Terminology
Business Model Related Terminology:
- Business Model: An intermediate table that stores analysis models, custom query results, and data tables. It supports visual configuration and serves as the foundation for data.
- Business Model Name: The display name of the business model.
- Business Model Detail Page: The page that displays the data information and query statement of the business model.
- Business Model Creator: The member account who created the business model.
- Field Name: The name of the field in the business model.
- Field Display Name: The display name of the field.
- Calculated Column: A new field obtained by applying formulas or functions to original fields for data processing.
- Dataset: A platform that centrally manages the scheduling of business model updates and permission settings.
Data Update Related Terminology:
- Manual Update: Manually triggering the execution of data update tasks.
- Routine Update: Timely execution of data update tasks according to a certain frequency.
- Incremental Update: Calculate data based on the new and retrospective dates, where the retrospective data will overwrite some of the original data
- Full Update: Update all data each time and overwrite existing data
Permission-related Terminology:
- Management Permission: Allows collaborative managers to jointly manage the current resource, such as editing, updating, deleting, etc.
- Data Permission: Allows users to view data content and use data content within their own permission range to configure visualizations
Product Components
Module | Use Cases |
|---|---|
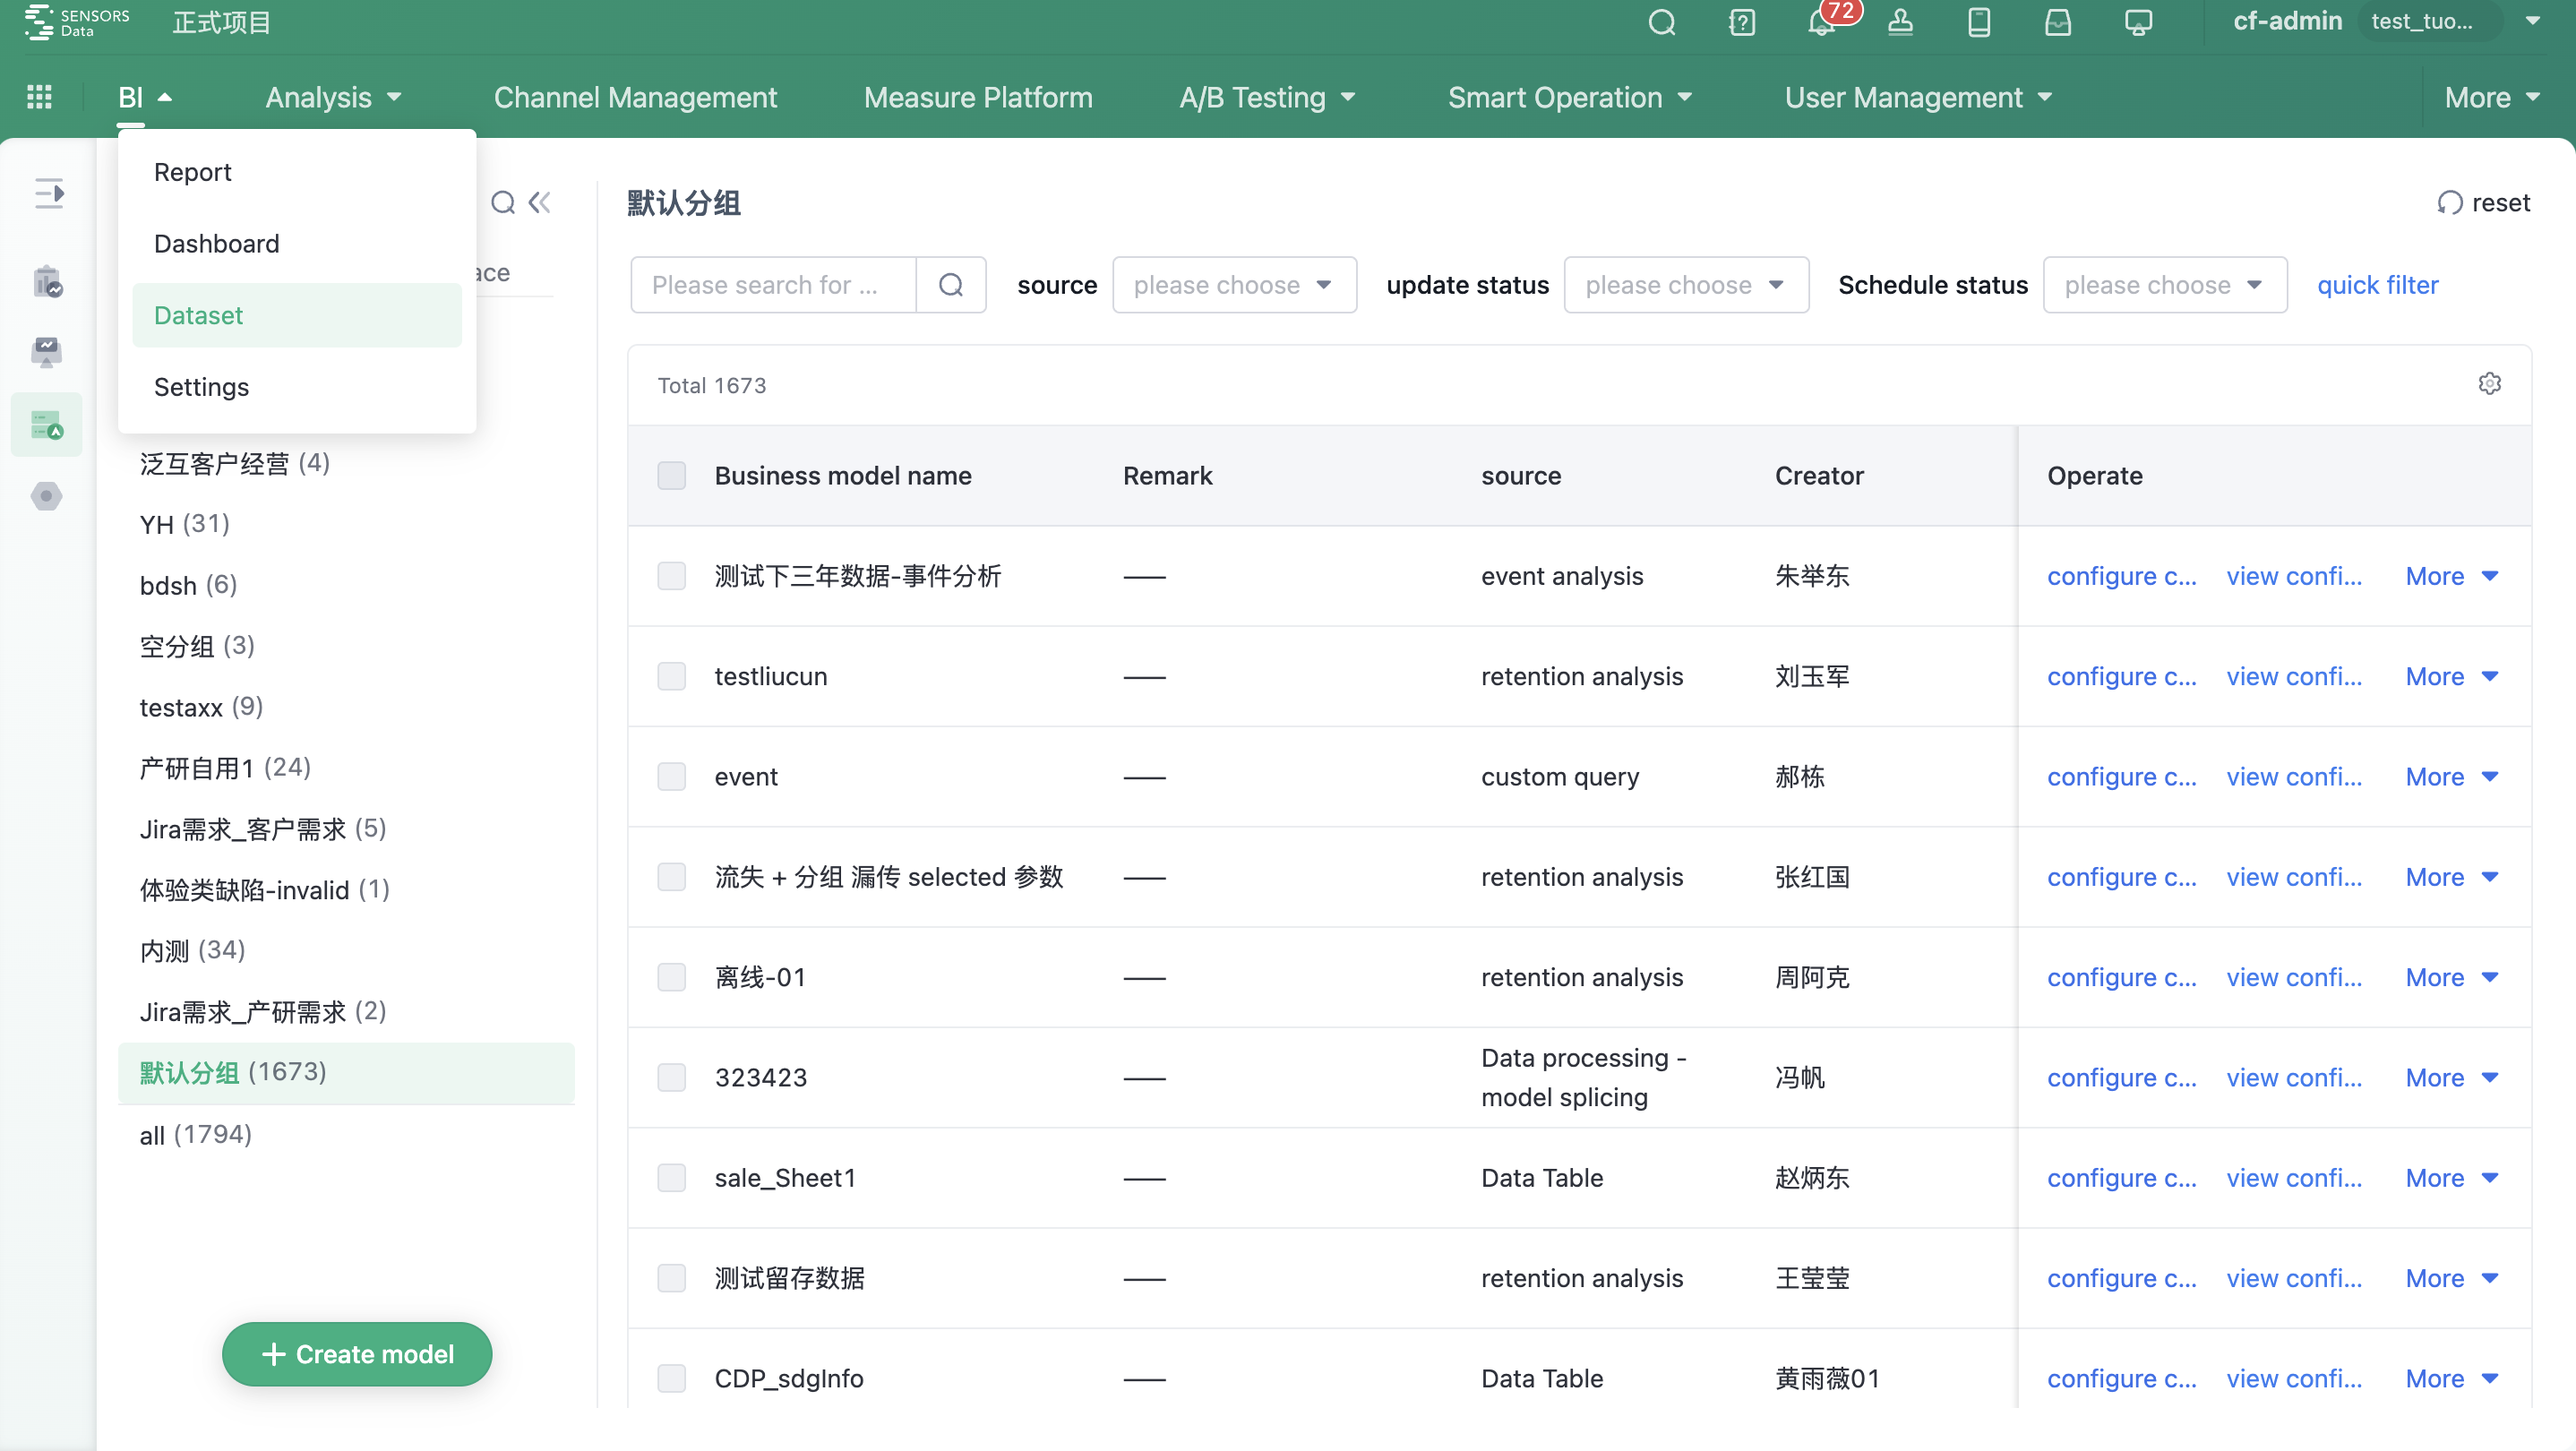
| Dataset | Data experts and development engineers create data models, manage data assets, distribute permissions, monitor task scheduling and update status, and understand resource allocation overview. |
| Visual Configuration | Analysts and senior business personnel design the appearance of visual components and reports. |
| Report Presentation | General users can visualize and share reports, edit and view reports on the frontend. |
| Mobile End | Responsive mobile end display, configures on PC end and presents on mobile end, ensuring data consistency and configuration convenience. |
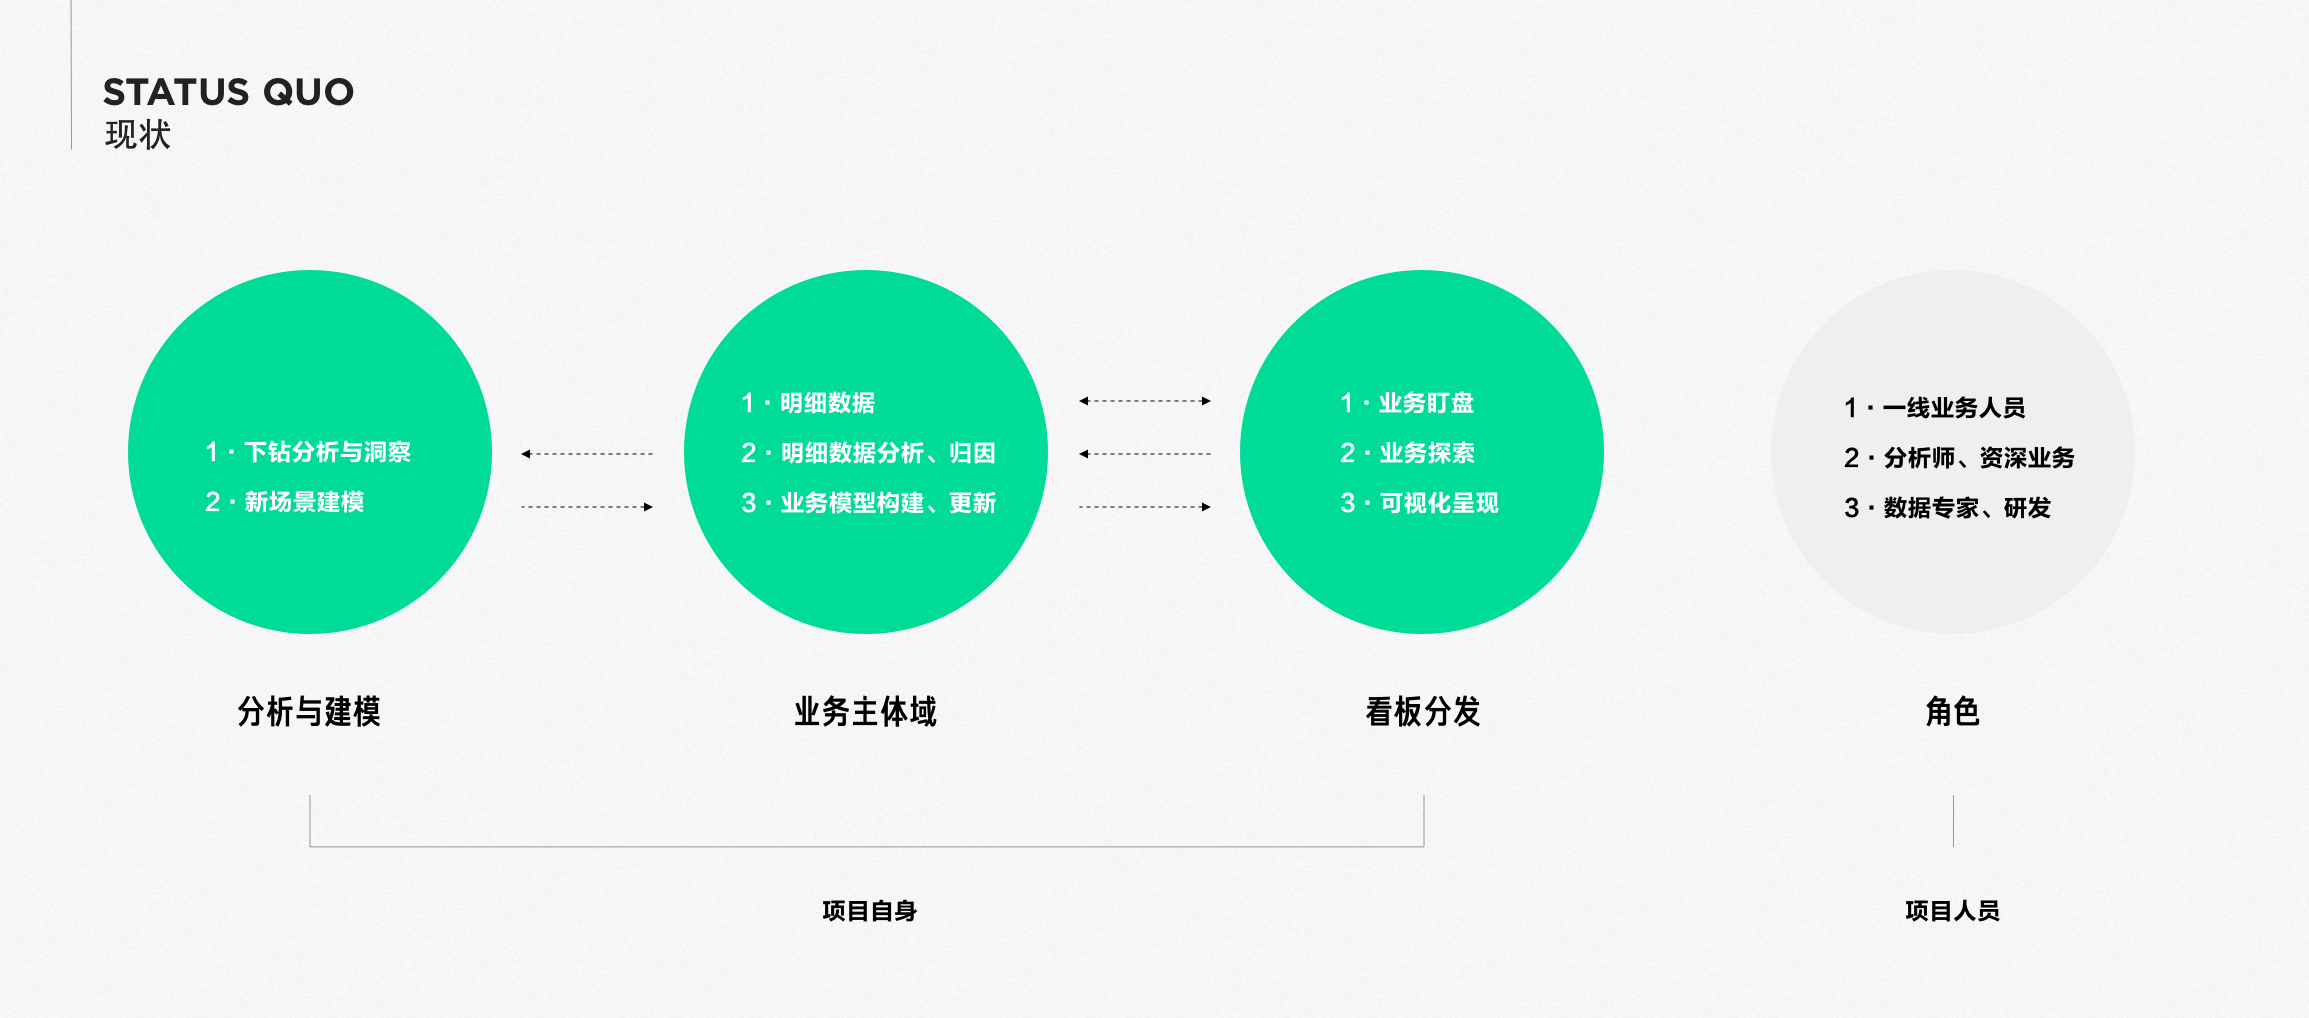
Through centralized resource management in the Dataset, different report usage can be achieved by isolating viewing scenarios from analysis scenarios, truly integrating rights and responsibilities.
Function Overview
Reports have several core functions, including "Model Management", "Schedule Monitoring", "Data Visualization", "Data Collaboration and Sharing", and "Enterprise-level Permissions and Controls".
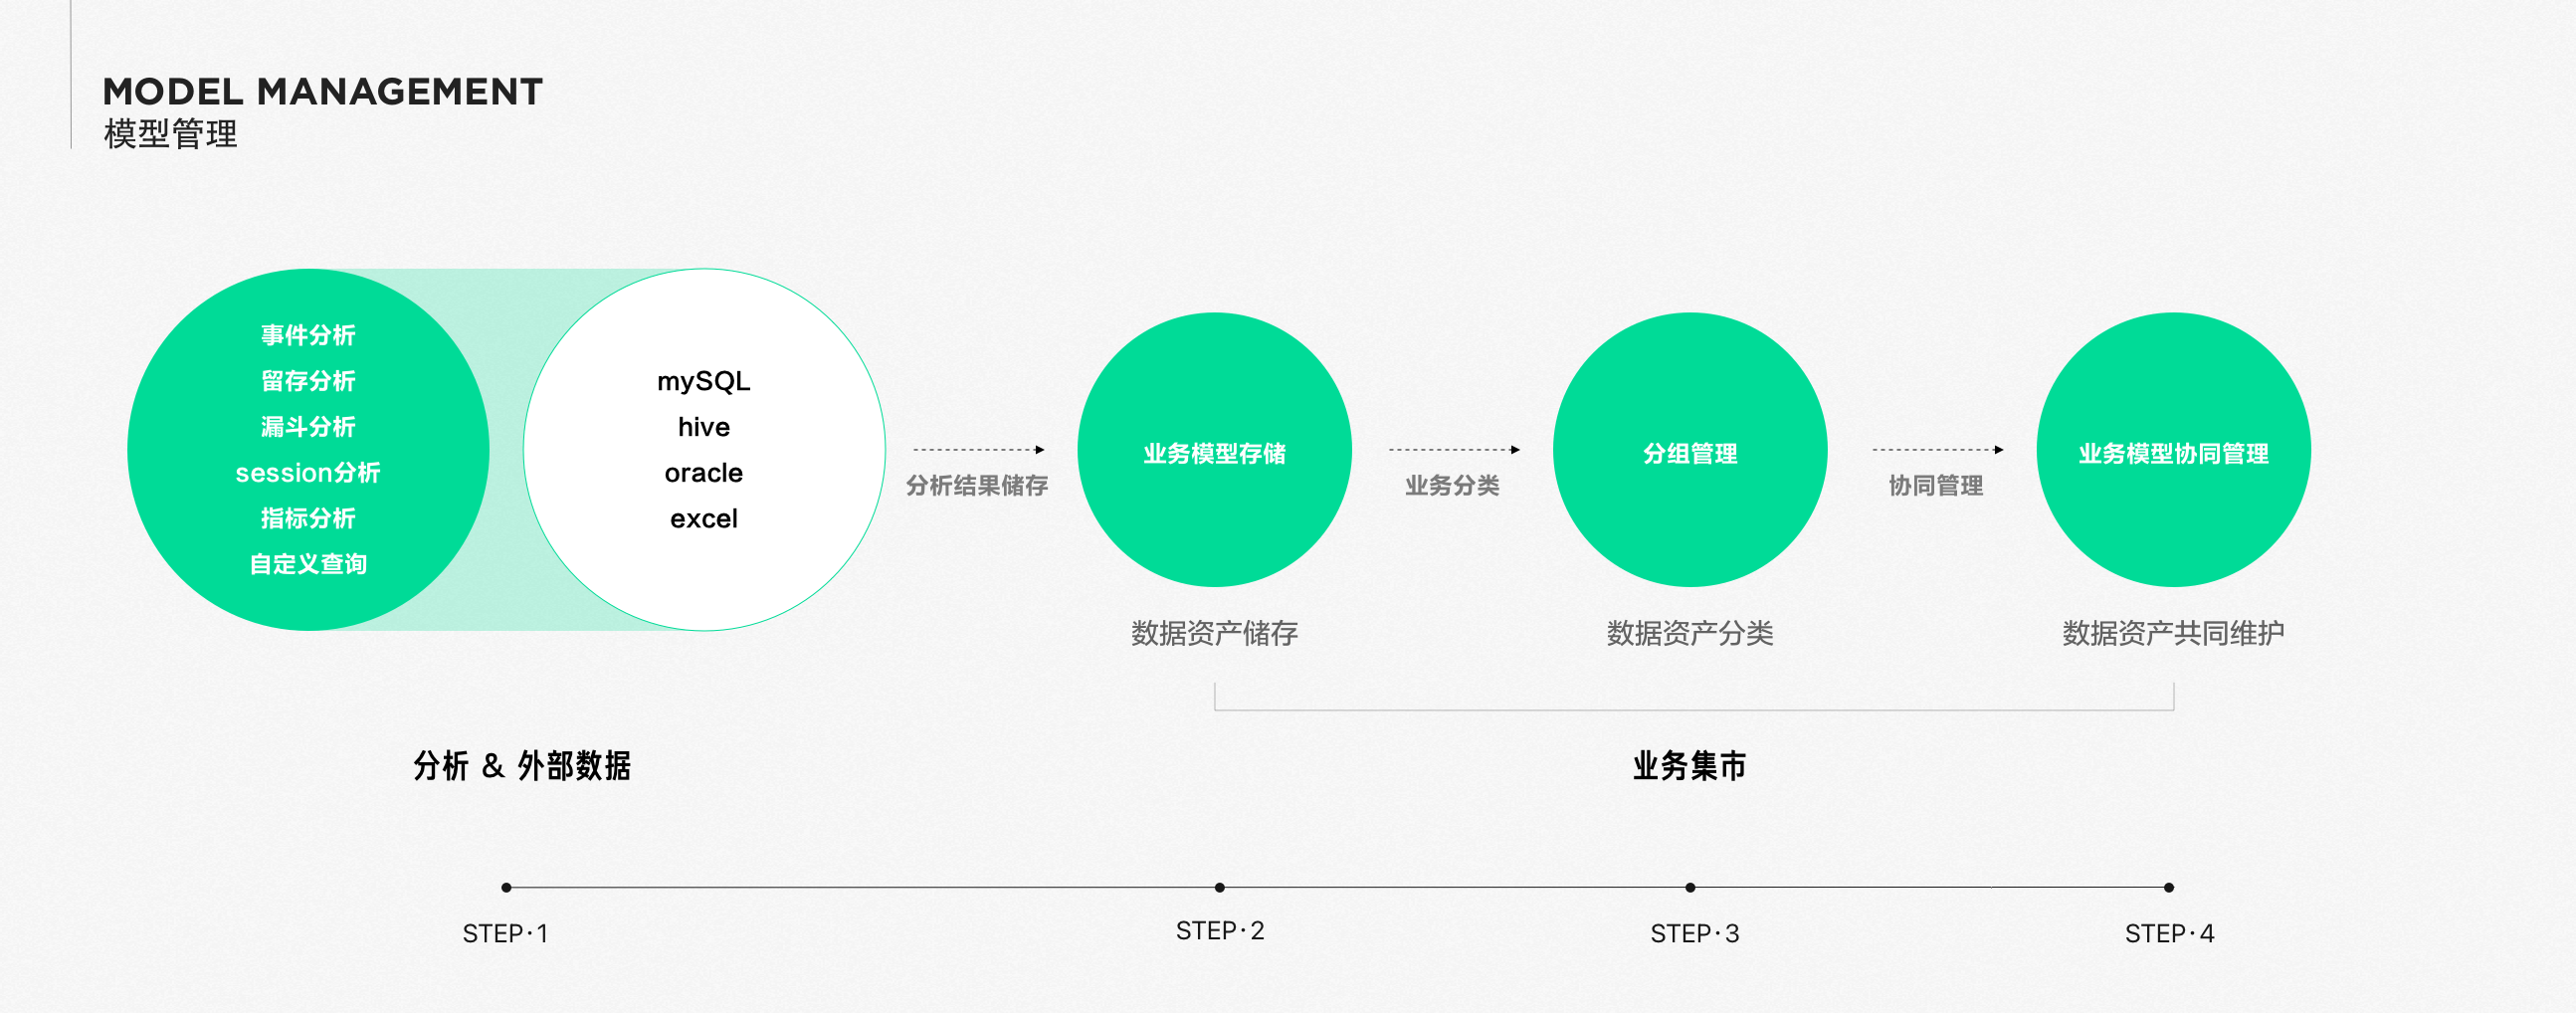
Model Management
Reports provide model storage capabilities under multiple data analysis pathways, providing semantic and visual storage capabilities based on different types of data sources, helping users load assets quickly to the greatest extent.
Schedule Monitoring
In the practice of enhancing digital operation capabilities and implementing data-driven strategies, enterprises need to maximize the value of data for more roles and scenarios with limited budget and resources. Sensors provide strong support for enterprises from both product and technology dimensions.
Function | Use Cases |
|---|---|
| Resource Archiving | Business-enabled analytics creation enables compartmentalization of data assets |
| Lifecycle management of asset scheduling | Avoid wasting computing power due to expired assets |
| Query Monitoring | Provide high-sensitive response for large tasks to avoid blocking |
| Application Statistics | Clarify the reliance on key boards and regularly clean up ineffective scheduling |
| Source consumption | Provide a lever for resource allocation optimization |
| Priority queue | Ensure smooth operation of key tasks at the system level |
| Intelligent caching | Efficiency improvement of query engine, avoid redundant work |
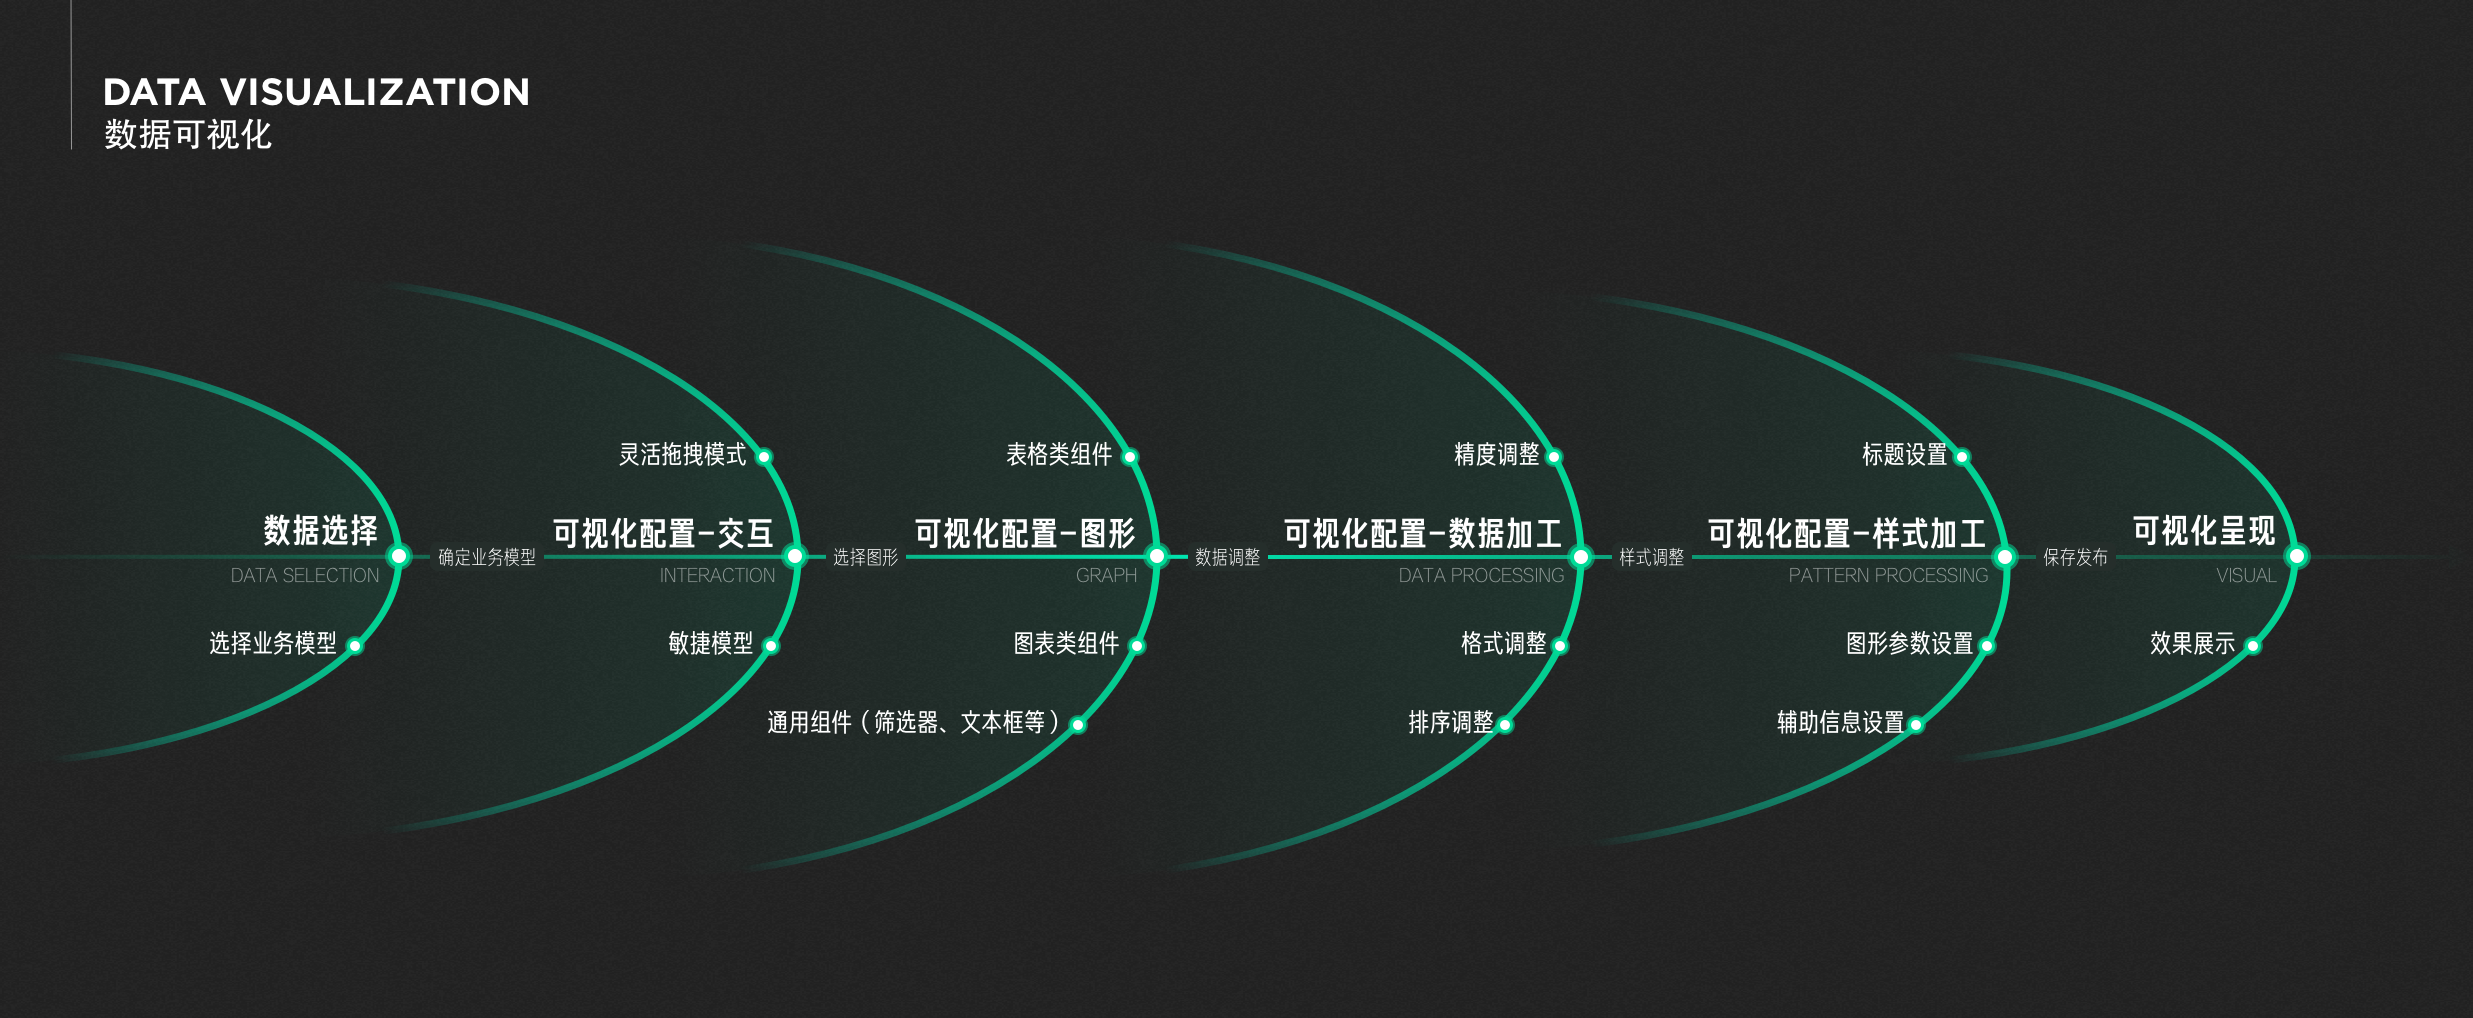
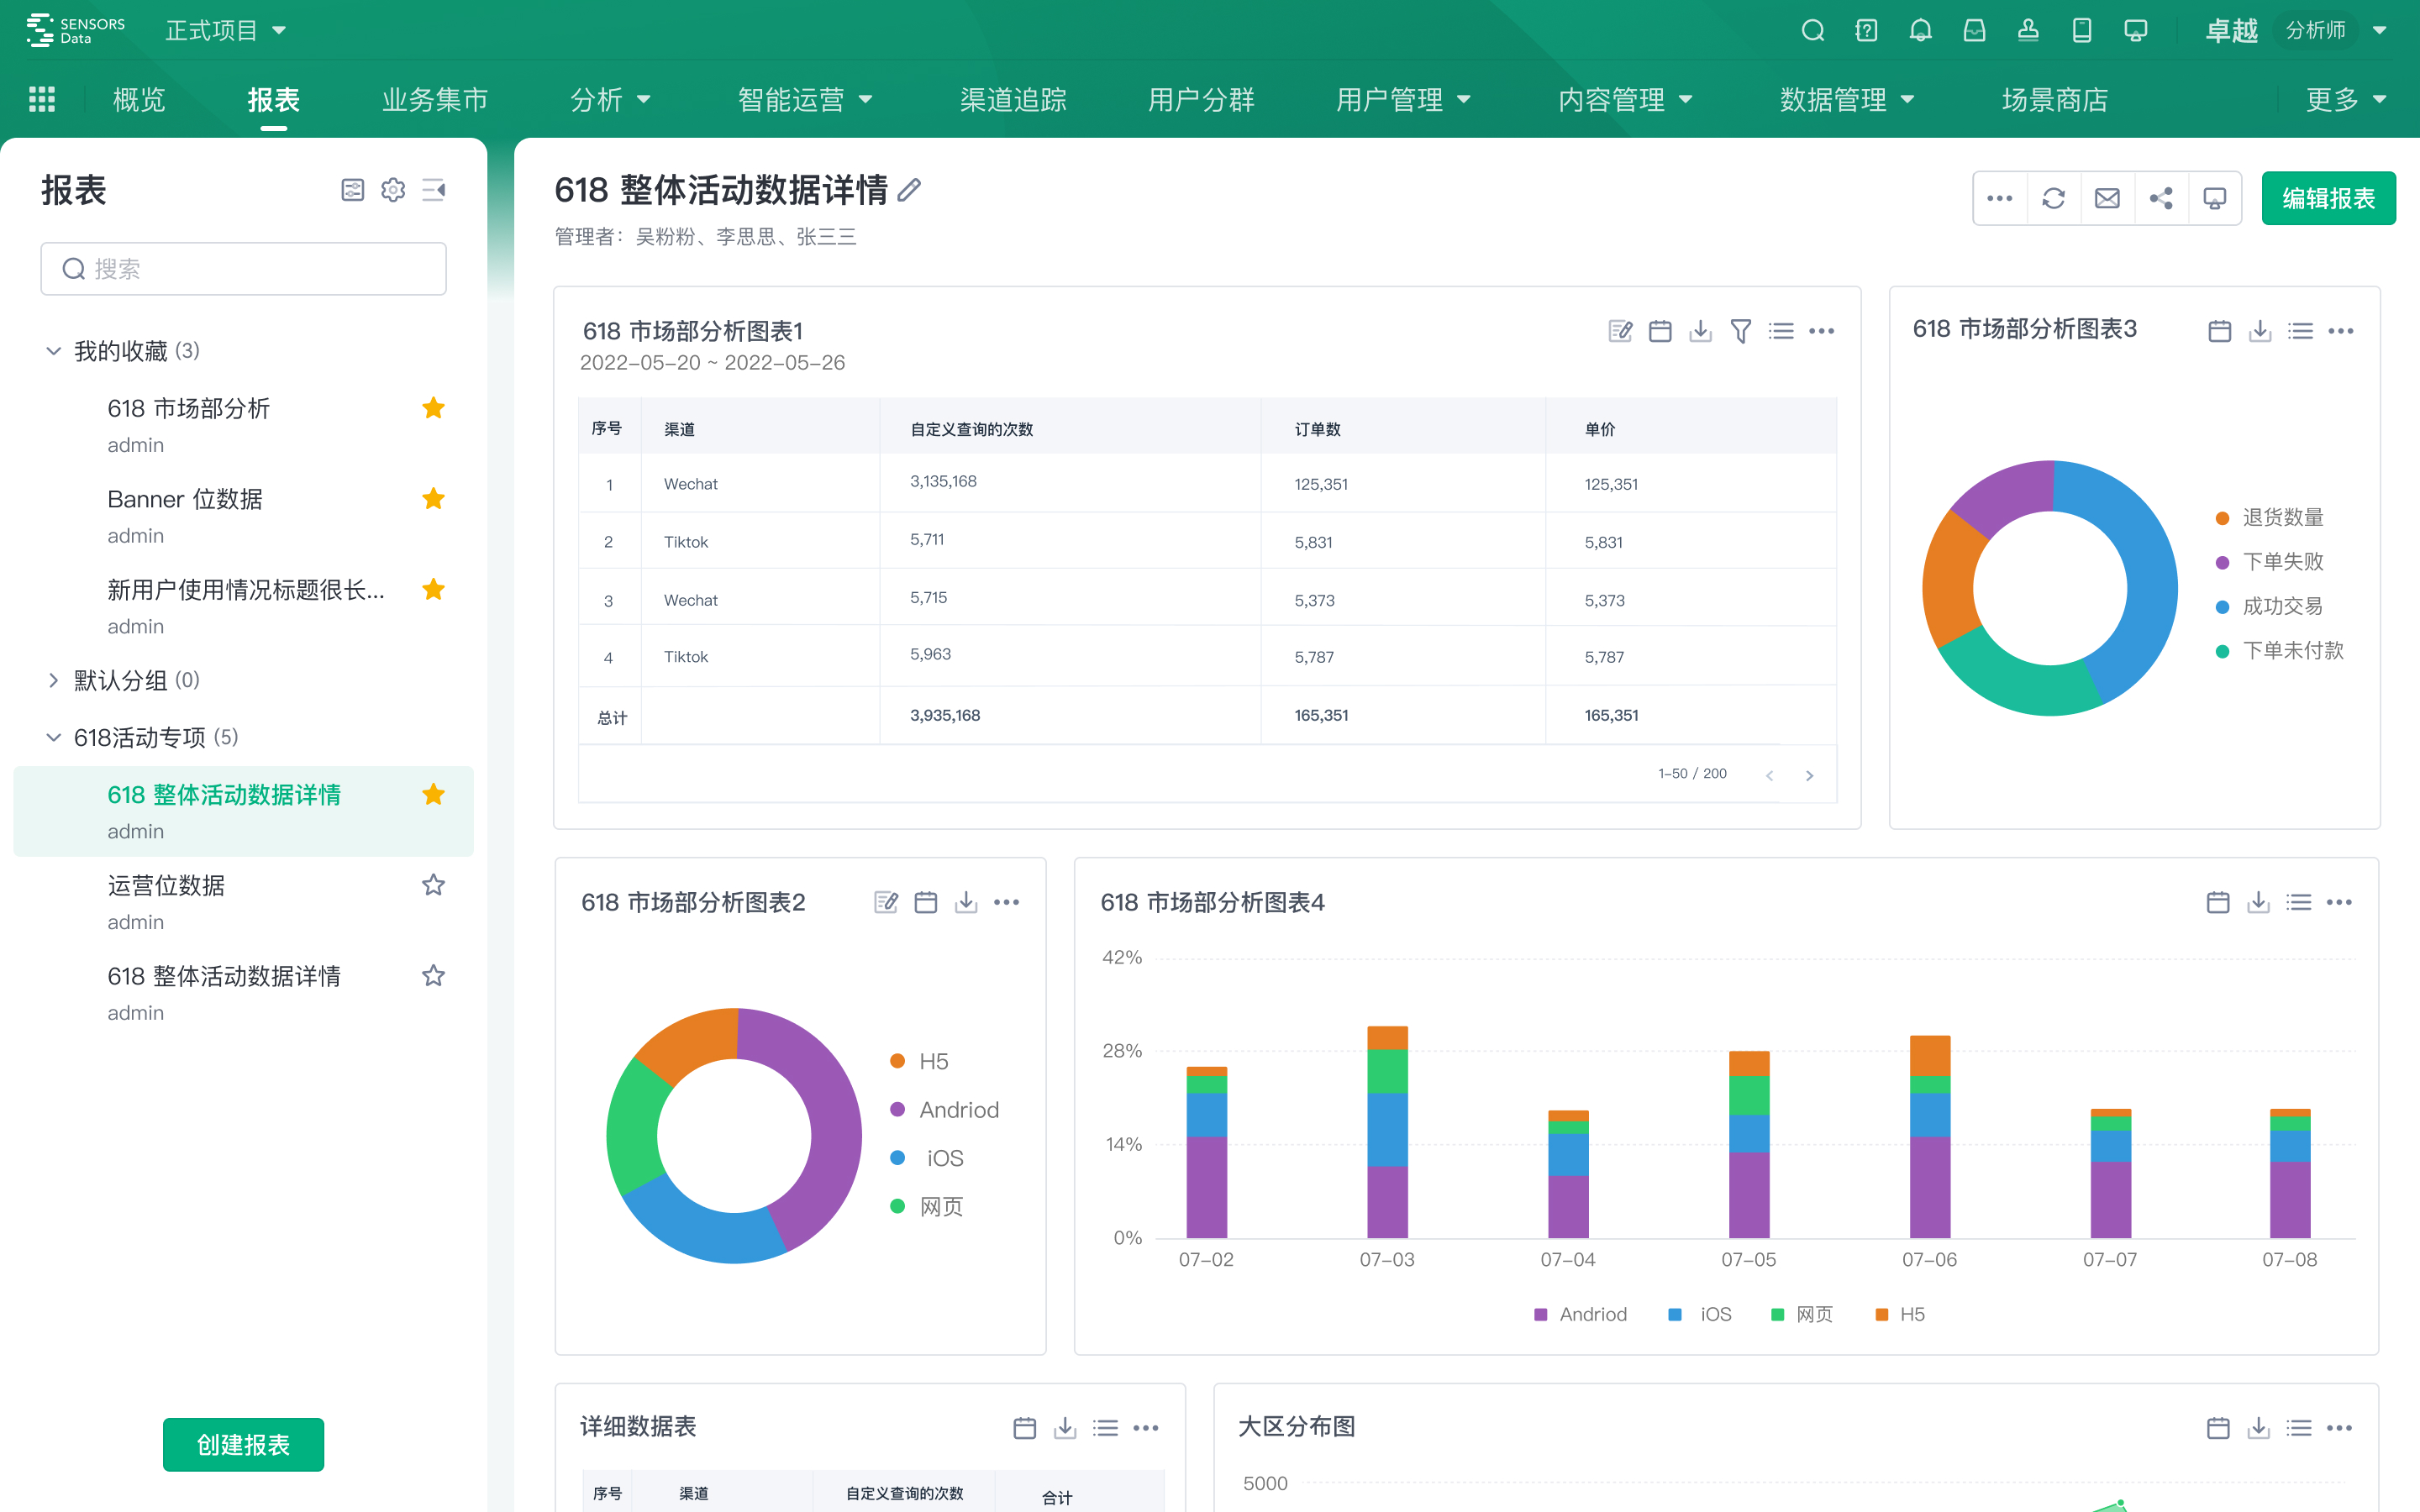
Data visualization
The so-called "A picture is worth a thousand words", efficient visualization application loop can help decision makers capture key data information and important details in a timely manner, while improving the team's ability to integrate information. As the presentation format of business data, the application of business data visualization can help enterprises with business insight, decision-making, business quantification, etc. Therefore, the value of data visualization is also increasingly valued by enterprises.
Data collaboration and sharing
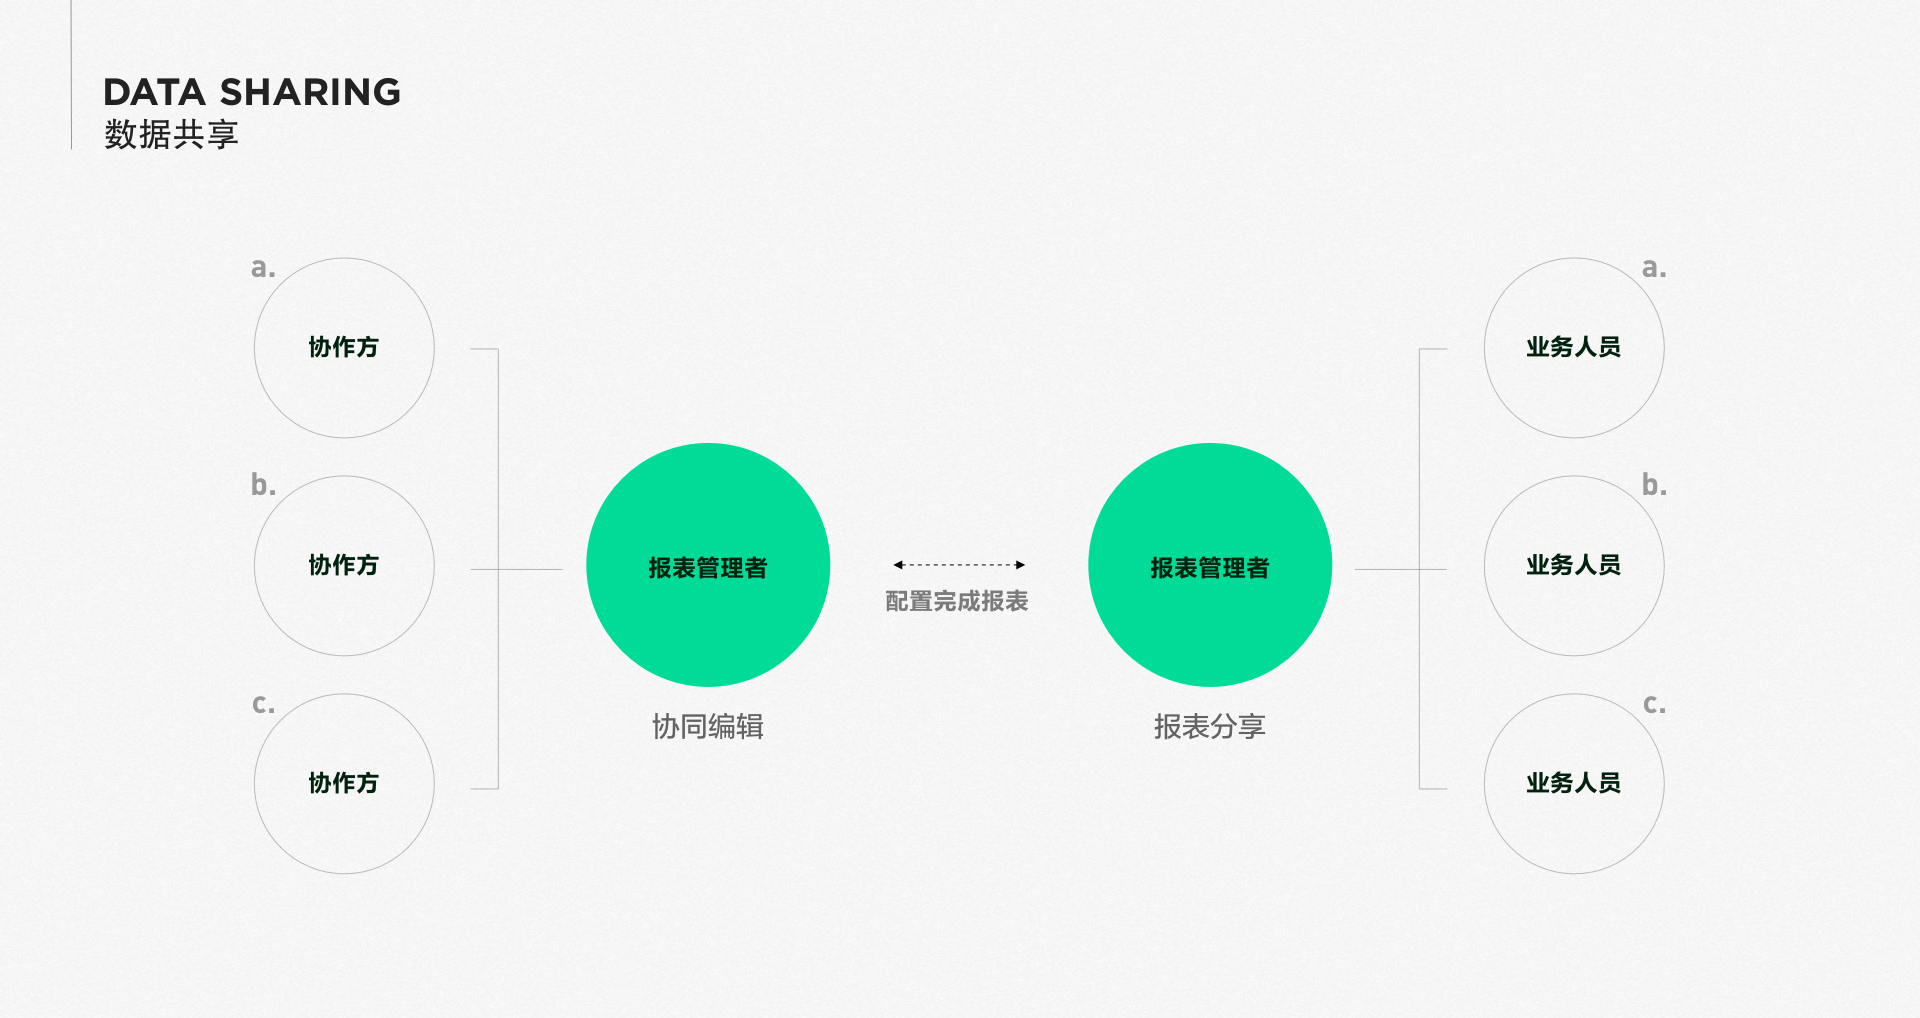
Collaboration among multiple people
Reports, as the main presentation of daily business data, respond to the data presentation requirements of various business departments. With the adjustment of business and changes in company operations, regular maintenance and updates are required.
In the process of report iteration and production, it is inevitable to work collaboratively to achieve the final presentation effect that meets the business scenarios. Sensors provide the ability to add multiple collaborators to the same report, allowing different personnel to jointly create reports.
Data sharing
- Reports, as tools for empowering internal enterprise data, analysts need to share and confirm with business personnel and management personnel after completing report configuration.
- Sensors Reports provide sharing capabilities, supporting various types of sharing according to roles, individuals, and positions, meeting the needs of data distribution and subscription.
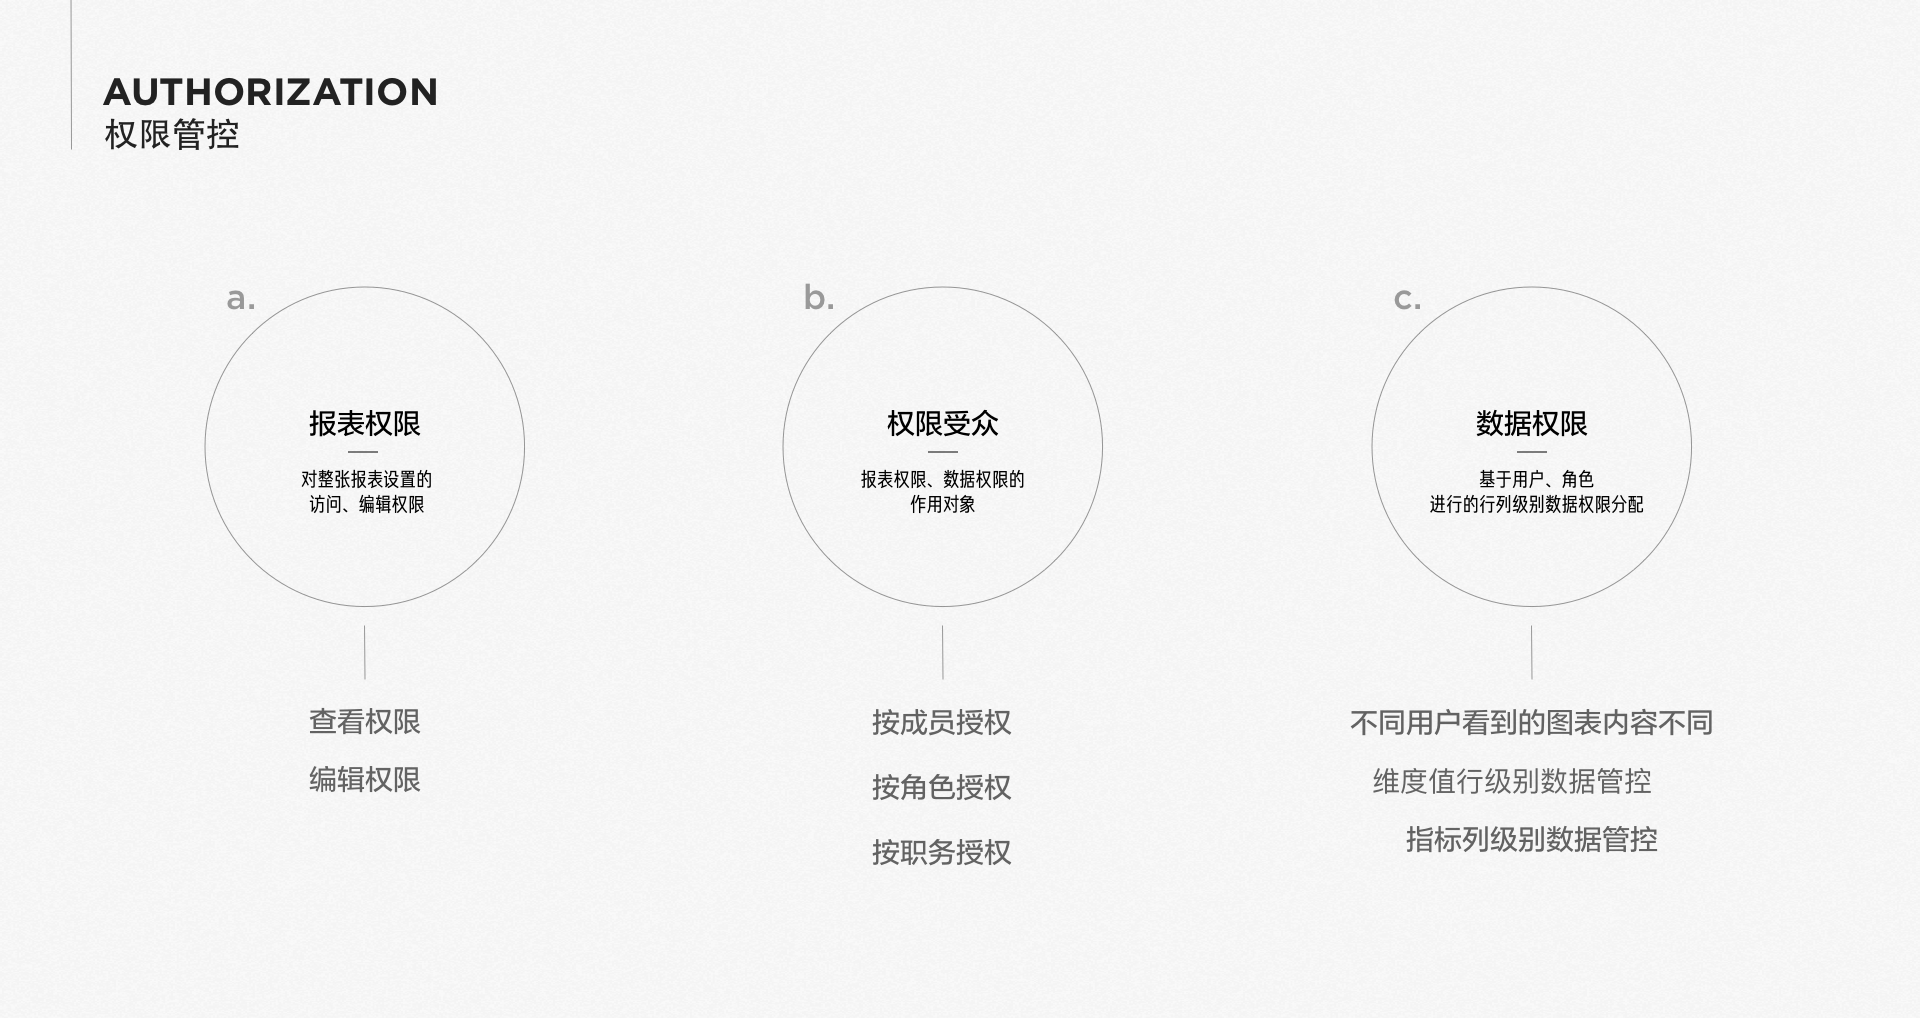
Enterprise-level Permission Control
Sensors Report permissions are divided into two layers: the viewing permissions of the reports themselves and the data permissions of each chart within the reports.
- Report administrators can distribute permissions in a fine-grained manner based on internal data security requirements of the enterprise. Sensors provide the ability to assign permissions according to roles, individuals, positions, and other objects.
- For the data permissions of each chart, Sensors supports row and column level authorization, while supporting the use of dynamic parameters in row-level permission control to associate configurations with account attributes, making it convenient and efficient.
Note: The content of this document is a technical document that provides details on how to use the Sensors product and does not include sales terms; the specific content of enterprise procurement products and technical services shall be subject to the commercial procurement contract.
 Popular Searches