In the 1.2 version of SensAnalysis, we introduced the sampling query function, which allows us to quickly obtain query results and verify hypotheses by extracting a small amount of data from a large amount of data.
1. Usage
Behavior event analysis, funnel analysis, retention analysis, and distribution analysis all provide sampling query functions, as shown in the figure below: 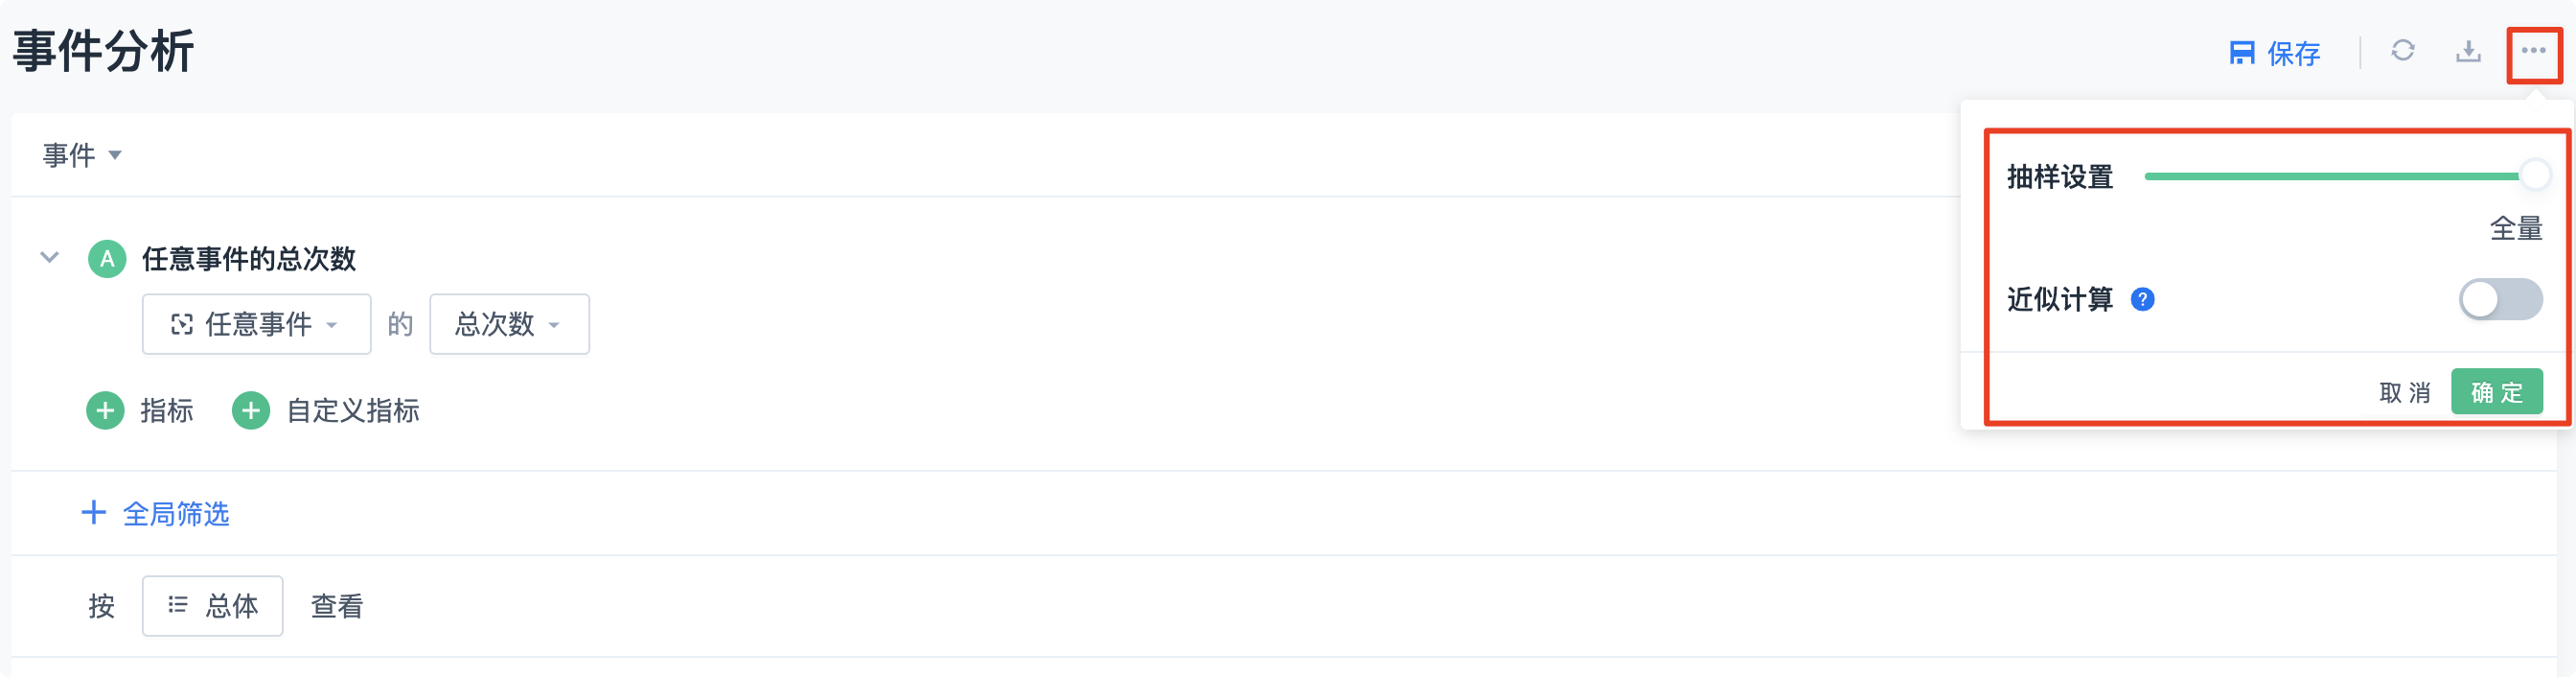
Currently, we provide sampling granularity of 1/64 from the full query to 1/64 of the full data, which can be dynamically adjusted in the actual query.
2. Sampling Principle
Sampling is performed based on the user_id within the SensAnalysis system. Without track_signup, it is the hash value of distinct_id. With track_signup, it is calculated based on the earlier distinct_id.
In the case of 1/8 sampling, it means selecting 1/8 of the users' data based on the user_id through modulus calculation, and deducing the value shown to the user based on this query result. For example, suppose a product currently has 1 million users, and the total query PV of an event on a certain day is 123,456. When performing 1/8 sampling, we take approximately 1/8 of the users' data from these 1 million users based on the user_id value, and find that the PV of this event among these users on this day is 13,500. Therefore, the final query result shown to the user is 13,500 * 8 = 108,000, which is slightly different from the true total query result.
When querying the following metrics, the query result will not be multiplied by the reciprocal of the sampling ratio (e.g., not multiplied by 8 for 1/8 sampling):
Average count per user (average number of times an event is triggered per user)
Average value per user (average value of a numerical attribute per user)
Maximum value (maximum value of a numerical attribute)
Minimum value (minimum value of a numerical attribute)
Average number of sessions per user
3. Use Cases
As described earlier, there will be discrepancies between the results obtained from sampling queries and the true total query results. The larger the user base and the more evenly distributed the data, the smaller the discrepancy. Of course, if we are only concerned about data trends, then sampling on a small number of user groups will usually have less impact.
Therefore, sampling queries are mainly used when dealing with large amounts of data and slow query speeds. By selecting data from a small number of users through sampling queries, we can quickly verify hypotheses and observe trends. When determining the specific metrics to focus on and assess, full queries can be used to obtain accurate values.
 Popular Searches