Sensor Analytics on Mobile
|
Collect
Sensor Analytics on Mobile is the mobile version of Sensor Analytics, developed by Sensor Data. It mainly provides data metrics display and data anomaly reporting functions.
1. Login
1.1. Application download and installation
Android users can search "Sensor Analytics" in the app store of the mobile phone and download and install it;
iOS users can search "Sensor Analytics" in the App Store and download and install it.
1.2. Registration and login
- Login with username and password
In the Sensor Analytics app, use your username and password to login.
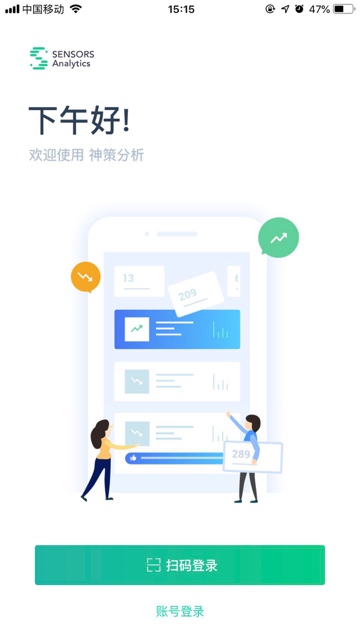
- Login with QR code scanning
Login in the Sensor Analytics platform on your computer, click the "Sensor Analytics on Mobile" button in the top navigation area, and use the Sensor Analytics app to scan the QR code to login.
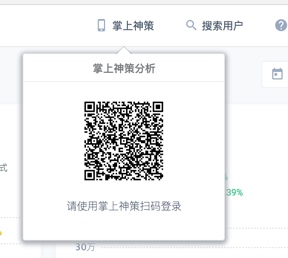
After successful login, you can enter the Mobile App to browse data and view analysis reports.
Login exception
Please try the following solutions before attempting again:
- Scan the QR code with your mobile's built-in browser or WeChat to see if the H5 page can be loaded, and determine if your mobile phone and Sensor Analytics platform network are communicating with each other.
- Click the "Sensor Analytics on Mobile" button again to generate a new QR code, and use the Mobile App to scan the QR code to login.
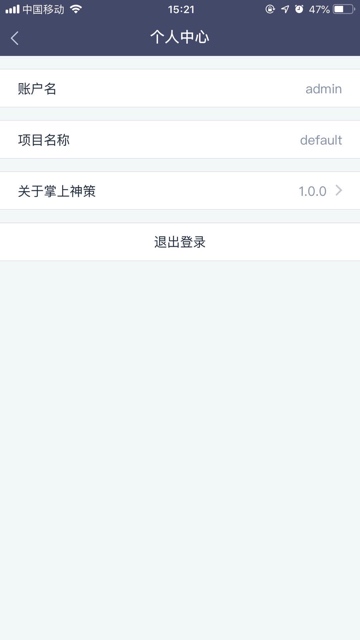
1.3. Logout
In the personal center, click "Logout" to exit your account.
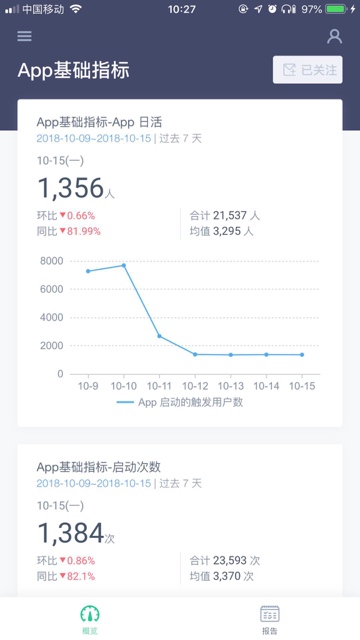
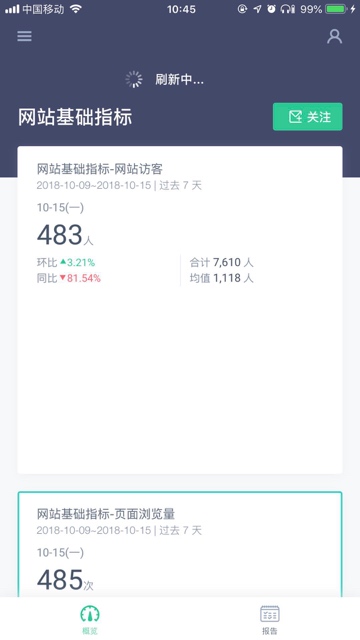
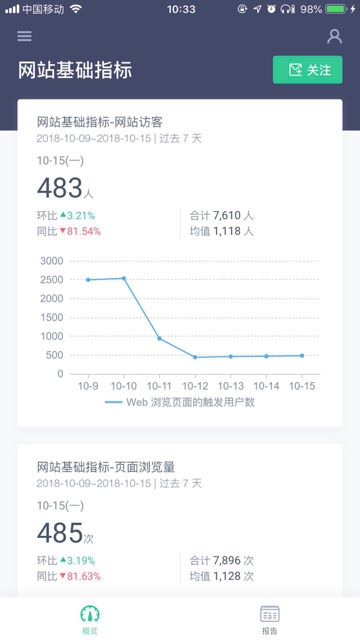
2. Overview
2.1. Browse the overview
The data in the overview is synchronized with the web account. If you need to modify the data metrics to view, please make the configuration modifications on the web platform;
Modifying the time range is not supported temporarily.
Switching overview
Click on the "More" button on the upper left corner to switch the overview.
Refresh the overview
Pull down the entire overview page to refresh the overview.
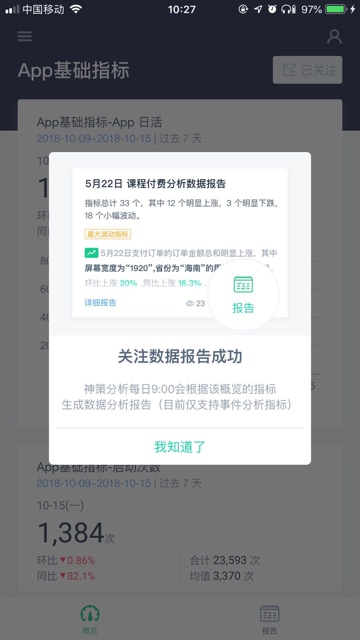
2.2. Follow the overview
- Overview subscription
Click the "Follow" button to subscribe to the overview. After subscribing successfully, analysis reports will be generated the next day and pushed to your mobile phone.
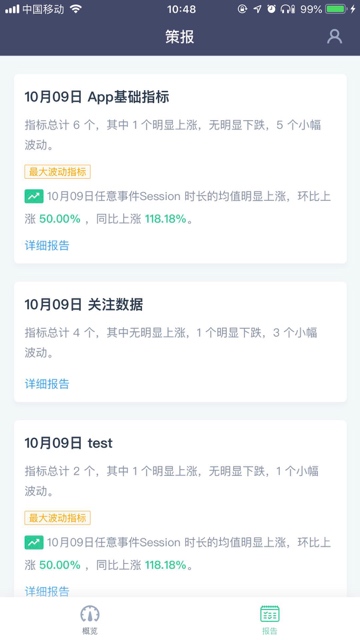
3. Strategy report
The content of the strategy report mainly uses natural language to interpret the data metrics configured by you, and currently supports event analysis indicators.
Metric calculation
If the configured metric is viewed by total, the same-period ratio and year-on-year growth rate of the metric will be calculated, and metrics with larger change rates will be displayed at the top;
If the configured metric is grouped by a dimension, the change amplitude of each property's value under the dimension will be calculated, and the group with the largest change amplitude will be displayed.
3.1. Strategy report list
The system will push strategy reports daily at 9:00, and the content of the push will be the overview you follow.
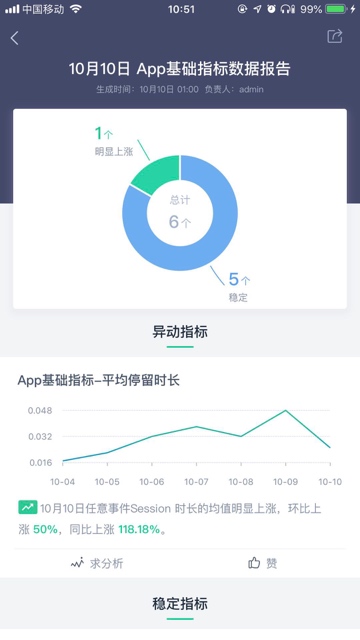
3.2. Strategy report details
A report will be generated for each subscribed overview.
Currently, the report only supports the interpretation of event analysis indicators. The system will calculate data fluctuations according to the configured indicators and give the results.
The basic calculation rule is:
- When there is no grouping for the configured metric, calculate the overall MoM and YoY fluctuation values of the metric.
- When there is grouping for the configured metric, calculate the MoM and YoY fluctuation values for each group of the metric, and determine the group with the most significant fluctuation based on its proportion.
Strategy Report ranks the metrics based on the overall fluctuation magnitude. When the fluctuation value exceeds 10%, it is considered a significant fluctuation; when the fluctuation value is between 5% and 10%, it is considered a mild fluctuation; and when the fluctuation value is less than 5%, it is considered stable.
- Details: Metrics with grouping can display detailed information for each group.
Request Analysis: Clicking the Request Analysis button will allow users to comment on the interpretation content of the data. Comments will be displayed in the comment section at the bottom, making it easy for the configurator to address issues in the report.
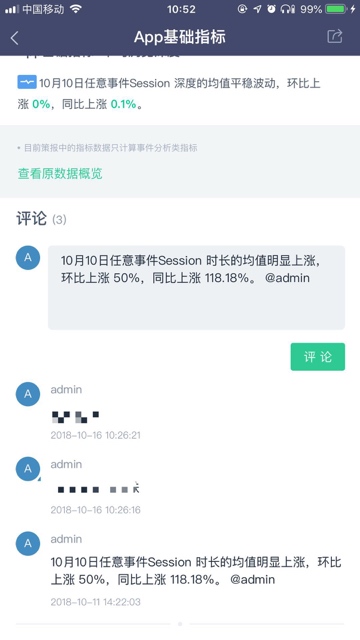
Like: Clicking the Like button will show appreciation for the metric.
Comment: The report has a comment button at the bottom, where users can leave comments.
Note: The content of this document is a technical document that provides details on how to use the Sensors product and does not include sales terms; the specific content of enterprise procurement products and technical services shall be subject to the commercial procurement contract.
 Popular Searches