User Analysis
|
Collect
Overview
Statistical analysis based on user attributes, such as viewing the trend of user numbers based on registration time, and viewing the distribution of users by province.
Note: This feature analyzes users in the user table (users). If event data is only tracked in the SDK and no profile information is set for the user, the user will not appear in the "User Attribute Analysis" feature. Therefore, the number of triggered users for "Any Event" in the "Behavioral Event Analysis" module may differ from the data here.
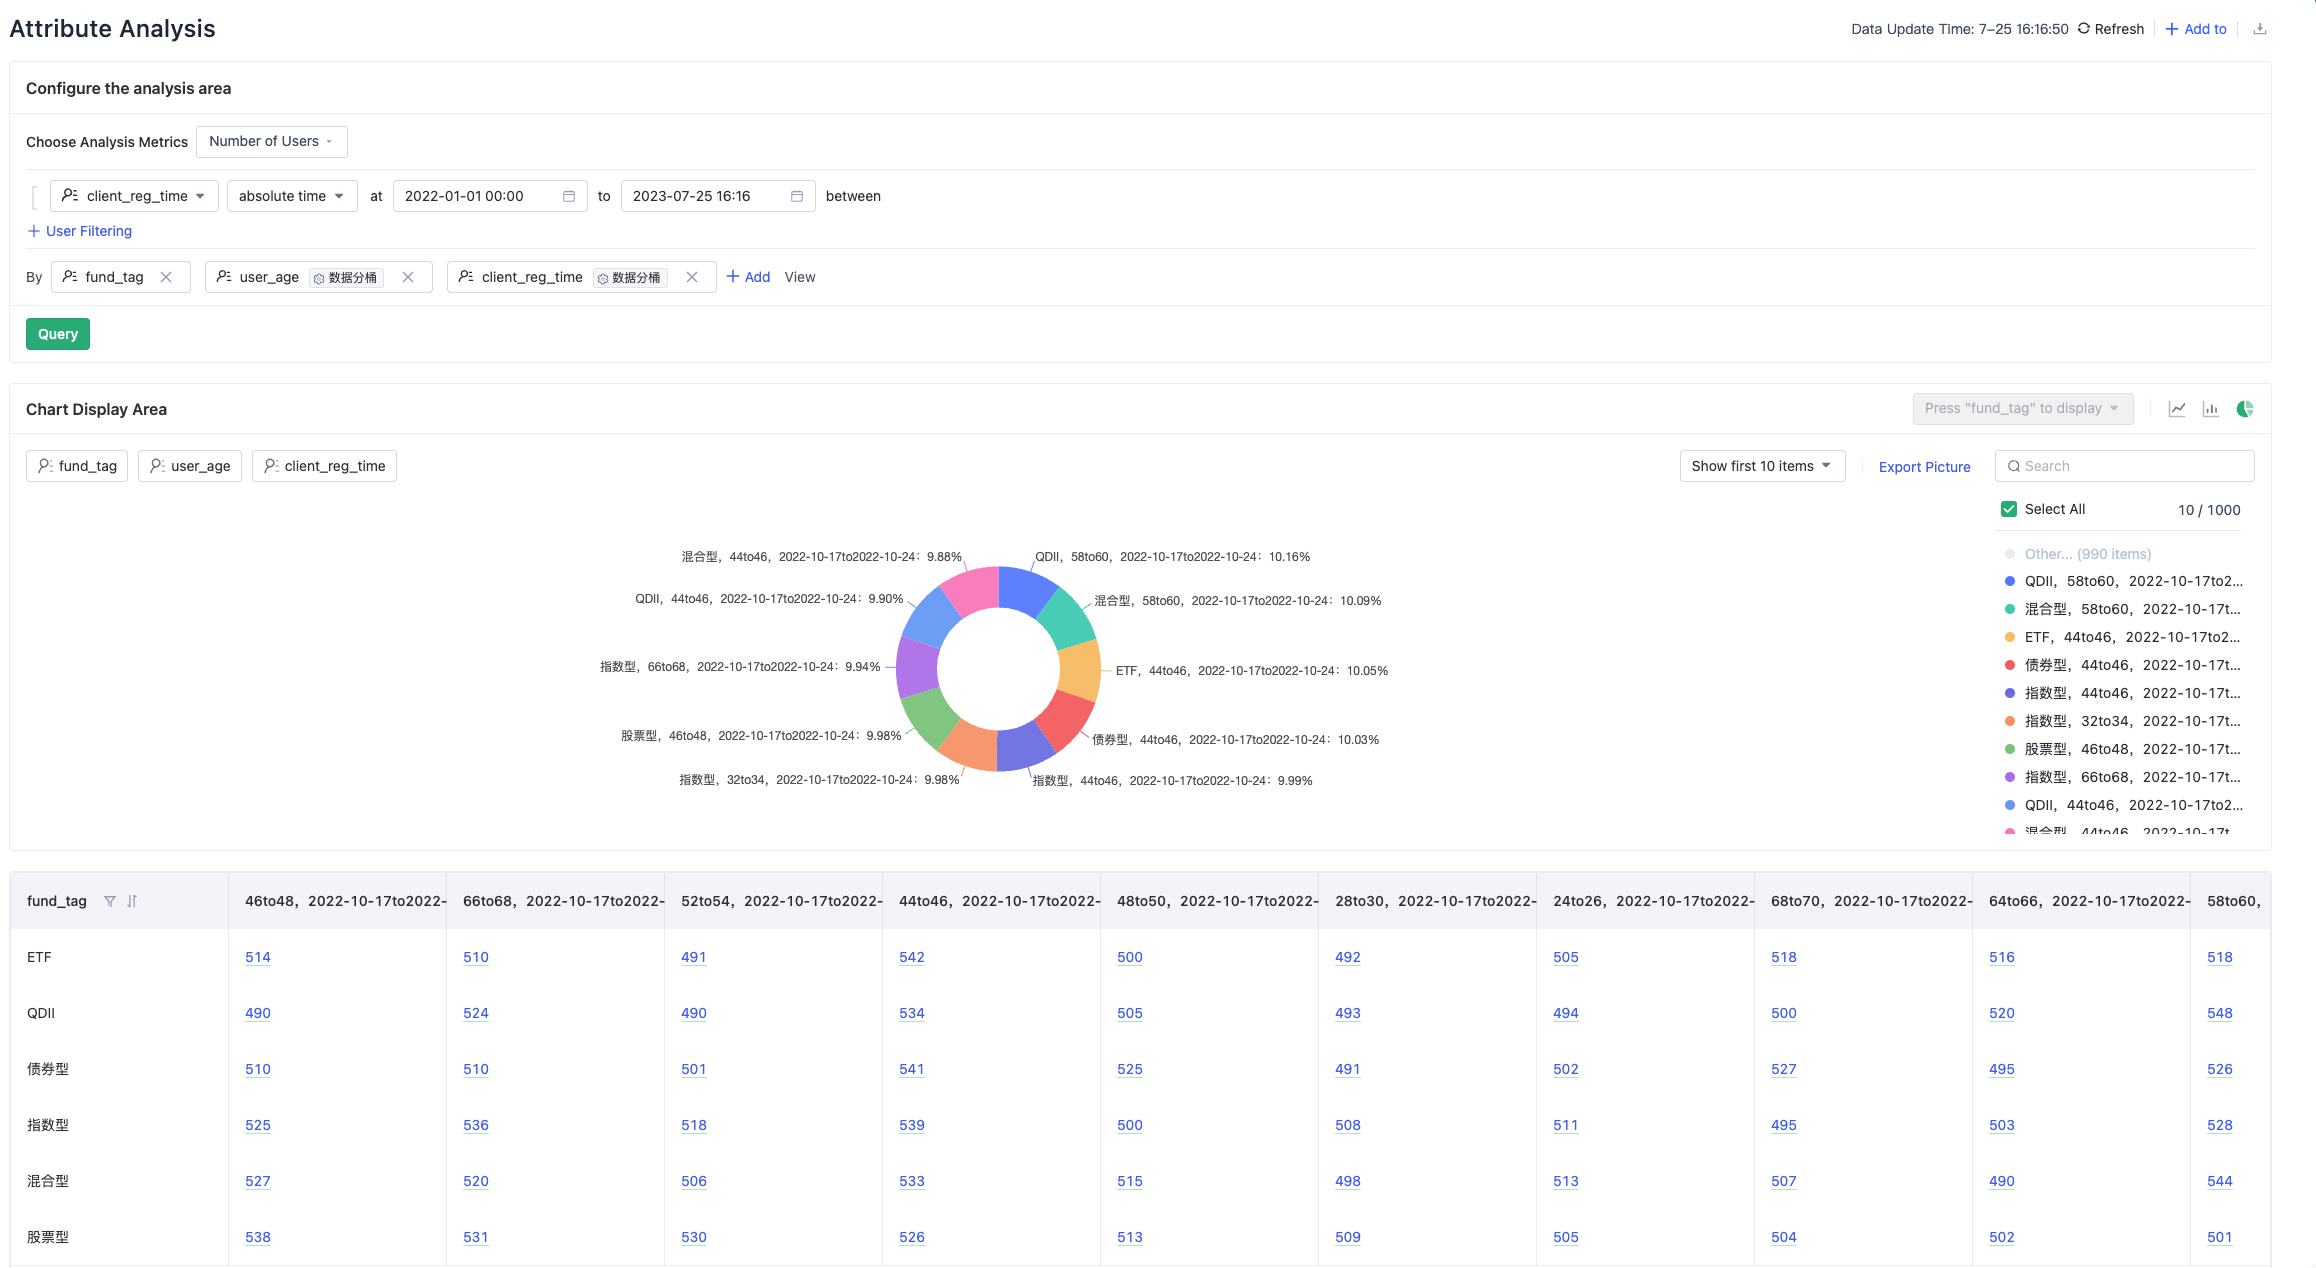
Introduction to User Property Analysis Function
Select Indicators
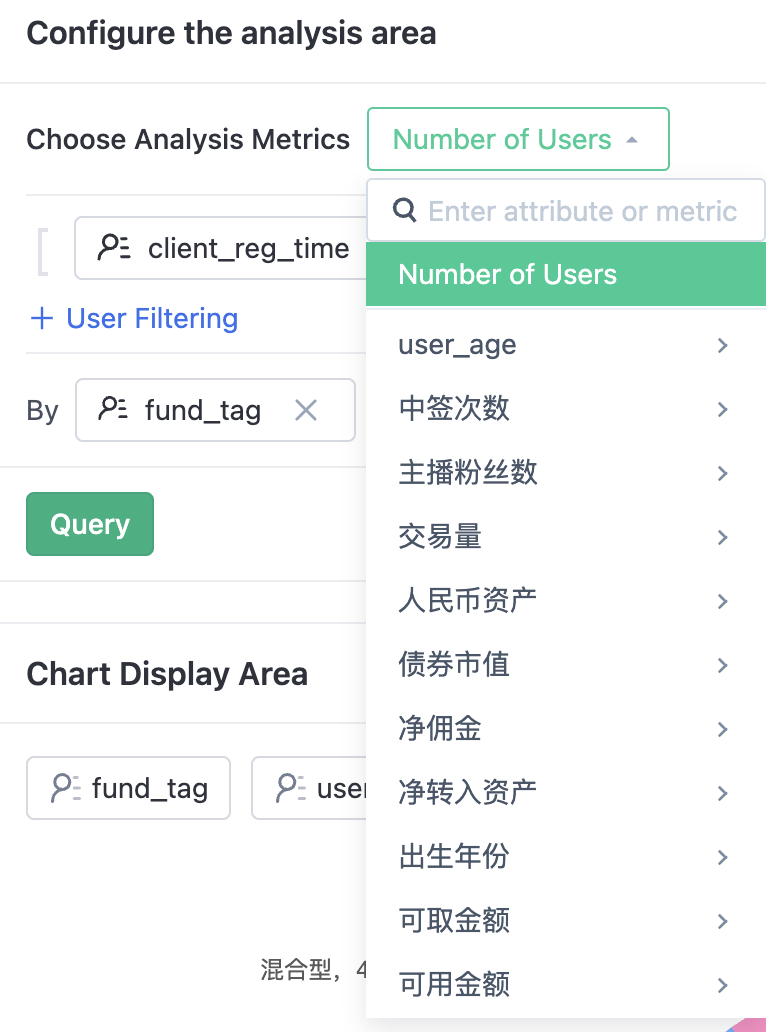
"Unique Count" can be selected as the analysis indicator for all types of attributes, and "Sum", "Average", "Maximum", "Minimum" can be selected as the analysis indicators for numerical attributes.
- User Count: Total number of users.
- Deduplication: The number of unique appearances of the attribute among all users.
- Sum: The sum of attribute values among all users.
- Average: The arithmetic mean of the attribute values among all users.
- Maximum: The maximum attribute value among all users.
- Minimum: The minimum attribute value among all users.
View by Grouping (Dimension)
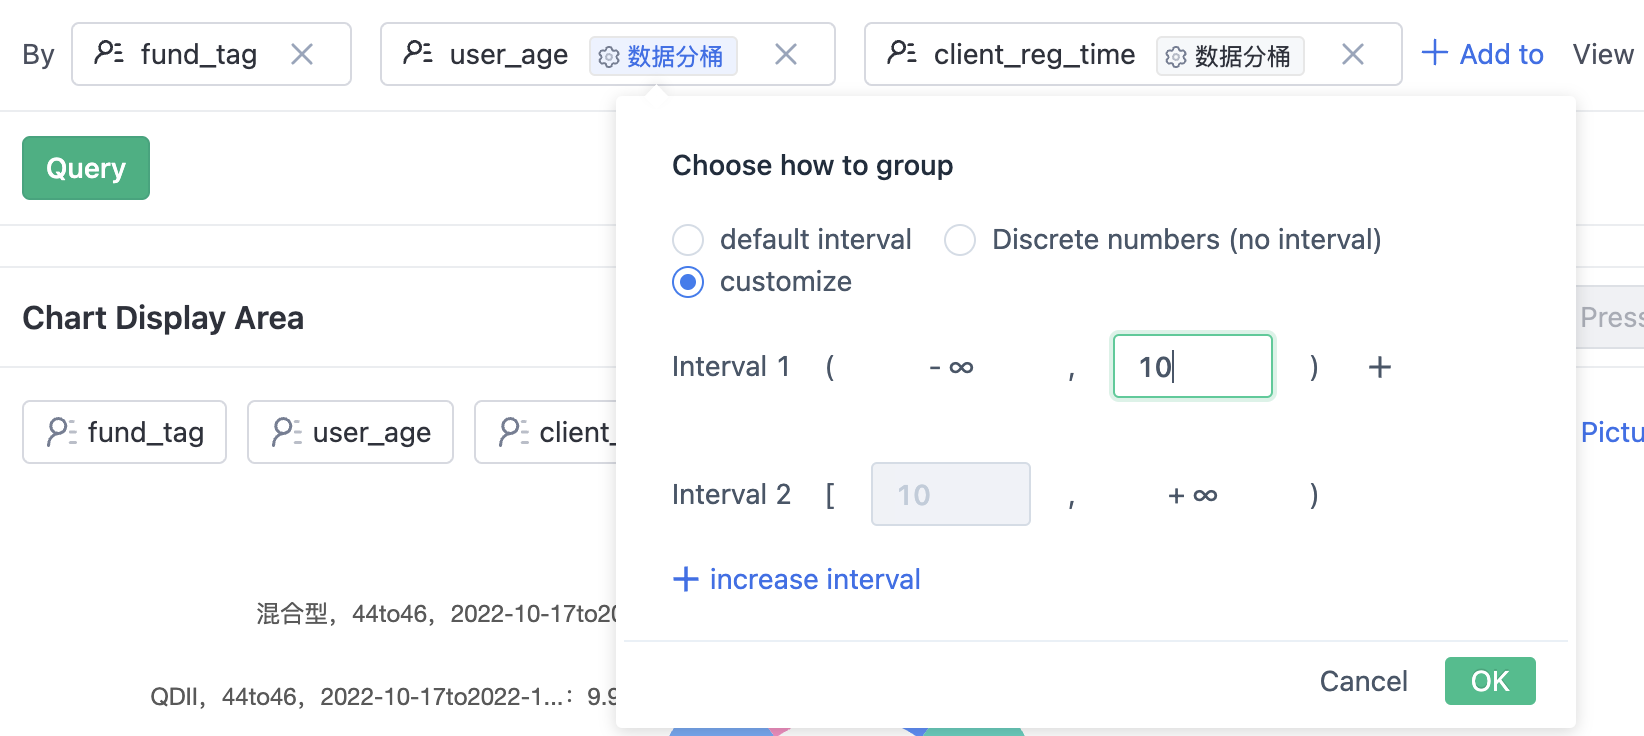
Viewing data by dimension, allows for more refined analysis. Multiple dimensions can be added, and only indicators are displayed without dimensions.
- Numeric dimensions can have custom ranges as shown in the above picture.
- Date dimensions can be aggregated by time period or not aggregated.
Add Filter Conditions
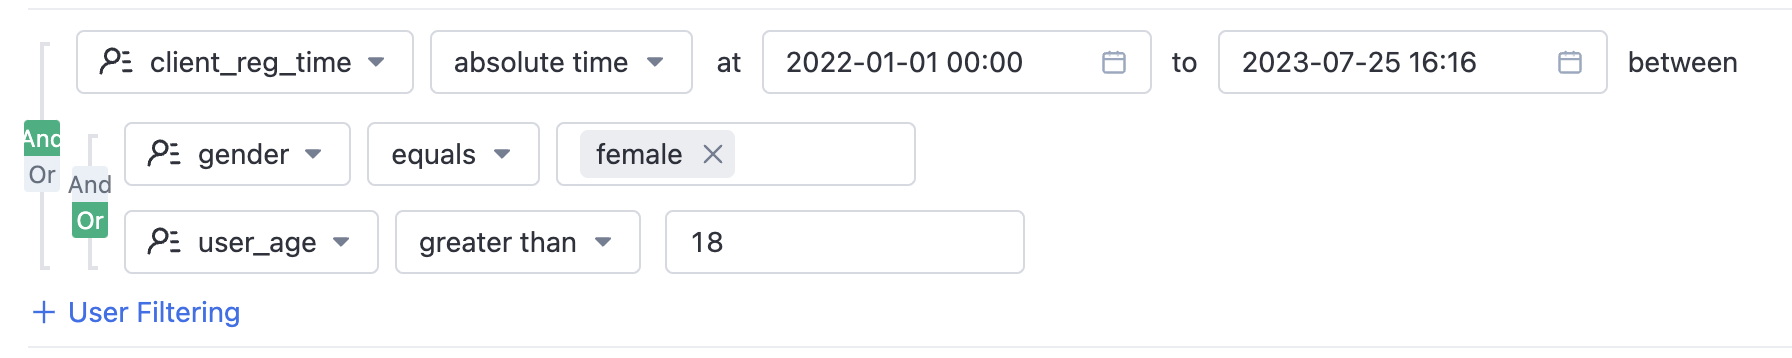
Filtering can be used to view users that meet specific conditions. Click "+ User Filter" in the above picture to select a user attribute that needs to be filtered. Different filtering logic operations are provided based on the data type of different attributes (text, numeric, datetime, boolean, collection, etc.). Note: Version 2.4.1 supports nesting of AND/OR filtering conditions.
Display Settings
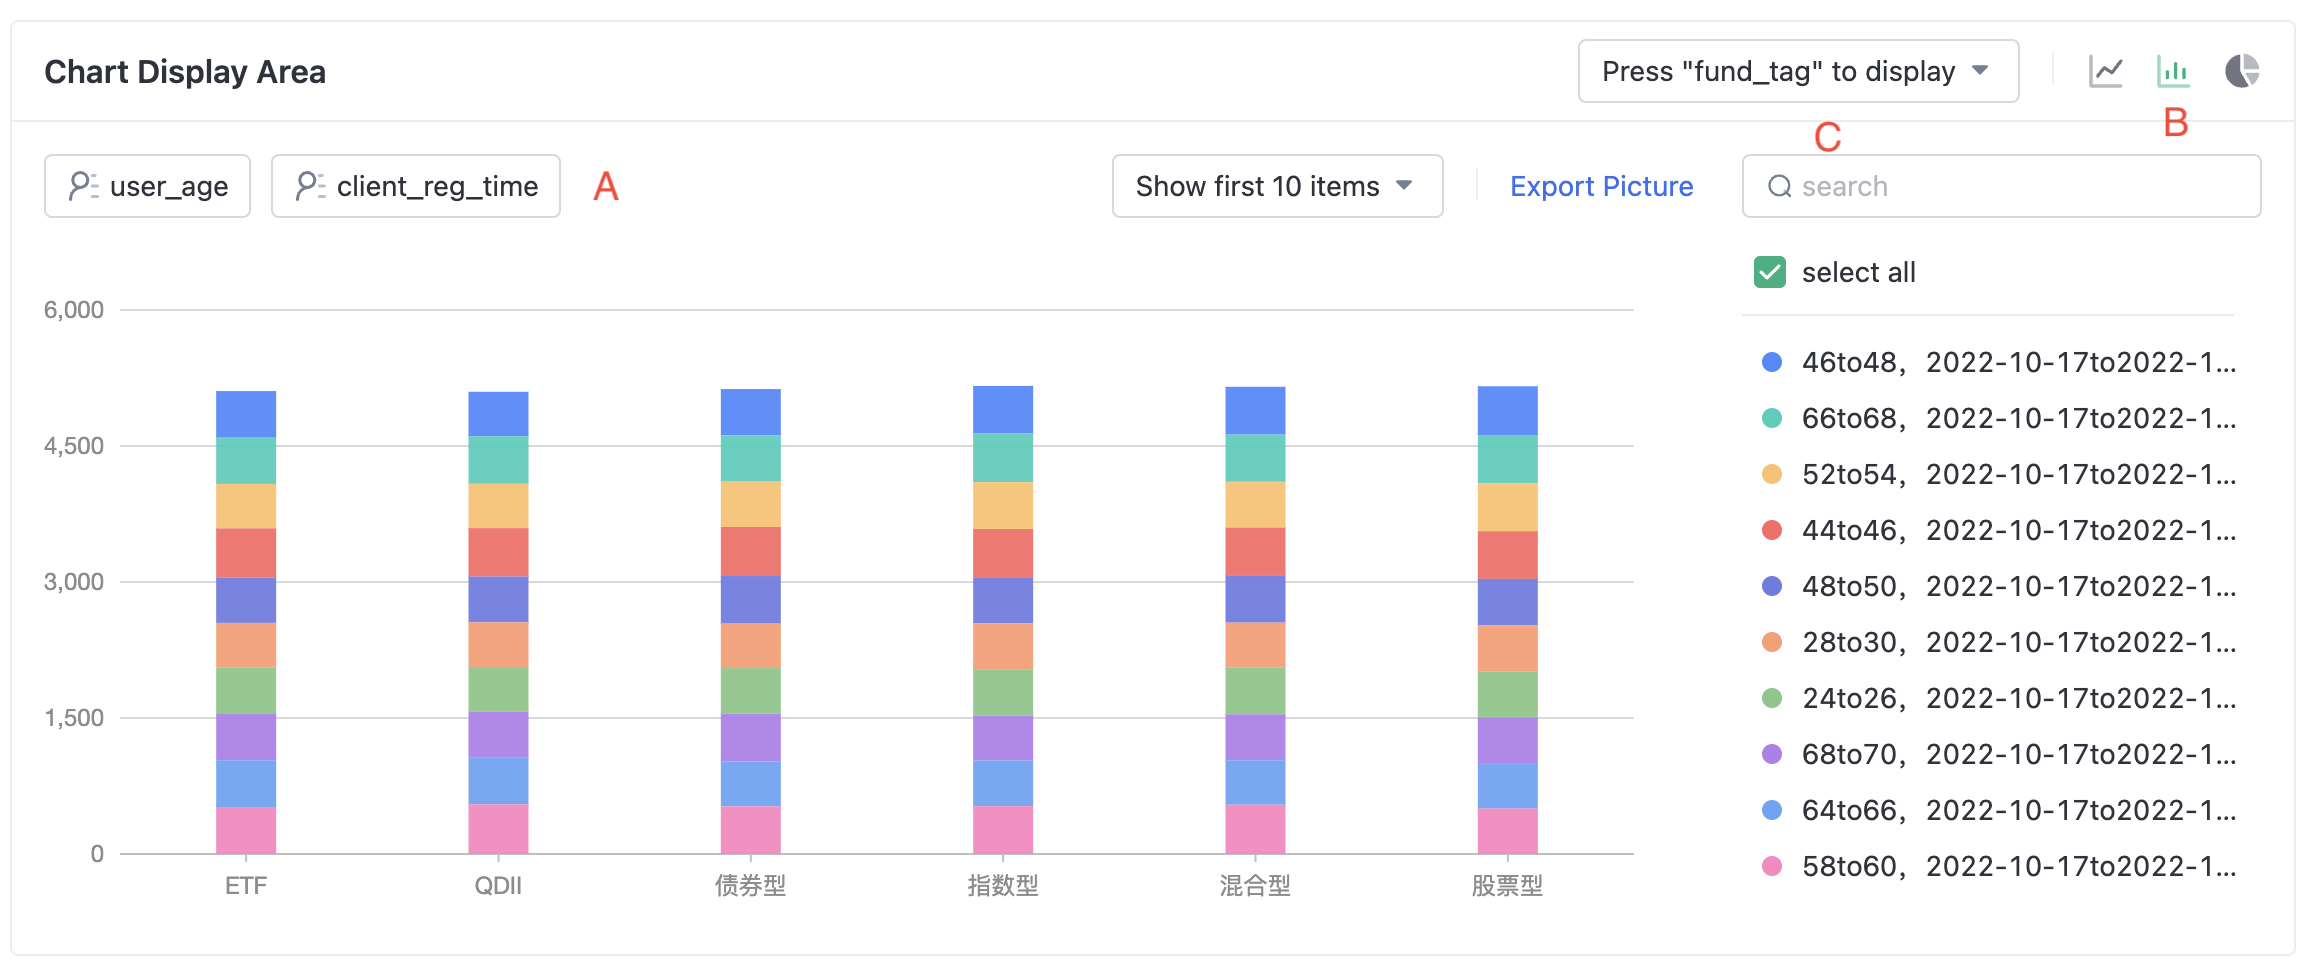
- A Selection of Grouping Values: When there are many grouping values, choose the grouping values that need to be displayed in the chart. By default, the top 10 grouping values are displayed.
- B Choose Chart Type: Line chart, Bar chart, and Pie chart can be selected.
- C Choose x Coordinate: If there are more than one grouping and displayed in line chart or bar chart, select one dimension as X-axis.
Table Display
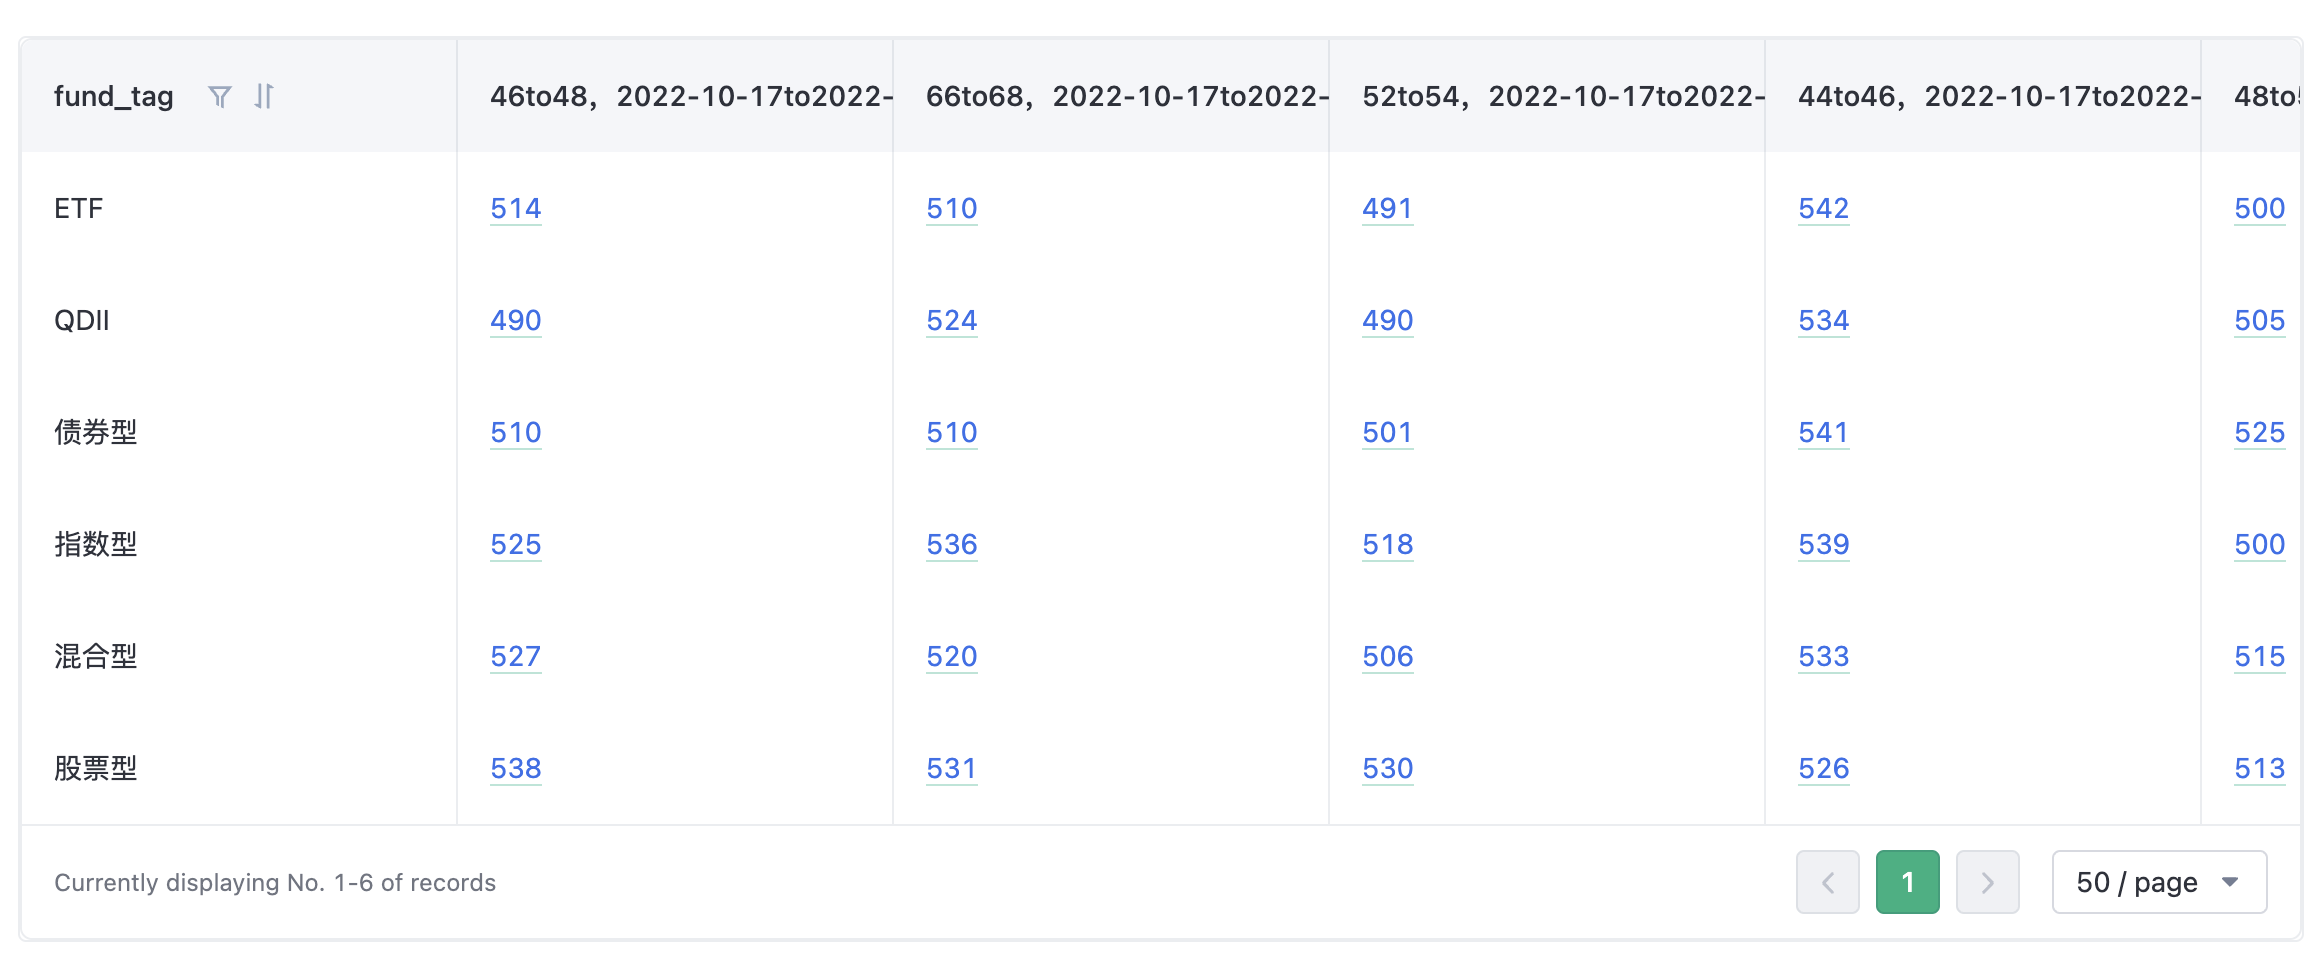
The first column contains X-axis data and the first row contains grouping (dimension) values. Click on the numbers in the table to view a detailed list of users.
FAQ
Is it possible to filter users according to the time they access the system?
A: By default, there is no time attribute in user attributes. If you need to view them by access time, you need to record the time attribute when buried point and then analyze based on it.
Note: The content of this document is a technical document that provides details on how to use the Sensors product and does not include sales terms; the specific content of enterprise procurement products and technical services shall be subject to the commercial procurement contract.
 Popular Searches