User Behavior Sequence
|
Collect
1. User Behavior Sequence Overview
1.1. Overview
User Behavior Sequence is a feature that allows users to locate specific users through retrieval, analysis, and model drilling, and view/analyze the basic information and historical behavior records of individual users.
The behavior analysis layer provides macro-level statistical analysis of business data, while the single user behavior sequence enables precise analysis of individual users who are of particular interest to the business, facilitating targeted analysis.
In the user behavior sequence, through the analysis of the behavior sequence, users with certain behavioral characteristics can be observed from a micro perspective to understand their specific performance. This information, when combined with macro-level analysis results, can help identify why users exhibit specific behaviors and assist in product decision-making.
1.2. Common Analysis Scenarios
1.2.1. Business Scenarios:
1. Generic Business Scenarios: In the early stages of business development, when user volume is small and there is no large-scale statistical data to assist in product decision-making, it is necessary to focus on and analyze the behavior patterns of individual users to help determine product development direction
2. Gaming Industry Scenarios: Focus on behaviors of high-value users (big "R"). Based on the payment behaviors of big "R" users, specific gameplay rules and strategies can be formulated
1.2.2. User Roles Scenarios:
1. Product & User Experience Teams: Understand the process of users using the product and assist in adjusting product strategies; for example, verify if data anomalies are related to new functionalities in a new version
2. Service Teams: View and replay the user behavior flow before encountering problems, understand the user's usage process and path for the product; for example, customer service staff/auditors can pinpoint the causes of user issues and their operation paths
3. Development Teams: Reproduce abnormal user behavior flows and recreate problem scenarios; for example, reproduce bugs
1.3. Applicable Roles
| Permission Points\Roles | System Roles | Custom Roles | |||
|---|---|---|---|---|---|
| Using User Behavior Sequence | Administrator | Analyst | Developer | Regular User | Custom Role Name |
| Default Activation | Default Activation | Default Activation | Default Inactivation | Custom Configuration | |
2. User Behavior Sequence Introduction
2.1. Entry to User Behavior Sequence
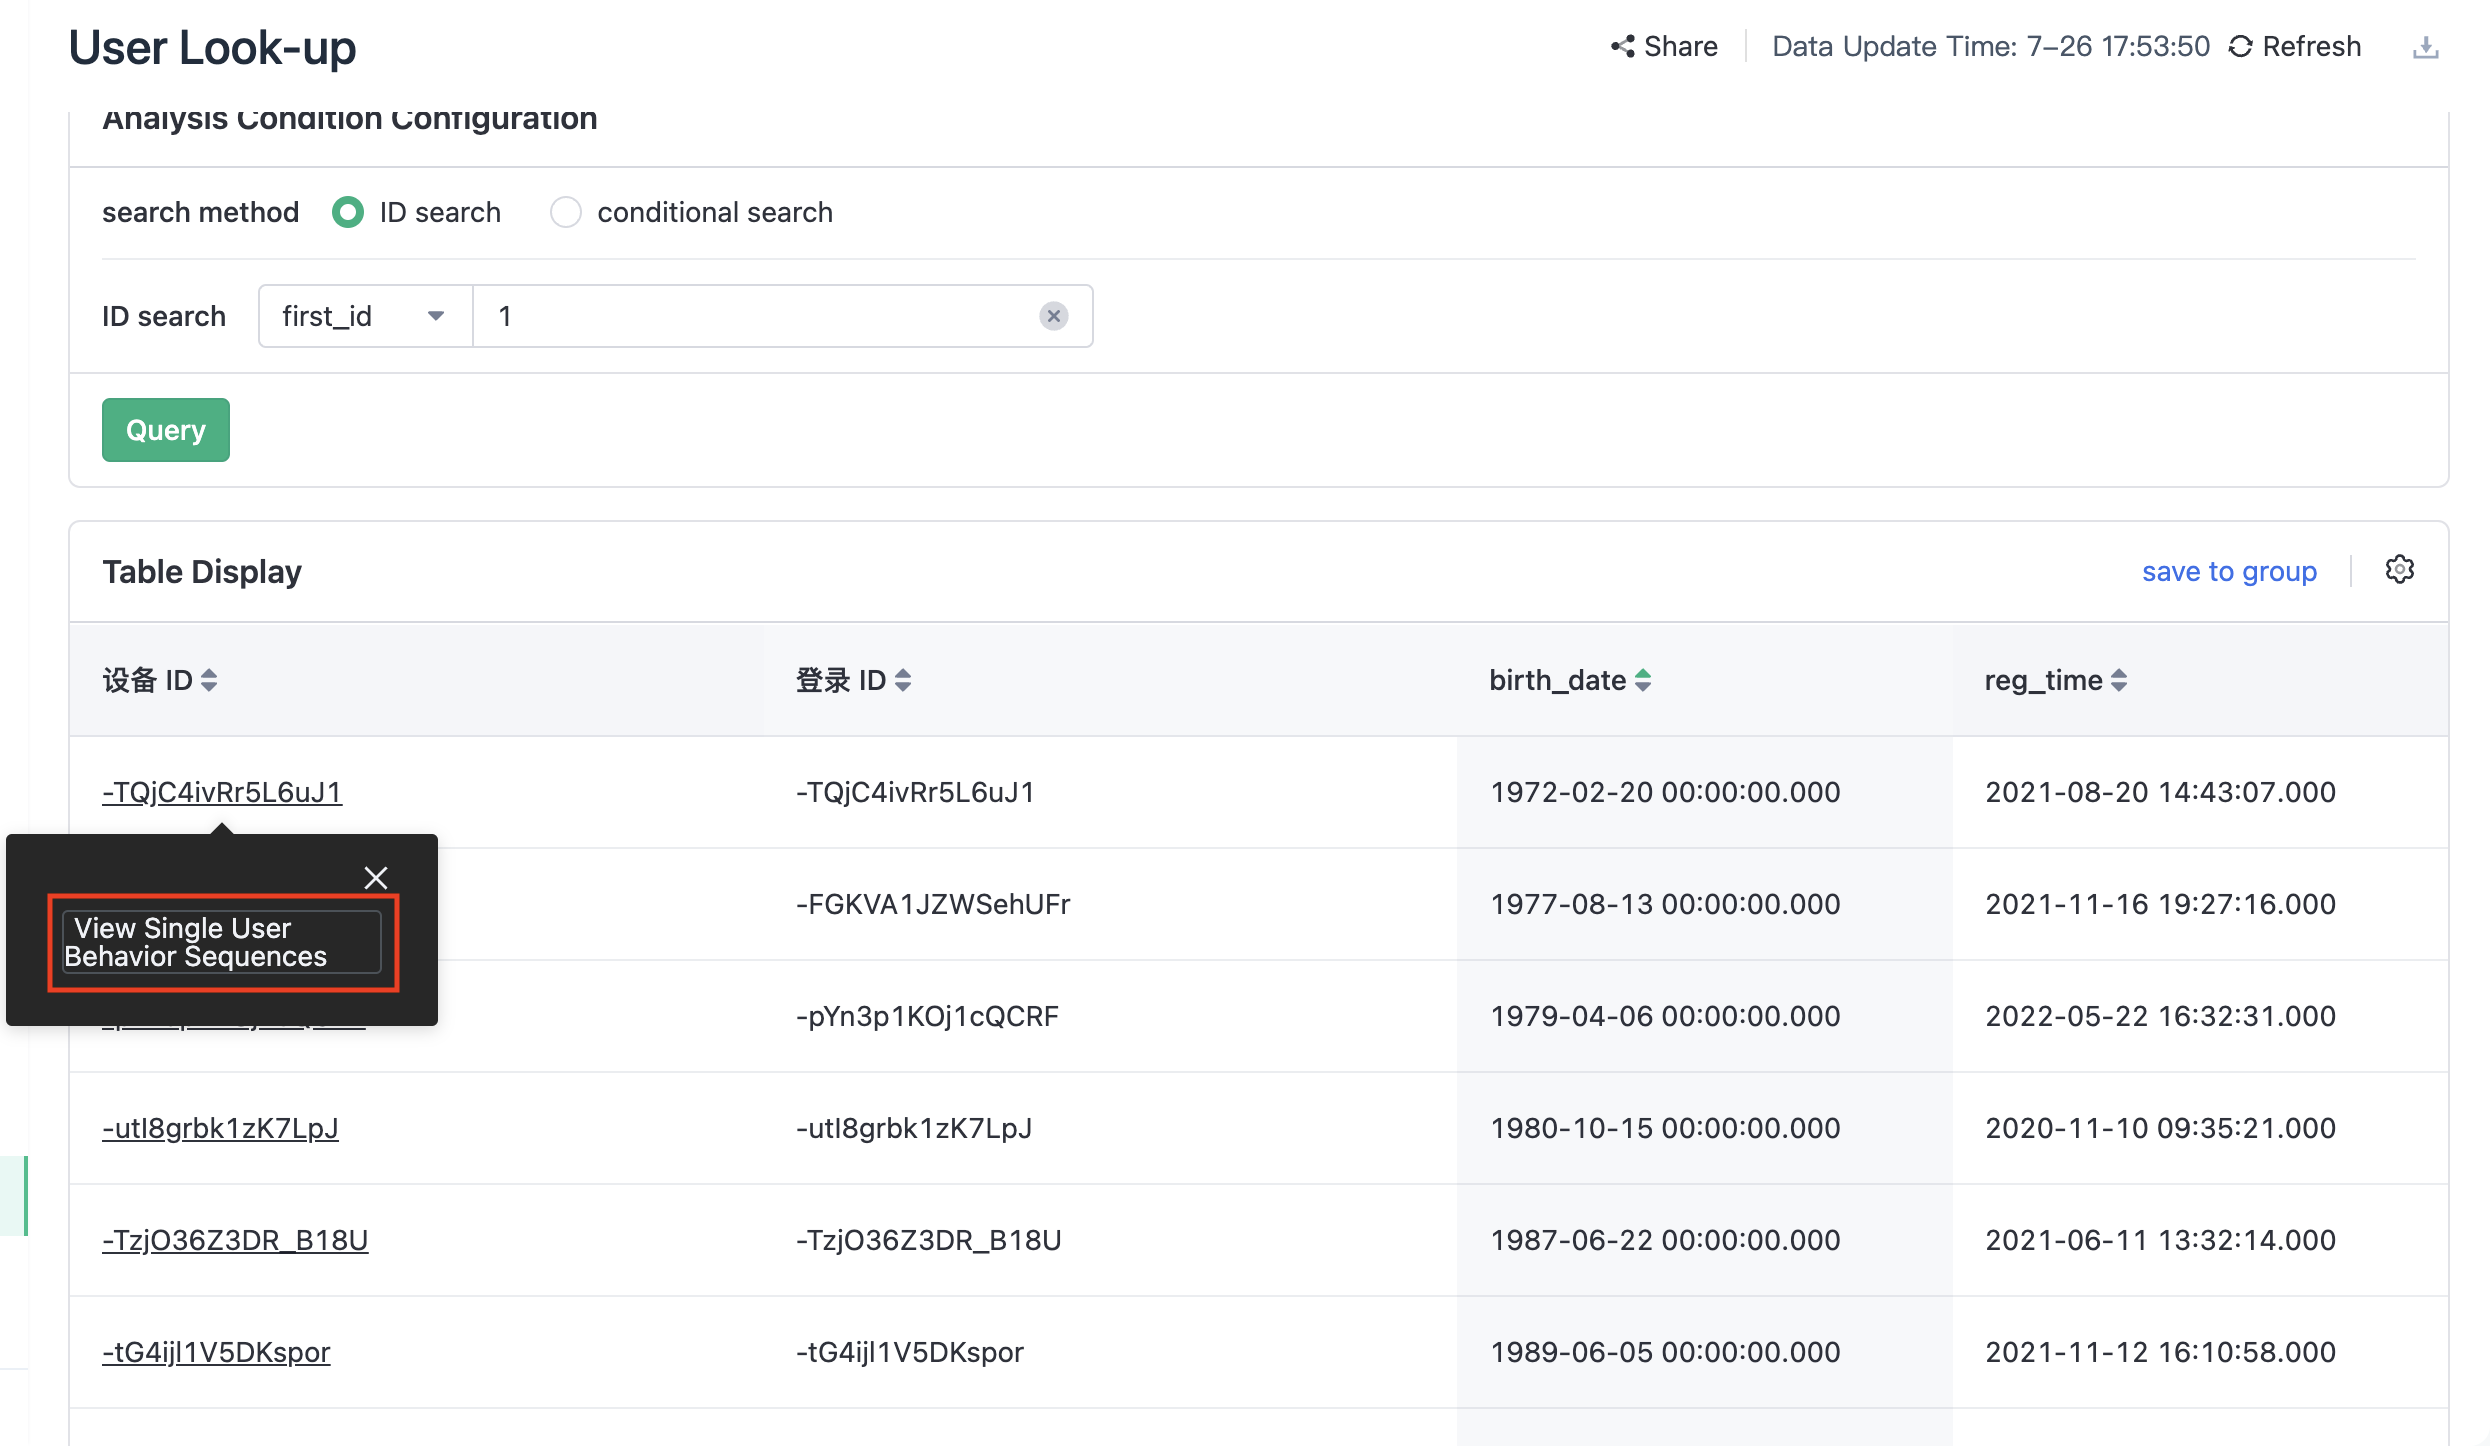
2.1.1. User Look-up Drill-down
Targeted users can be queried through User Look-up Drill-down, and a user list is generated. Clicking on the blue link of the device ID in the user list can drill down to the User Behavior Sequence page.
2.1.2. Analysis Model Drill-down
When the analysis model is related to the metrics and number of users, you can "View User List" and the "User List" supports jumping to the User Behavior Sequence.
The analysis models that currently support jumping to the user list are: Event Analysis, Funnel Analysis, Retention Analysis, Distribution Analysis, LTV Analysis, Session Analysis, User Path Analysis, Attribution Analysis, Heat map Analysis, Attribute Analysis, Dashboard and User Lifecycle.
2.2. Basic Features
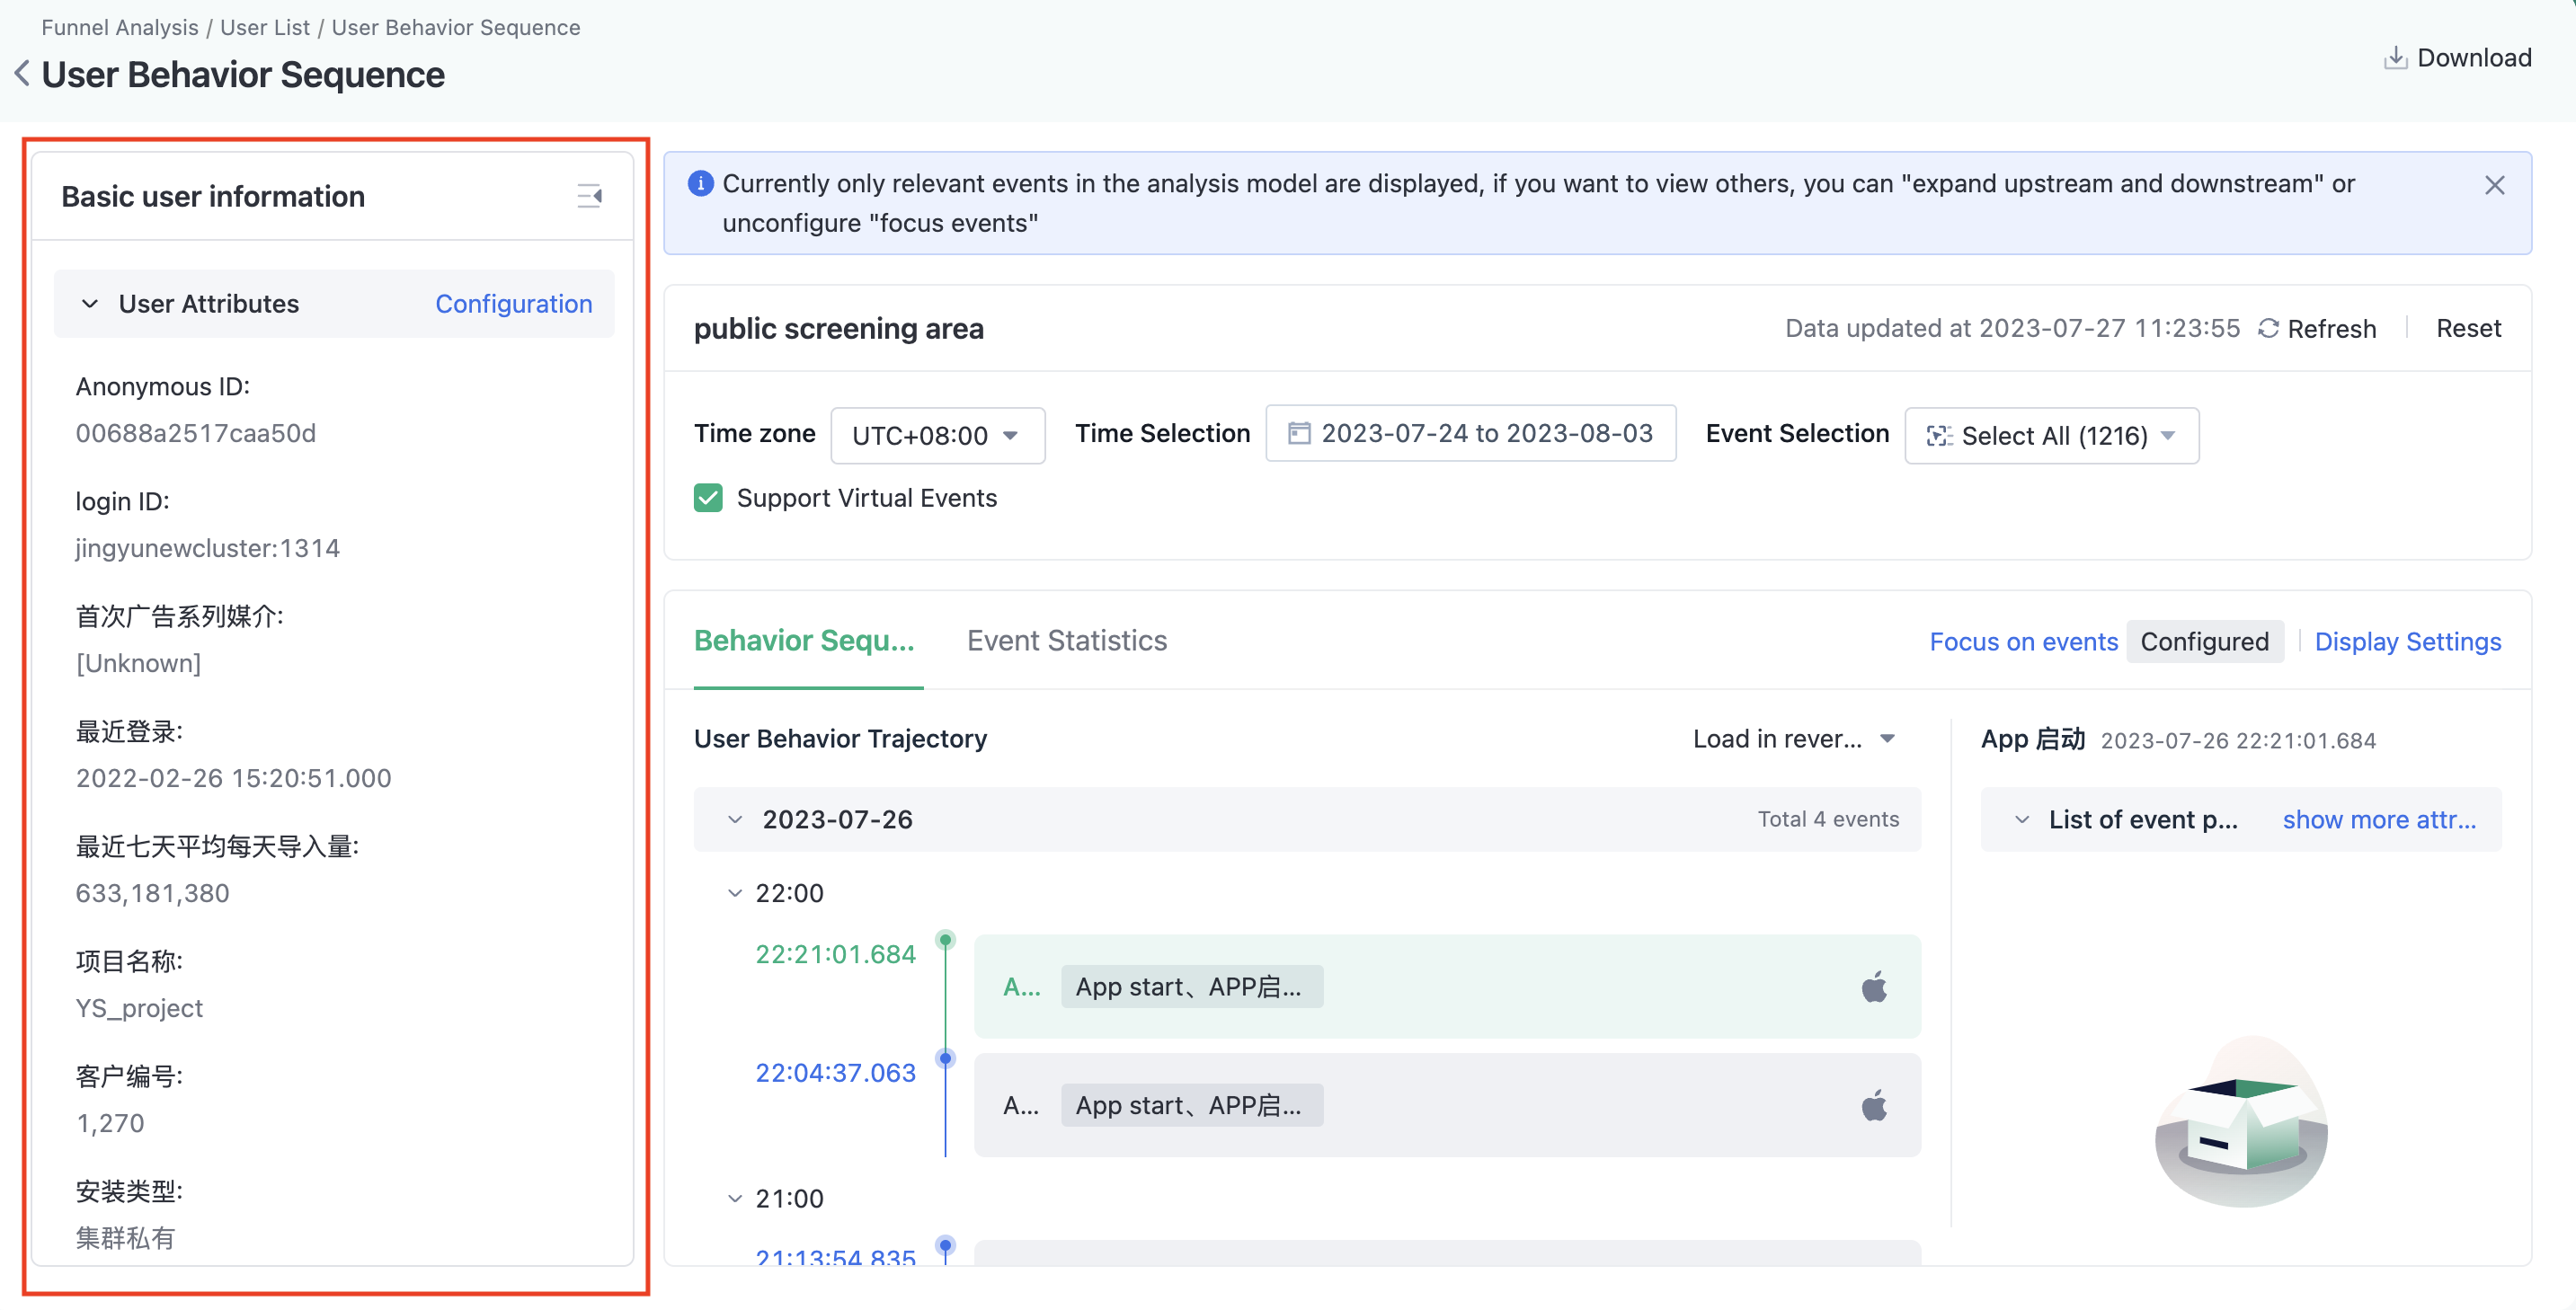
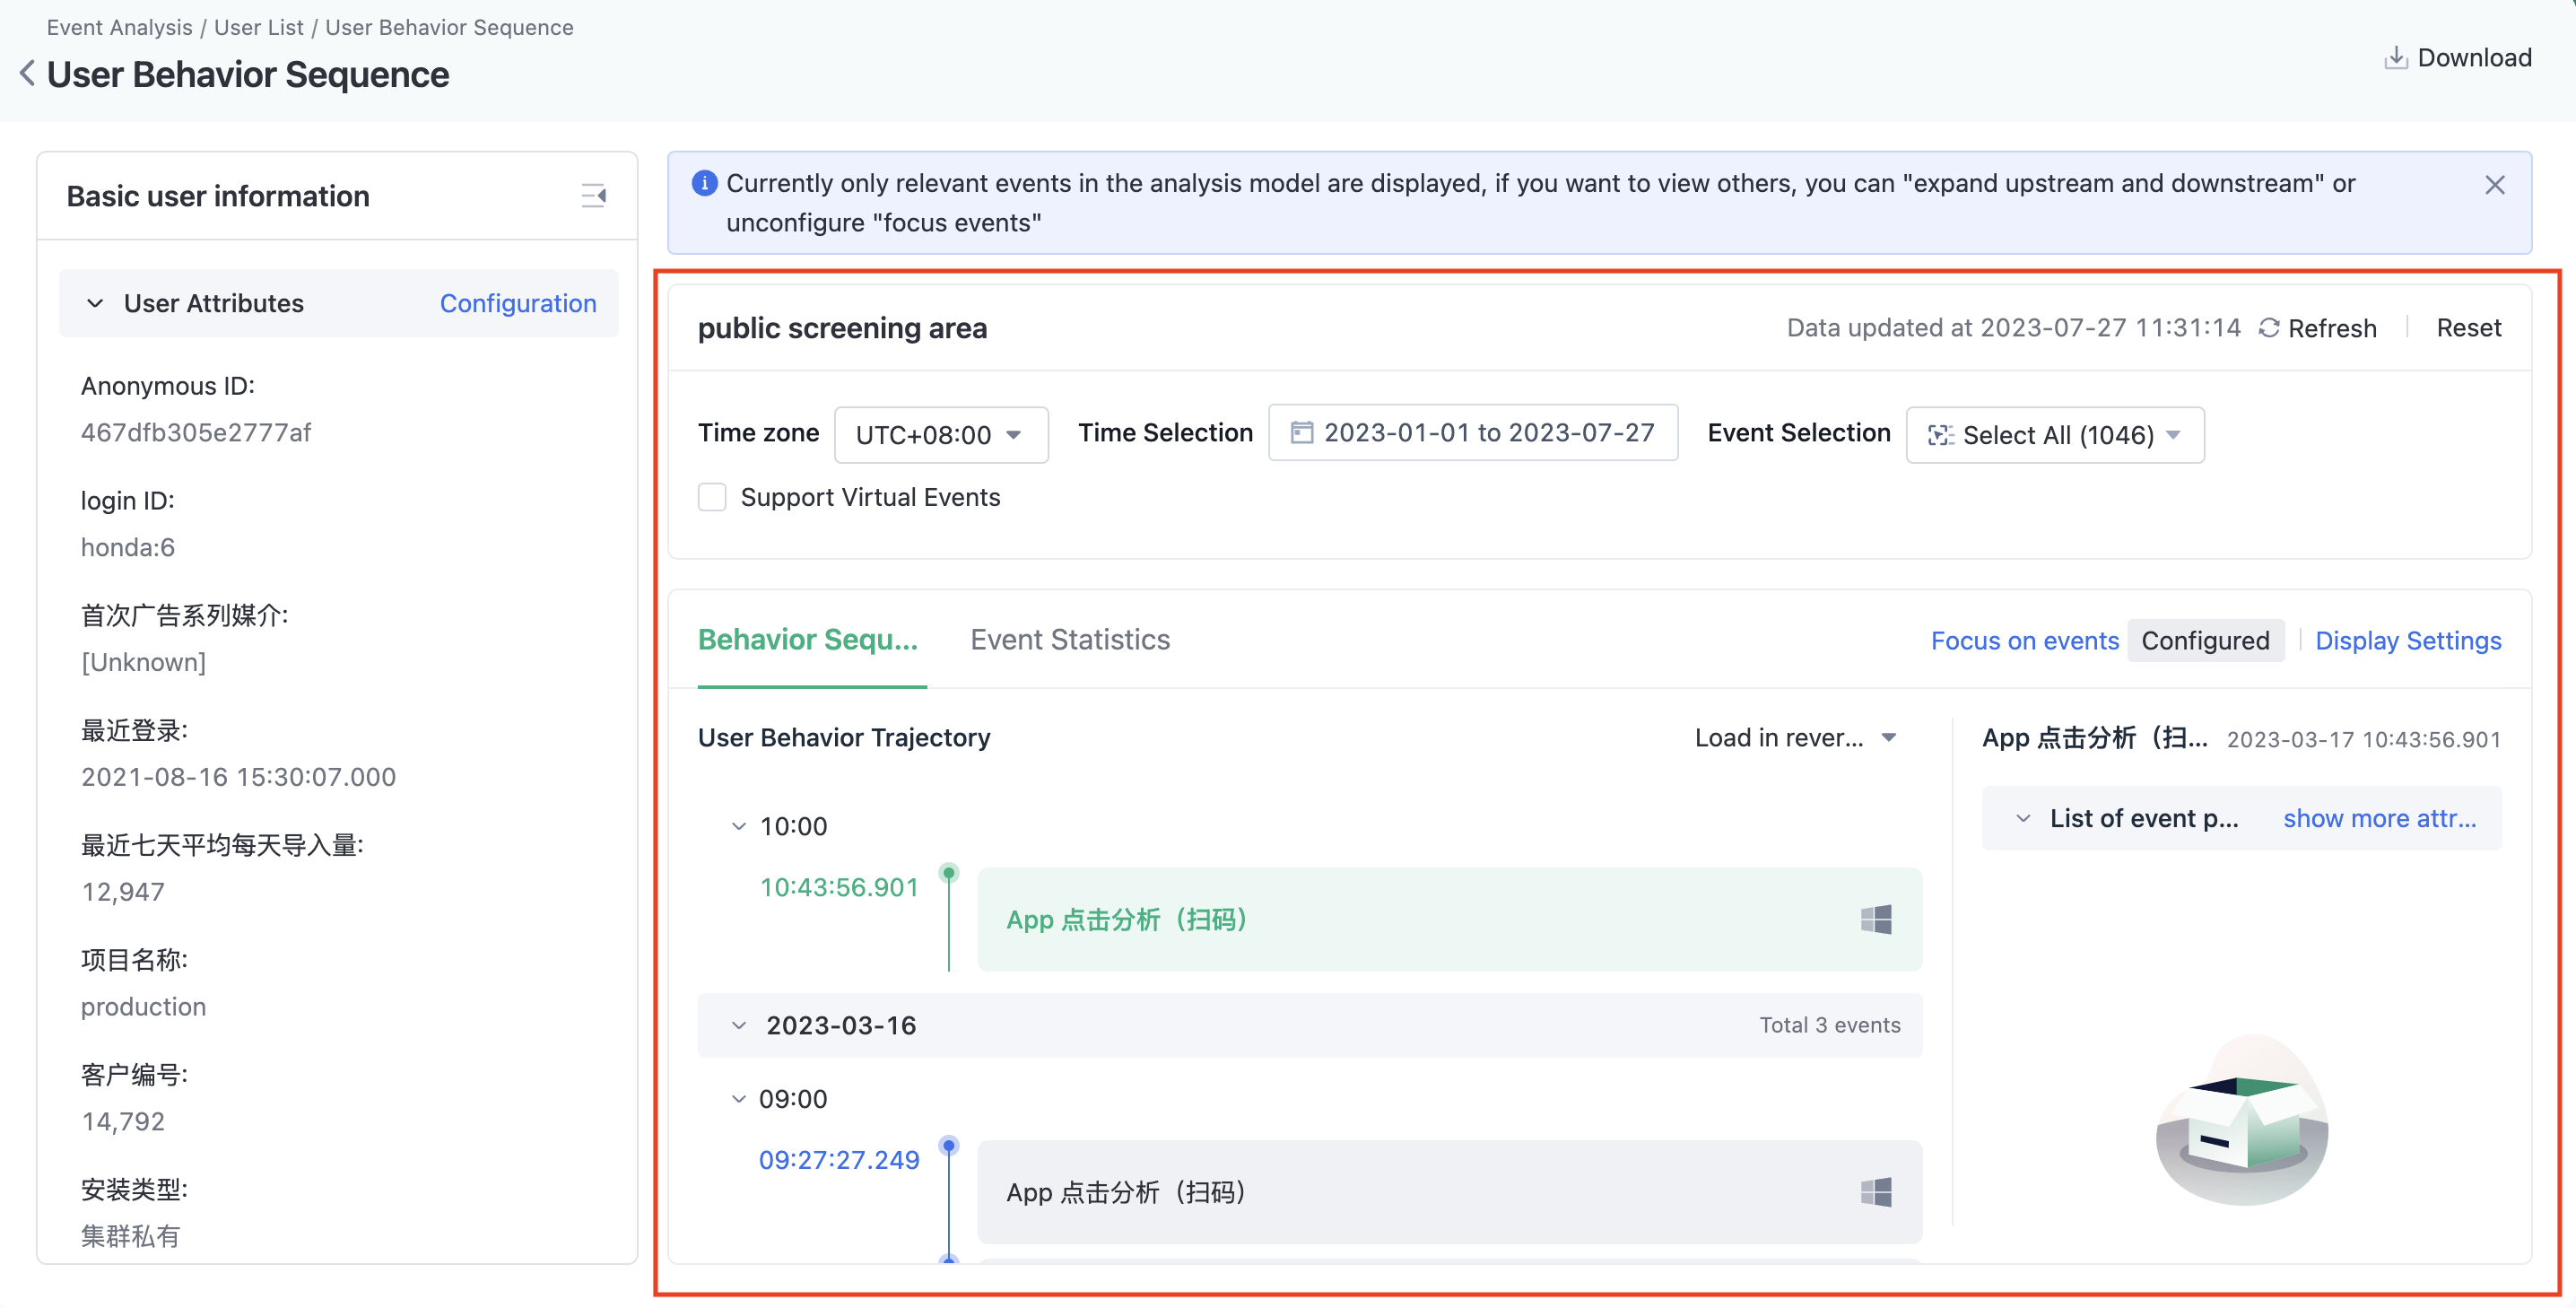
2.2.1. User Basic Information
"User Basic Information" supports displaying user attributes, user tags, user segments, and custom properties.
2.2.1.1. User Attributes
By default, the first 50 user attributes in the user list are displayed, and it supports adjusting the displayed user attributes based on business requirements.
Up to 50 user attributes can be configured and they will take effect in the "User Attributes" section of the user basic information after configuration.
2.2.1.2. User Tags
The user tags section is initially empty and supports custom configuration based on business requirements.
Up to 50 user tags can be configured, and after configuration, the tag names and values for each user will be displayed in the "User Tags" section of the user basic information.
2.2.1.3. User Groups
The user groups section is initially empty and supports customization based on business needs.
Up to 50 user groups can be configured, and after configuration, the segment names and whether each user belongs to that group will be displayed in the "User Groups" section of the user basic information.
2.2.1.4. Custom Properties
Custom properties are an advanced feature that relies on the metric platform. If you have opened the metric platform, you can use this feature.
Custom attributes can perform statistical analysis on events/sessions triggered by target analysis users, for example, calculating the total recharge amount of a user in the past 30 days (the sum of recharge amounts for recharge events).
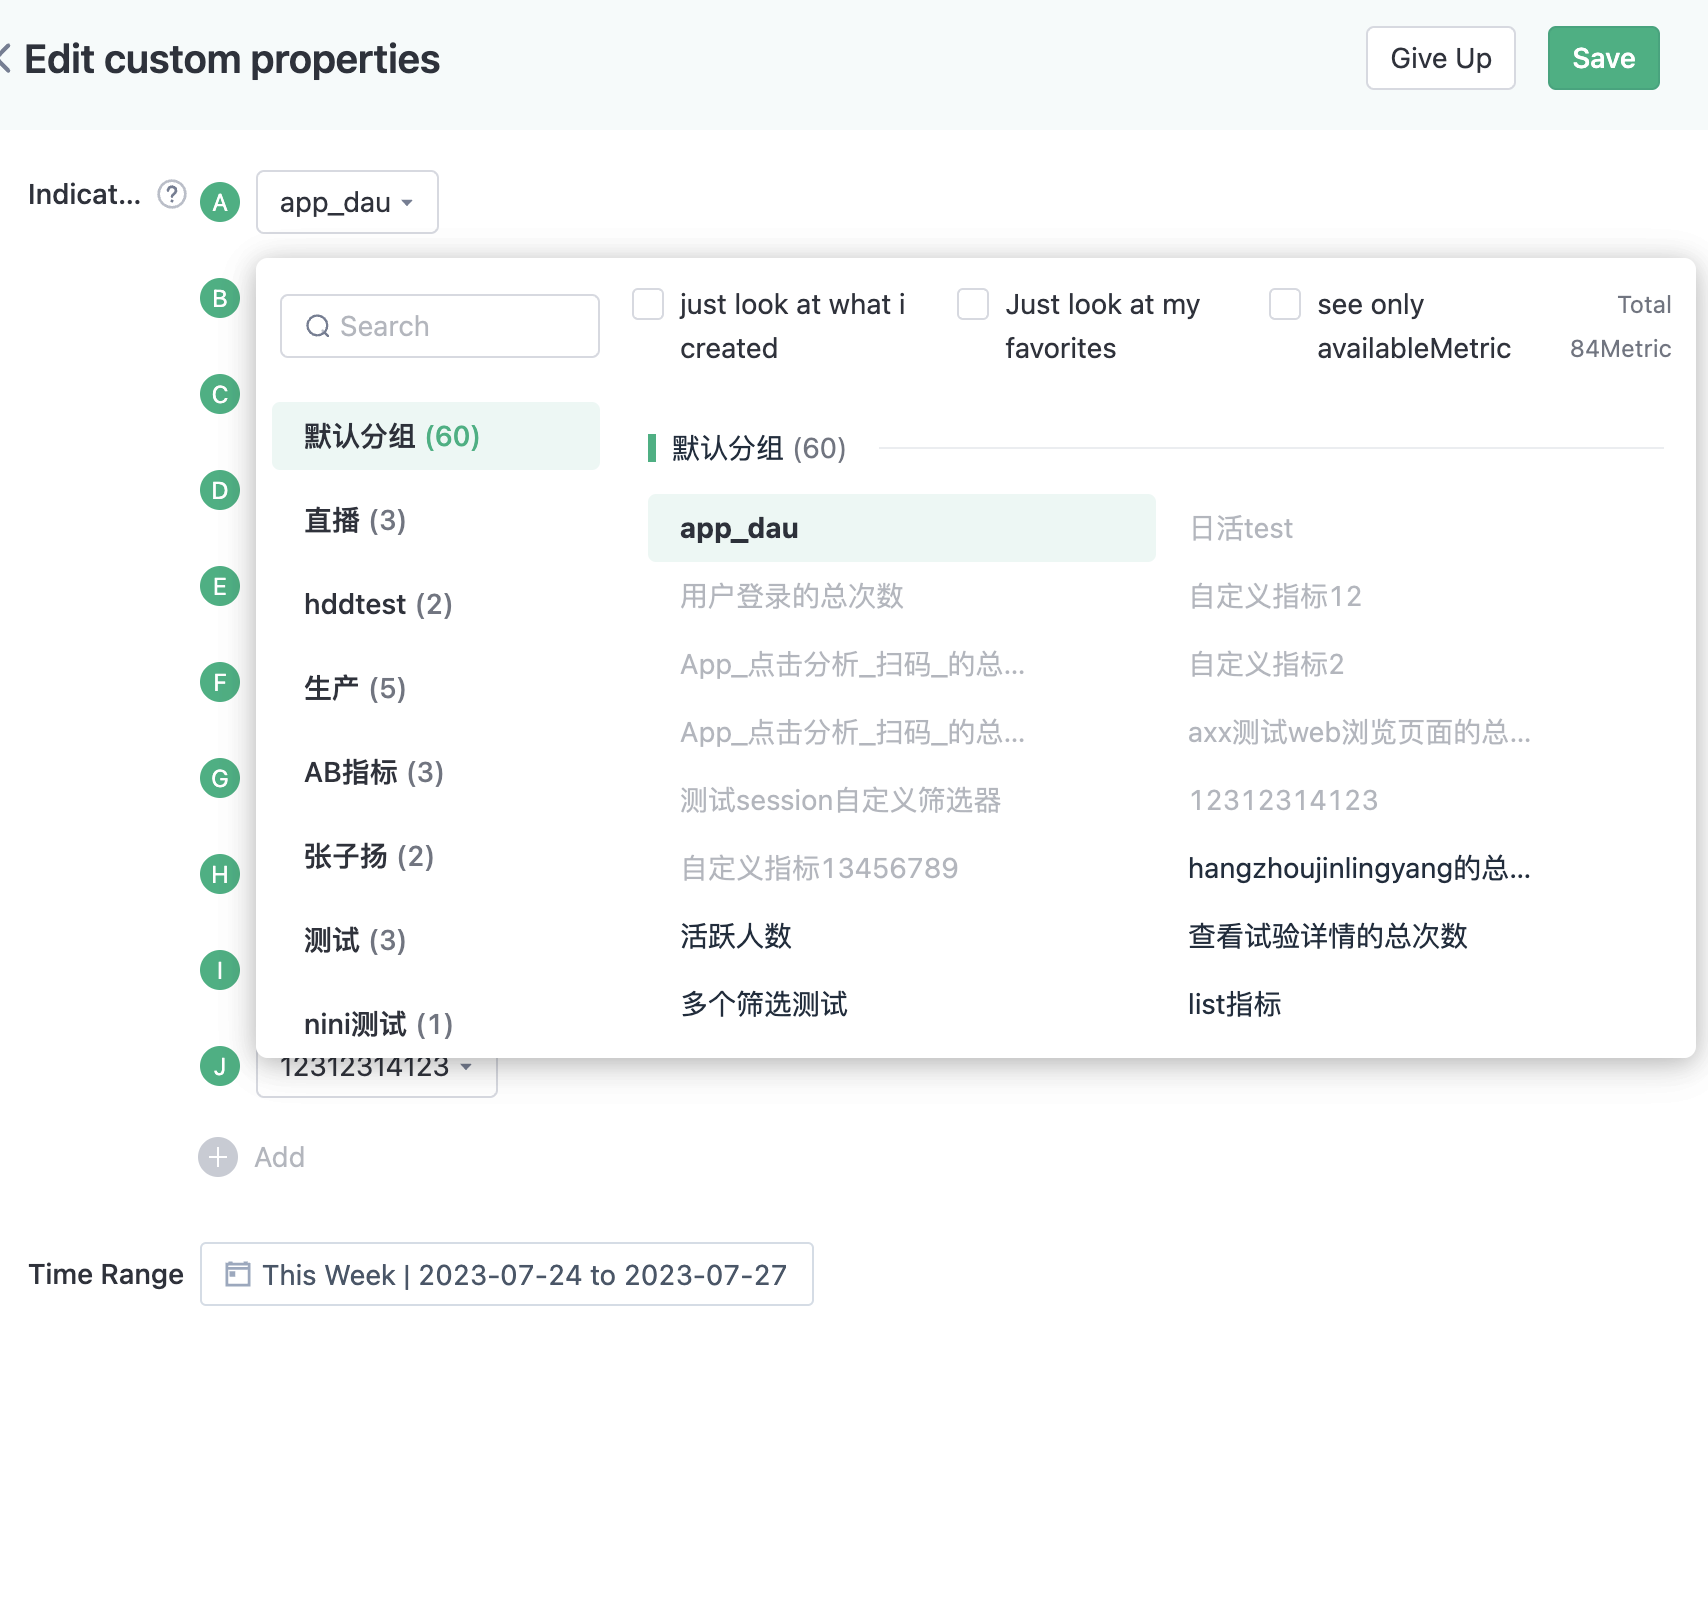
After clicking "Edit" open the custom attribute configuration drawer, first select the metric, then select the calculation time period, and click save to initiate the query.
Time supports both static and dynamic time.
Note: Custom attributes currently only support metrics from event analysis and session analysis, and can only use metrics created based on the current subject.
Up to 10 custom attributes can be configured, and once configured, they will take effect in the user's basic information-custom attributes, displaying the metric values for that user.
2.2.2. Basic functionality of behavioral sequences
In the process of using user behavior sequence analysis, the common filter area of the page provides configuration options for analysis time zone, time range, and event range
The display area is divided into "behavior sequence" and "behavior statistics"
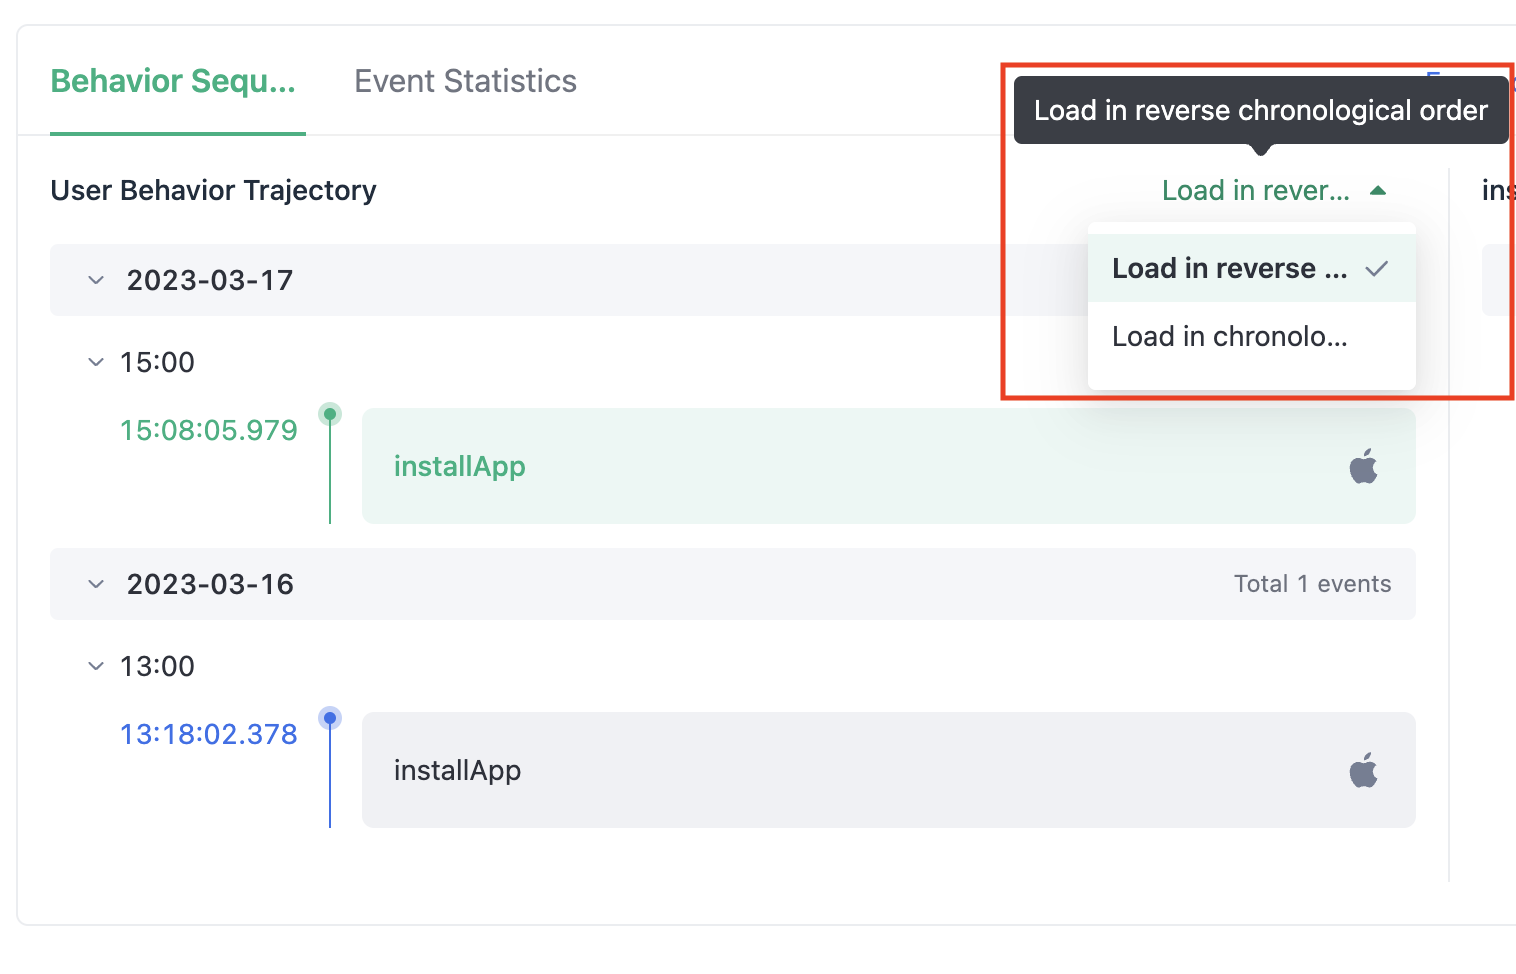
2.2.2.1. Order of loading behavior sequence
Supports adjusting the display order of behavior sequences. By default, they are loaded in reverse chronological order, and can be adjusted to load in chronological order
2.2.2.2. Focused event
If you want to view only the key events in the behavior sequence, you can use the "Focus on events" capability
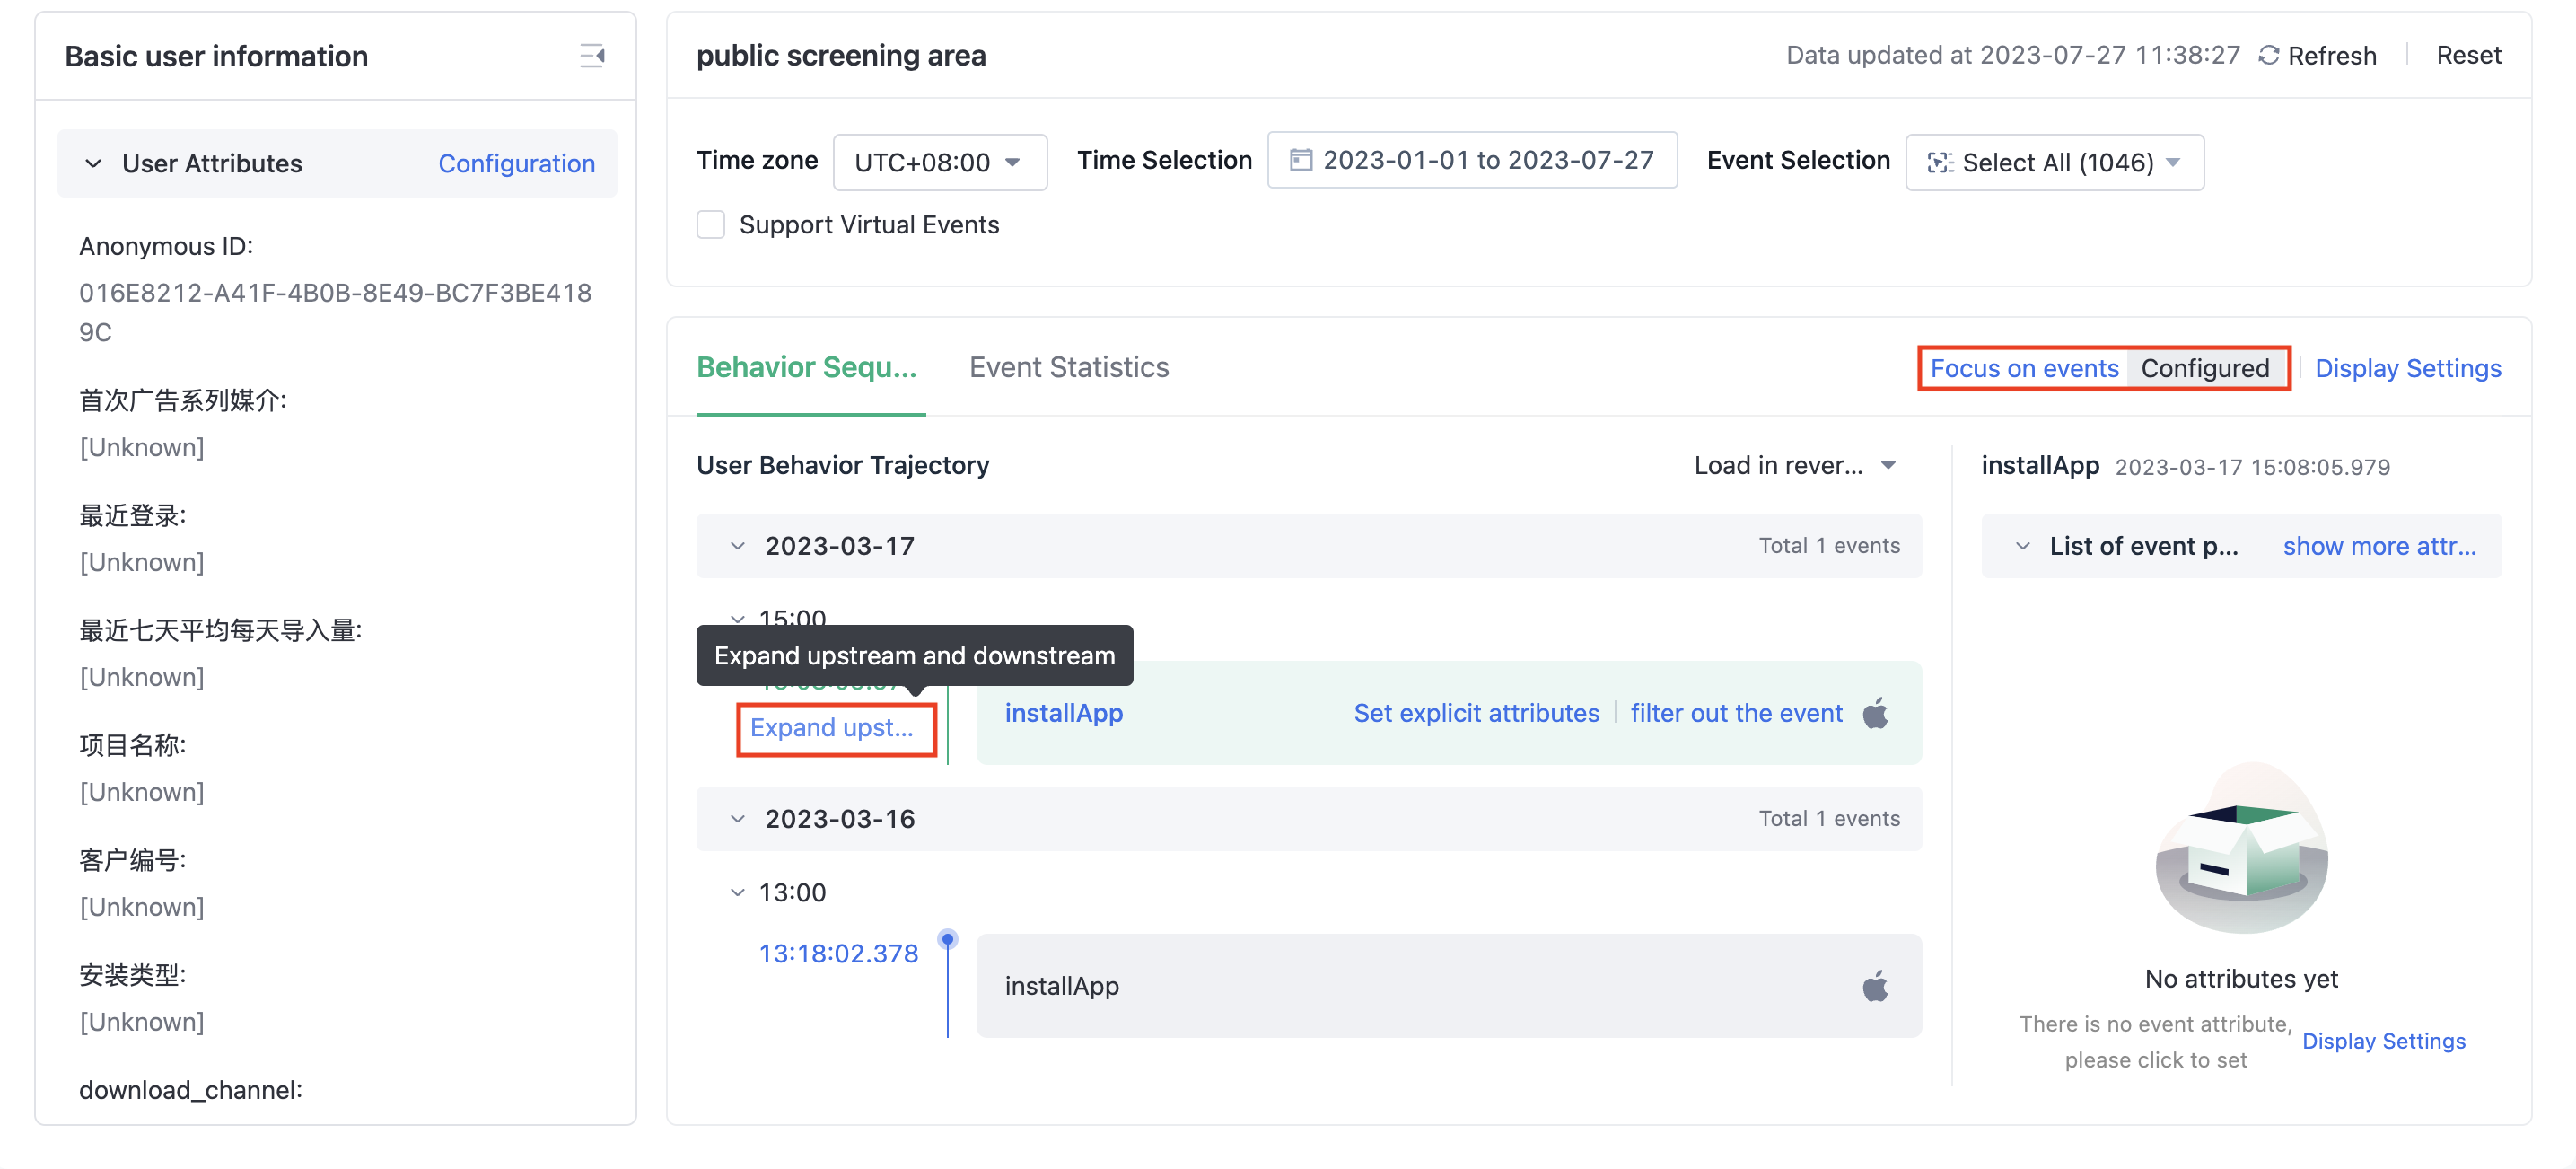
After configuring the "Focus on events", only the focused events will be displayed in the behavior sequence;
If you want to view the behavior before and after the focused event, analyze the cause of the behavior, you can click "Expand Upstream and Downstream" to expand the behavior before and after the focused event at a certain moment
2.2.2.3. Display settings
Display settings support "Attribute Display" and "Event Highlight"
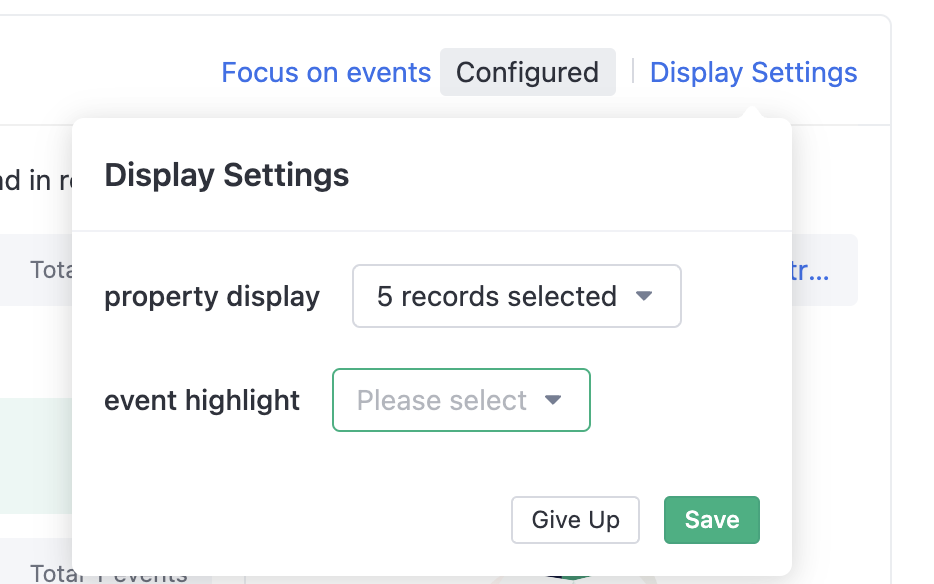
The properties configured in "Attribute Display" take effect for all selected events. After selecting attributes in the attribute display and clicking save, the configuration will take effect in the "Event Attribute List", which is described in detail in 2.2.2.4
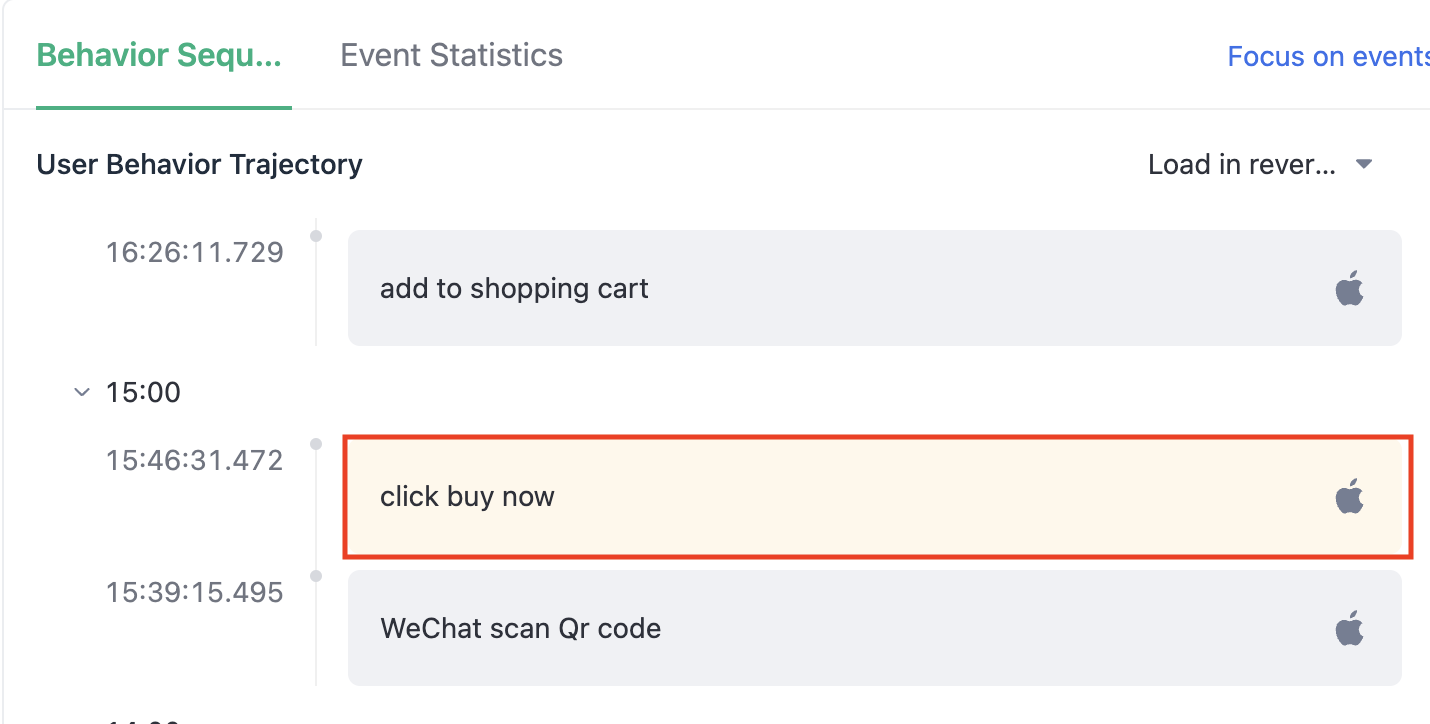
During the process of viewing the behavior sequence, if there are important events that you want to highlight, you can use the "Event Highlight" function
Select the events that you want to highlight in the event highlight, and click OK to take effect in the behavior sequence. The highlighted events will be displayed as yellow blocks
2.2.2.4. Event attribute list
The event attribute list first displays the attributes configured in the display settings-attribute display.
If you want to configure the display of event properties separately for a specific event, you can configure it in the "Show More Properties" in the event property list. After configuration, the properties configured in "Property Display" and "Show More attributes" will be displayed in the event attribute list.
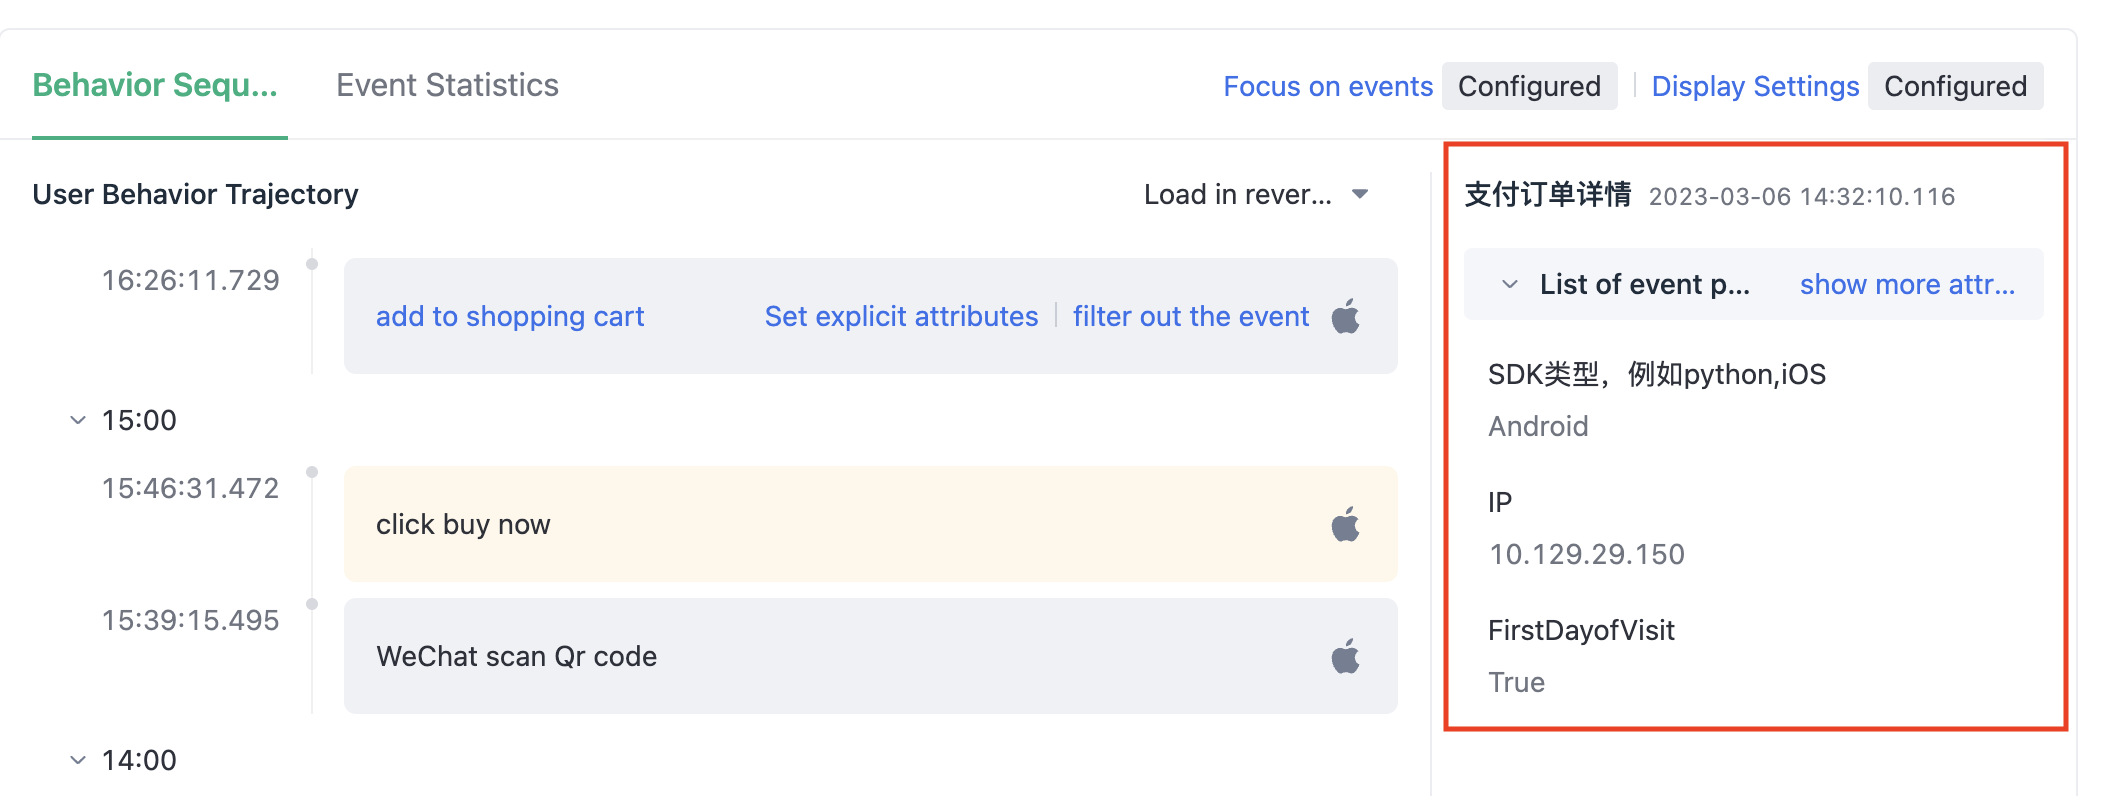
2.2.2.5. Set External Display Properties
When browsing behavior events, you can "Set Explicit attributes" for the events. You can select up to 3 properties, and these properties will be directly displayed on the behavior sequence without having to click the events.
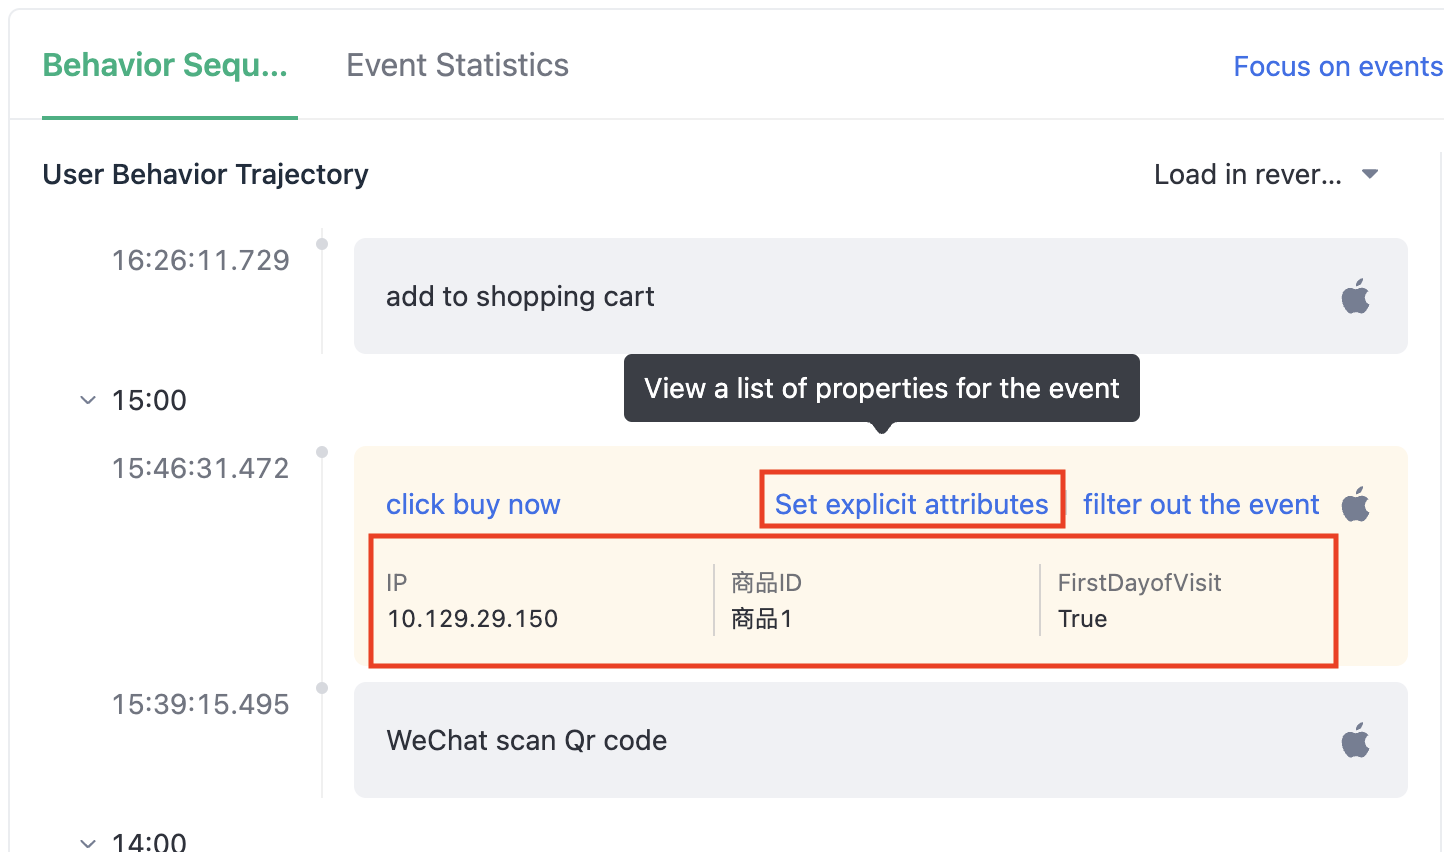
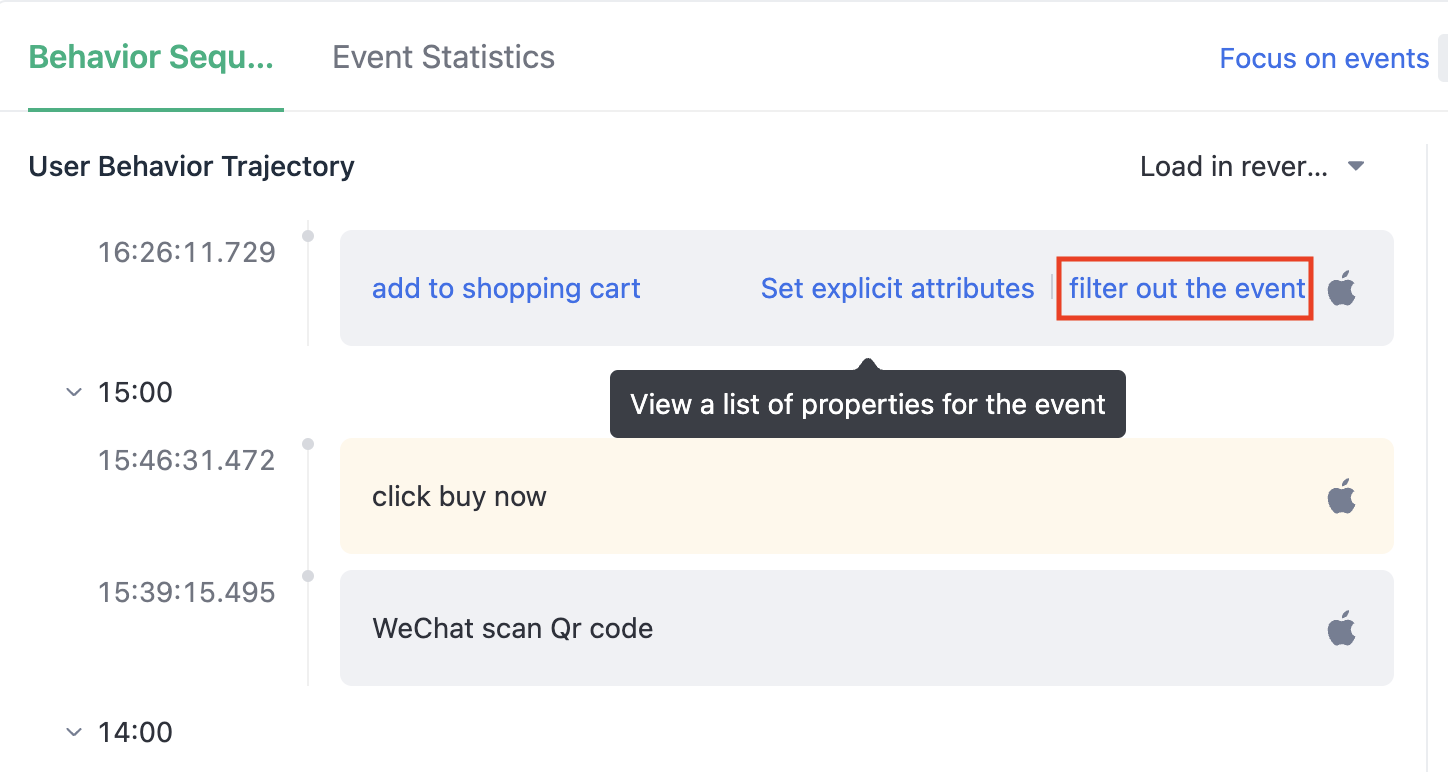
2.2.2.6. Filter out the event
During the process of viewing the behavior sequence, if there are frequently triggered events that are not of business importance, it may affect the overall view of the behavior sequence. In this case, you can use the "Filter out this event" function to filter the same event with one click.
2.2.3. Event Statistics
Event Statistics can analyze and calculate the total number of events, including event trend chart and behavior statistics chart.
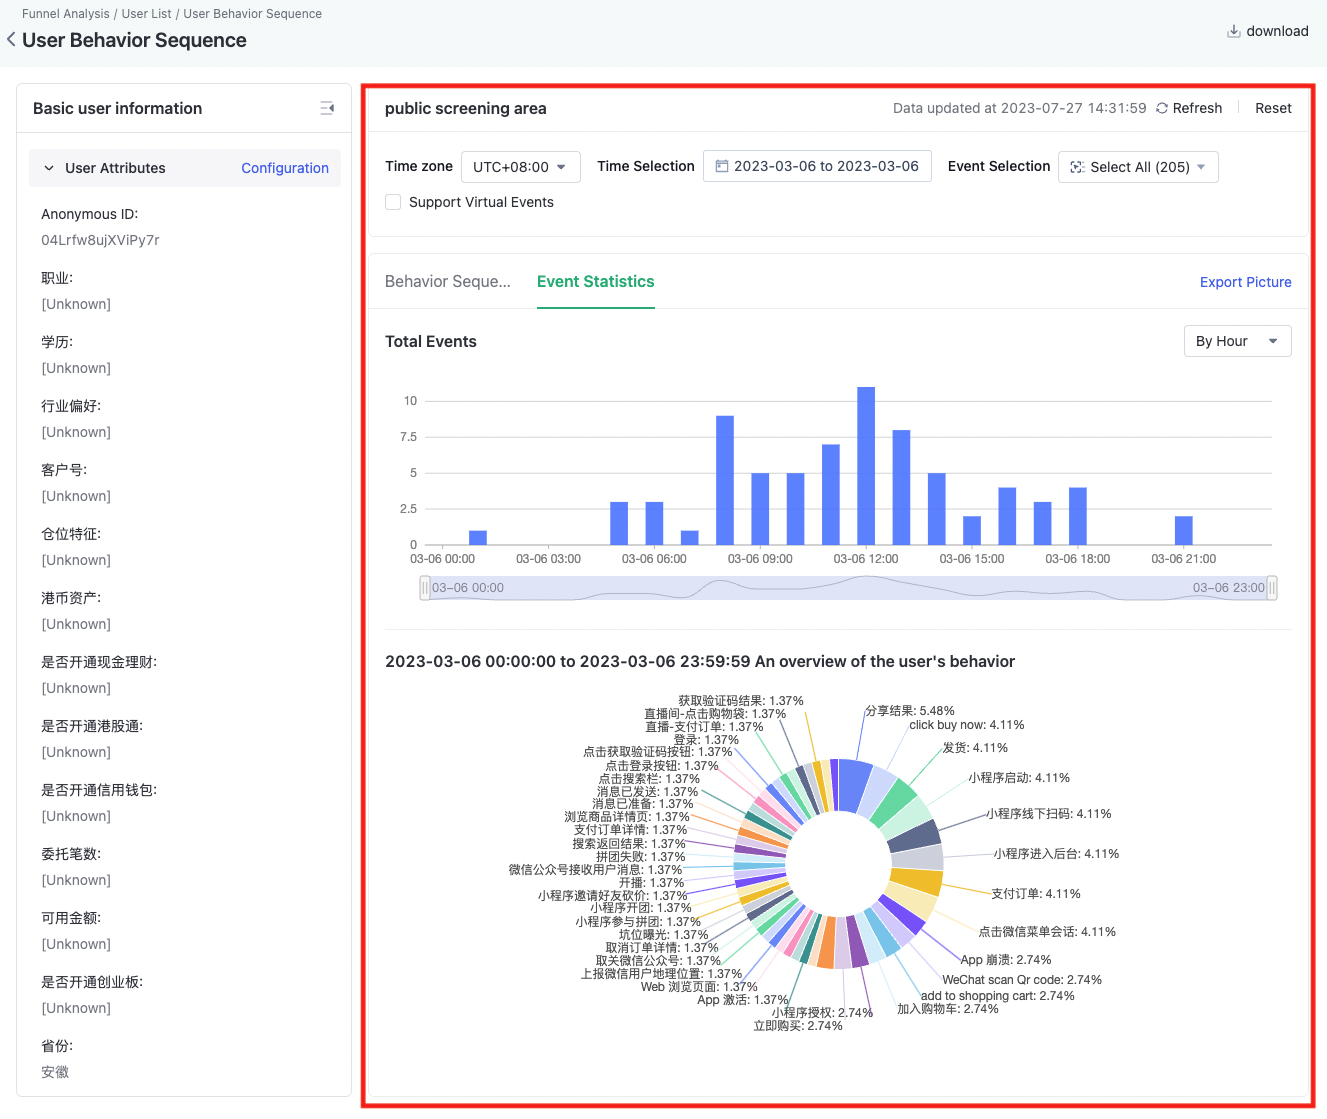
2.2.3.1. Event Trend Chart
The event trend chart can display the total number of events and its changing trend on different dates. The default granularity is day, and you can switch the time granularity.
2.2.3.2. Behavior Statistics Chart
In the behavior statistics chart, you can visually see the proportion of different events in the total number of events through the pie chart.
3. Functional application examples
Note: The content of this document is a technical document that provides details on how to use the Sensors product and does not include sales terms; the specific content of enterprise procurement products and technical services shall be subject to the commercial procurement contract.
 Popular Searches