Product Update Log
|
Collect
3.0: Released on July 30, 2023
Core features:
- 【Upgrade User Group Profile Analysis】
- Added a business dataset license that only supports User Group Profile Analysis, supporting customers to independently use the User Profile Analysis module + basic segment management capability of Sensors Analytics without purchasing data processing
- Added permissions: Customers only need to open the "User Group Profile Analysis" and "Business Dataset" corresponding permissions to use the functionality, simplifying the permission types.
- Added two methods to set rules for selecting people in the circle: "Filter Based on Existing Segments" and "Filter Based on Rules", to meet the diverse configuration needs of segments.
- User group profile templates have been migrated to the user profile analysis page. Administrators can search, create, edit, delete, and copy user group analysis templates in the analysis model to simplify operations.
- User group profile models can be added to the business dataset. Customers who have created analysis reports in the "User Profile Analysis" module can store, edit, update, and share the analysis reports in the "Business Dataset" after opening the complete version of the business dataset/user profile version of the business dataset module.
- Updates to user profile analysis operation logs: Customers can query operation logs to help locate issues.
- Migration of old profile reports: For customers who have upgraded to version 3.0 of user group profile analysis reports, we will migrate the old reports after the upgrade.
- 【Upgrade RFM】
- Added Sensors Analytics RFM analysis module license, supporting customers to independently use the user profile analysis module + basic segmentation capability of Sensors Analytics without purchasing data processing
- Added permissions: On the basis of opening the RFM License, customers only need the administrator to configure the "RFM Analysis" permission for other roles as needed, which can control the scope of use of the RFM analysis module.
- Updates to RFM analysis operation logs: Customers can query operation logs to help locate issues.
- 【Custom Query Added Data Permissions】
- Table-level permission control has been added to the data tables in custom queries. Users can only see and use the data tables for which they have permissions in the left catalog of custom queries. Tables without data permissions can apply for opening data permissions for accounts with the "Data Table Management" permission. For details on how to enable data table permissions, please refer to the [Data Table Management - Permissions] guide.
- 【Optimized Metric Management Module】
- Remove the dependency of the "Data Table" creation method in the Metric Management on the metadata permission points. Users with "Manage all metrics" or "Manage my metrics" permission points can use the "Data Table" to create metrics. Connect the data table permission of the "Data Fusion" so that users can only create metrics using the data tables they have permission to. Enrich the data table sources for creating metrics, supporting users to create metrics using six types of table sources: Item Table, Tag Table, Segment Table, SQL Intermediate Table, Detail Table, and Custom Table.
- 【Optimization Dimension Management Module】
- Remove the dependency of "Data Table" creation method on metadata permission points in dimension management, users with the "Manage All Dimensions" permission can use the "Data Table" to create dimensions; Connect the data table permission of [Data Fusion], users can only use the data tables they have permission to create dimensions; Enrich the source types of creating dimension data tables, support users to use six types of sources including item tables, tag tables, segment tables, SQL intermediate tables, detail tables, and custom tables to create dimensions.
- 【Optimize the relationship module】
- Synchronize the physical table relationships in [Data Fusion-Entity Relationship]. In other words, the relational relationships established between physical tables during the creation of entities in [Data Fusion-Entity Definition] will be automatically synchronized to the relationship list in [Metric Platform-Association Relationship]. Users can use such relationships in metric analysis. For the relationships synchronized from [Data Fusion-Entity Relationship], users can only view them in the relationship management module of the metric platform and cannot edit them. If editing is required, it can be done in [Data Fusion-Entity Relationship]. If a relationship is deleted from [Data Fusion-Entity Relationship], the synchronized relationship in the metric platform will also be deleted.
- Integrate [Table Application Management] with [Data Fusion].
- Optimize the way to enable table scope in [Data Fusion], the function of enabling/disabling data table application in [Table Application Management] is unified in [Data Fusion].
- Support eight types of sources, including event table, user table, item table, tag table, segment table, SQL intermediate table, detail table, and custom table, to be synchronized and enabled in the metric platform.
- Connect the data table permission of [Data Fusion], users can check in [Table Application Management] whether they have the permission to build metrics, dimensions, and association relationships using data tables.
- The function of setting primary key in the original data table management is integrated into [Data Fusion].
Other features and optimizations:
- Navigation bar changes
- Added a second-level directory "User Analysis" in the first-level directory "Analysis", User Profile Analysis Model and RFM Analysis are in the "User Analysis" directory.
2.5: Released on December 30, 2022.
Core functionality:
- Add the Metric Platform
- Support customers to define metric calibers through event analysis, retention analysis, and accessing business tables.
- On the one hand, help companies build a unified metric system and define uniform metric calibers; on the other hand, improve the usability of common metrics through the encapsulation of complex conditions.
- The metric dimensions established by customers can be used for multidimensional and multi-metric correlation analysis in metric analysis, establish common business models, and distribute data to the granularity of individual permissions through visualization.
- The extended support capability mainly focuses on strengthening the capabilities of items and correlation analysis, such as:
- The play volume of movies starring Tom Cruise
- Analysis of securities funds, holdings, and assets
- Retail Goods, Order Analysis, etc.
- 【Optimization Report Module】
- New capabilities for business dataset, including collaborative management permissions for business models, data distribution permissions, scheduling management, application statistics, etc.
- In terms of permissions, for customers with a data platform period, support centralized management of business models according to rules, configure corresponding visual dashboards, distribute them to different departments/branches according to different permissions, and ensure that branch personnel can quickly view data in the visual dashboards and access data details;
- In terms of scheduling management, support users to configure different scheduling times, frequencies, and cycles according to priority. While ensuring business priorities, support detailed application statistics for resource utilization to avoid resource waste.
- The visualization layer of the reports has added more graphs and capabilities, and also supports collaborative management.
- New capabilities for business dataset, including collaborative management permissions for business models, data distribution permissions, scheduling management, application statistics, etc.
Other features and optimizations:
- Provide a brand new OpenAPI design for developers, further enhancing the ability for secondary development, including the import and export API for overviews (support cross-environment migration or quick copying across projects).
2.4: Released on June 1, 2022
Core features:
- 【Sessions Analysis】
- Separated from event analysis and become an independent analysis model.
- Sessions analysis page integrates session management functions, forming a closed loop of business and shortening the overall usage path.
- Support custom metrics, custom metric naming, and new metrics for the number of events within sessions, improving analysis efficiency and expanding application scenarios.
- 【Custom Query】
- Support saving intermediate results as intermediate tables to reduce the complexity of calculation logic, improve query performance, and support mixed calculation using EUI tables, third-party tables, and intermediate tables.
Other optimizations:
- Overview, Intelligent Alert: Access to unified sender mailbox configuration capabilities, no need to separately configure the sender address. Solve the problem of mixed use of emails, improve the security coefficient of email information, and improve the efficiency of administrators managing emails.
2.3: Released on August 9, 2021
Core features:
【Intelligent Alert Analysis】: Upgraded alert management to intelligent alert analysis, accurately detects data anomalies and quickly identifies the causes of anomalies.
"Intelligent Alerts"
Based on historical data, intelligently predicts the value range of metrics and accurately detects data anomalies.
Robust rule-based alert engine, supports customizable rule configurations.
Multi-channel alert notifications, supports webhooks (for enterprise groups), emails, system messages, etc.
"Intelligent Analysis"
Dimension analysis of anomalies: Generates dimension layers and traverses all dimension values, compares fluctuation ranges, and identifies abnormal dimensions.
User analysis of anomalies: Locates abnormal behavior users based on distribution analysis, diagnoses fraudulent users and cheaters. Allows customization of user entities and deep analysis of abnormal user behavior sequences.
Alert of corresponding period: Checks the coincidence of simultaneous alerts for multiple metrics from the time series of historical anomaly points to explore the mutual influence between metrics.
Metric correlation analysis: Explores the positive/negative correlation and degree of correlation between multiple metrics, enriches business understanding, and improves decision-making science.
- 【Scenario Store】: Upgraded the original scenario library to a scenario store, providing more industries and deeper scenario templates
- Supports directly generating scenario templates from overviews, improving the efficiency of template updates.
- Supports secondary configuration from overviews generated from scenario templates.
- Supports all analysis models except Web Clicks and App Clicks Analysis.
- Supports virtual events and virtual properties.
- 【New Navigation】: Completed information architecture flattening to provide customers with a smooth and complete user experience, achieving a complete SDAF closed-loop within a single menu.
- Supports fully customizable navigation, supports displaying product lines as parallel product functionalities and also supports maintaining navigation and switching for different product lines.
- Navigation supports various configuration capabilities, such as: embedding external pages, modifying logos, modifying menu texts, adjusting menu hierarchy structure, different navigations and different menu buttons all support configuring custom help center hyperlinks.
- Added "Recently Viewed" navigation capability, users can quickly access the corresponding functionalities through recently viewed information.
- Added "Hot," "New," "Beta," and other operational label capabilities.
- Added dual-layer navigation ceiling ability, giving users a larger workspace area.
- Add product guidance feature to provide guidance and instructions for flattened navigation functionality.
Other features and optimizations:
- 【Webhook】Enriched the enterprise messaging touch channel by configuring webhooks to send SensSage intelligent alert notifications to enterprise groups.
- 【Function Migration】The original "Data Center" (Data Access, Metadata Management, Tag Management, Data Quality) entrance and the original "Basic Settings" and "Members and Roles" entrances have been migrated to the navigation bar, renamed as "Data Management" and "Project Settings" respectively.
- 【Basic Settings】Added a common "Basic Settings" entrance for each product line and supported flexible configuration registration.
- 【Members and Roles】The style of permission configuration has been improved, enhancing the capacity for displaying information.
- 【Operation Log】Added the ability to configure whether to display the "Operation Log" in the "Personal Center", which can be configured by the customer administrator in the "Platform Settings" interface.
- 【License Package Parsing】Changed from being independently parsed by each product line to being uniformly parsed by the platform, laying the foundation for more flexible user-level operations in the future.
- 【License Notification】Unified by the new navigation, ensuring the consistency of notification style and interactive logic for each product line.
- 【A/B Testing】
- Client SDK: Supports WeChat Mini Program SDK, QuickApp SDK, Flutter SDK, and MacOS SDK.
- Server SDK: Supports Java SDK and Golang SDK.
- Supports accessing A/B testing services through the Split API.
- Random traffic filtering targets the audience users, supporting all user properties in the user table, making audience filtering more flexible.
- 【Custom Query】
- The custom query page has been completely redesigned, with significant improvements in querying and interaction methods.
- Enhanced editing box functionality, supporting SQL keyword association and formatting.
- Custom query SQL supports categorized saving, with the ability to add titles and descriptions.
- Historical queries will include title information and support searching for historical queries.
- The query result display supports selecting whether to display columns and supports downloading in Excel and CSV formats.
- Note: Due to the architecture and version upgrade of the custom query engine,a small number of incompatible syntax changes have been introduced. Refer to the specific content:Custom query
Version 2.2: Released on January 27, 2021.
Core features:
- 【Analysis Model】Added LTV Analysis: Accurately analyze average revenue per user and accurately evaluate business value.
- 支持View the trend of LTV, compare the LTV of new users for different dates, and compare LTV for multiple channels.
- Support for predicting LTV, up to a maximum of 180.
- Support for multiple analysis objects and multiple time zones.
[Channel] New ad delivery analysis: View user data from an advertising perspective and achieve end-to-end ad monitoring
- Ad delivery analysis is a paid feature that is not enabled by default. To enable it, please contact the Sensetime customer service staff.
- View ad data and user behavior data (total counts) at various levels of "Channel/Account/Plan/Group/Creative"
- Support dimension metric filtering + data trend line chart within a time range, and support comparison of any two dimension metrics.
- 【Channel】Monitoring links support OAID, unique ID, and request reporting ID: Improve attribution accuracy and efficiency of troubleshooting data differences
- 16 channel links support OAID: Ali Hui Chuan, Tencent Advertising, Baidu Advertising, NetEase Youdao, 360 Dianjing, Today's Headlines, NetEase News, NetEase Cloud Music, Zhihu, Himalaya, InMoBi, iQiyi, Xiaohongshu, Pinduoduo, Sigmob, Vivo, Oppo
- 23 channels support request ID: Ali Hui Chuan, Tencent Advertising, Today's Headlines, Baidu Advertising, NetEase Youdao, 360 Dianjing, Bilibili, Fengyu, Inmobi, Mobvista, NetEase Cloud Music, s2s, Vivo, Wolong, Sina, Zhihu, Pinduoduo, Sigmob, Vivo, Oppo, Women's Tong/Meiyou, Offerslook, WeChat Advertising
- 【New product】Support A/B testing: Support verifying strategy effects through A/B experiments to reduce iteration costs
- A/B testing is a paid feature that is not enabled by default. To enable it, please contact Sensetion customer service.
- Support programming experiments
- Support experimental groups
- Supported on Android SDK, iOS SDK, Web SDK
- Refer to the documentation for instructions on how to use the function
- 【New product】New report product release:Provide flexible BI visualization capabilities to present conclusive data reports
- New report is an advanced feature that is not enabled by default. To enable it, please contact Sensetion customer service.
- Support adding the SQL custom query and query results of event/funnel/retention analysis to the report for visualization
- Through offline calculation, achieve fast loading in the report viewing scenario, and provide manual and routine update scheduling cycles
- Flexible configuration of dimensions, metrics, and styles for visual graphics, providing more than ten types of chart and free layout capabilities
- Provide report sharing and viewing capabilities, suitable for various business scenarios such as upward data reporting, horizontal information synchronization, and downward information distribution
Other new features:
- 【Event Analysis】Divisor-based custom metrics can be grouped according to the attributes of the numerator event
- 【Financial Industry】Date selection control supports the selection of "Trade Day"
- 【Navigation Bar】SA enables SBP and SDG related entry by default and adds new user guides
- 【Overview】The funnel component supports displaying two groups
- 【Overview】Support returning from the analysis model to the position of the overview component
- 【Channel】Support user-defined "second retention" deep callback events, update Baidu Information Flow deep callback
- Seven channels support user-defined "second retention" events for deep callback: Today's Headlines, Baidu Information Flow, Tencent Advertising, Kuaishou, NetEase Youdao, 360 Advertising, WeChat Advertising
- Update Baidu Information Flow's ocpc deep callback supported event_type.
- 【Channels】Added app configuration, optimized channel navigation, and upgraded link creation to support precise matching for multiple apps.
- Added app selection for app promotion in channel links, supporting the creation of monitoring links based on apps.
- Upgraded channel navigation to channel management, advanced functions, and delivery analysis.
Version 2.1: Released on October 8, 2020.
New features:
- Complete reconstruction of event analysis model. Enhanced interactive experience for easier operation.
- New interactive experience for metric configuration.
- Supports drag-and-drop sorting of metrics and grouping by attributes.
- Supports drag-and-drop reordering of metrics.
- New interactive experience for grouping by attributes, supports drag-and-drop adjustment of attribute order.
- Supports renaming and copying of regular metrics.
- States of sampling and approximation calculations are displayed; current status is displayed on the page when sampling or approximation calculation is enabled.
- Supports metric reset, allowing one-click clearing of current configuration.
- Optimized event, property, and time selection panels.
- Supports predefined metrics in metric selection.
- Supports drag-and-drop sorting of metrics and grouping by attributes.
- Supports nested filtering and dynamic matching for segmentation.
- Supports two-level nested filtering.
- Supports dynamic date matching for segmentation (requires use in conjunction with Sensen Data user profiles).
- Supports time interval filtering for event time.
- New interactive experience for metric configuration.
- Comprehensive upgrade of alerting function.More convenient alert configuration and more powerful alerting capabilities.
- Supports grouped alerts for easier creation of alerts.
- Supports creation of up to 20 alert rules in alerts; different groups can have different alert triggering rules.
- Multiple alert rules can be created for the same metric to monitor changes from multiple perspectives.
- Supports global management of alerts, can manage alerts created by other accounts.
- "Manage" permission role can view all alerts in the project
- In the alert details, you can view the recent alarm times, metric change curves, and alarm records
- Support alarm diagnosis to quickly locate the cause of metric anomalies
- Supports reference time comparison to show the changes of attribute values corresponding to metrics during the alarm
- Can jump to event analysis to view the details of group metric changes
- Supports grouped alerts for easier creation of alerts.
- Optimized retention analysis table greatly improves the retention table experience, making it clearer and more convenient to operate
- Optimized metric configuration
- Moved the ability to group by attribute to the metric configuration area
- Supports custom selection of "N days/weeks/months" for retention
- Optimized table display
- When grouping by attribute, supports sorting the groups by retention rate
- The "Summary" row (i.e., the overall or row corresponding to attribute values) can be expanded and collapsed to view the details of each period
- Optimized tooltip information in table cells
- Optimized calculation logic for "Summary" row retention/attrition rates, the number of users is not deduplicated during calculation
- Optimized metric configuration
- Supports multiple analysis objects supports switching analysis objects for event analysis, retention analysis, distribution analysis, and funnel analysis
- For example, in funnel analysis, if you are not concerned about the conversion funnel of "users" but a funnel model of a certain product from warehousing, inventory to sales, you need to switch the object to analyze it
- This function is an advanced feature and is not enabled by default. If you need to enable it, please contact the SensData customer service
- Supports multi-timezone analysis supports analyzing and querying in different timezones for various analysis models
- Supports switching server-side timezones, with over 70 timezones available for switching
- Supports viewing data according to the client's timezone
- For more information, please refer to the documentation [here]. This feature is an advanced feature and is not enabled by default. Please contact Sensors Data customer service to enable it.
- Channel self-service and DeepLink supports multi-channel self-service configuration, deep callback event configuration, and account self-service configuration, adding overseas, WeChat ads, and other channels.
- Newly added support for integrating data from overseas attribution tools, facilitatingClients with overseas businesses advertise on platforms such as Twitter, Google, and Facebook through third-party channels.
- In total, there are 3 channels: Appsflyer、Adjust、Branch
- Add more channel docking
- In total, there are 6 channels: WeChat Ads, Pinduoduo, Meiyu, Qutoutiao, Xiaohongshu, Ximalaya.
- Add Joint Debugging Diagnostic Tool Function, providing automated diagnostic services for the entire process of joint debugging, integrating Device Whitelist,Data Dashboard, and Diagnostic Report.
- Device whitelist: Devices added to the device whitelist, whether iOS or Android, are allowed to trigger activation events unrestrictedly
- Data dashboard: After clicking on the debugging ad link and downloading and activating the debugging app, the dashboard displays real-time click events, activation events, and callback logs, making it easy to troubleshoot debugging issues
- Diagnostic report: Automatically generates debugging results, debugging failure causes, recommended measures, etc., and supports one-click export
- Added DeepLink functionality:
Wake up the app through a custom domain name (for private deployment customers)
If the customer has not installed the app or cannot open the app, they can be redirected to a specified page
The specified page has a button to wake up the app again
Supports tracking of the entire process data
- Added activation attribution window period and deep callback attribution window period interface configuration
- Newly added support for integrating data from overseas attribution tools, facilitatingClients with overseas businesses advertise on platforms such as Twitter, Google, and Facebook through third-party channels.
- The user behavior sequence interface has been fully upgraded to optimize event and property information browsing and filtering, making it easier to view user continuous behaviors
- Check whether virtual events are supported to view meta event or virtual event information
- Supports setting up to three properties to be displayed by default in the event information bar for quick browsing of user detailed behaviors
- Support filtering similar events. When browsing event details, you can quickly filter out similar interference events to view core operation events more clearly.
Other features and optimizations:
- Overview
- Added "Download" report button to Event/Funnel/Retention/Distribution/Interval/User Attributes analysis components.
- After saving a funnel to the overview, you can view the curve of conversion rate for each step over time.
- Distribution analysis can be saved as a table in the overview.
- Analysis
- Added "Tags" category label to user attributes in the filter conditions of the analysis model, optimizing the user attribute filtering experience.
- Metadata
- Boolean type user/event attributes support adding dimension dictionaries to solve the inaccurate display issue of boolean attributes.
- Channels
- Support configuring OCPC deep behavior feedback in the interface.A total of 7 channels are supported: TikTok/Douyin, Baidu Information Flow, Tencent Ad, Kuaishou, Netease Youdao, WeChat Ads, 360.
- Support configuring accounts in the interface without the need for operational configuration.A total of 10 channels are supported: Weibo Fan Pass, Baidu Information Flow, Tencent Ad, Sina, WiFi Universal Key, S2S, InMobi, Women's Tong/Meiyou, Pinduoduo, WeChat Ads.
- Performance optimization
- Front-end resource packages support on-demand loading to improve page loading speed.
2.0: Released on May 19th, 2020.
Happy 5th anniversary of the establishment of Sensors Data!
New features:
- Event analysis visualization upgrade,Redesigned the information structure of visualization, providing easy-to-read and exploratory visualization for each type of metric scenario.:
- Refactored the visualization graphics and made a series of improvements to visual and operational experience.
- Supports dynamic querying of the top N items and dynamically saving them to the overview for effective analysis of top data.
- Support fast filtering after grouping, improve efficiency, no need to query again and wait;
- Support hierarchical query and exploration of multiple groups, view by level;
- Support highlighting the same group, comparing indicators by time, comparing data in one step;
- Support proportionally viewing indicator trends in bar charts in group scenarios;
- Optimize the analysis of multiple indicators, break the limit of the number of multiple indicators (support more than 3 indicators), and add views optimized for multiple indicators in tables;
- Solve the problem of no display of total values, group data and overall data are clear at a glance;
- The new visualized full-link includes App visualized full-link and Web visualized full-link:
- The App visualized full-link function provides the ability to define events through synchronized screens on computers and mobile phones. The specific functions are as follows:
- Define various types of controls and support filtering based on their positions and contents in Listview;
- Convenient operation on the computer side, the dynamic display of the current definition of the elements on the right side;
- Support multiple devices: mobile phones, tablets, and their corresponding vertical and horizontal screens;
- SDK version requirements:
- The Web visualized full-link function provides the ability to visually define events. The specific functions are as follows:
- Define various types of controls, including hyperlinks, multi-line text boxes, input boxes, and buttons;
- Define pages and page groups, and support the design of page groups based on domain names, paths, and query parameters;
- Support multiple devices: mobile phones, tablets, and their corresponding vertical and horizontal screens;
- SDK version requirements:
- Javascript SDK: v1.15.10 and above;
- The App visualized full-link function provides the ability to define events through synchronized screens on computers and mobile phones. The specific functions are as follows:
- Engine upgrade to 2.0, improving query performance by optimizing storage, query execution, and scheduling in all scenarios
- Storage optimization
- Refactoring the storage solution for event data;
- Optimizing scheduling strategy, dynamically executing fragment file merging;
- Optimizing compression algorithms, reducing CPU resource usage by several times;
- Query execution optimization
- Optimizing queries based on user behavior sequences;
- Optimizing Impala's code generation (Codegen) technology;
- Optimizing join expression pushdown and pre-evaluation;
- Query scheduling optimization
- Building a query resource estimation model to accurately estimate resource consumption;
- Adding asynchronous query capability to support asynchronous background calculation of super large result sets;
- Storage optimization
- Alerts
- Supporting alerting for predicted values, alerting on abnormal metrics that deviate from historical trends;
- When editing alerts, supporting the sending of test emails;
- Supporting viewing alert details and notification details;
- Supporting "middle version upgrade", making the upgrade process faster and smoother
- The middle version upgrade method can greatly reduce the upgrade time, reduce the risk of failure during the upgrade process, significantly reduce the service interruption time during the upgrade, and achieve zero impact on data import for most upgrades;
- Adding multiple product switching entry points, integrating the navigation of all products in Sensory Convenience Store
- Classifying and redesigning exception messages, greatly reducing non-critical error messages and reducing distractions during use
Other Features and Optimizations:
- Overview:
- Support displaying the top N data results.
- Support custom configuration to show totals, averages, and month-on-month or year-on-year information.
- Support comparing multiple metrics with a pie chart when they are not grouped (up to 6 metrics).
- Expand the query conditions to include dimension dictionaries for attributes.Support operators such as equal to, not equal to, contains, does not contain, has value, does not have value, is empty, is not empty, regex match, and regex not match.
- When creating an overview, the default time is set to dynamic time.
- Reconstruct the calculation rules for month-on-month and year-on-year comparisons, making the calculations more accurate and configurable, and improving efficiency.
- When the event name is too long, it will be abbreviated in the overview and displayed in full when hovering.
- When entering the user behavior path analysis and attribution analysis from the overview, the calculated results will be displayed directly without the need to click "query".
- License
- Support accessing the Sensing License service to purchase licenses according to functional modules.
- Support reminder for license expiration;
- Retention analysis;
- When viewing by groups, support sorting by group name;
- "Show at the same time" supports displaying the cumulative sum and average value of number type properties (typical application: calculating LTV of retained users);
- When viewing by groups, support weighted calculation of group retention rate;
- User filtering conditions distinguish between user properties and segment additions;
- Funnel analysis;
- Support adding up to 64 steps;
- The display granularity of funnel conversion median is accurate to seconds;
- The comparison setting of the funnel supports fuzzy matching filtering of groups;
- User behavior;
- In the user list after filtering, when viewing the user behavior sequence, accurately mark the user behavior events at that time;
- In the user list, support downloading user lists by splitting files according to user properties;
- Data Management:
- Support using both event table and user table properties to generate virtual properties;
- Support creating virtual properties using events.time; add the List type, and the data type can be selected when creating and editing on the new and edit pages;
- Support batch modification of event information, support sorting events by the number of recently merged records and receiving status;
- For event properties, user properties, and virtual properties that do not support the use of dimension dictionaries, add prompts;
- In the event tracking management, provide a separate pop-up window when displaying JSON to optimize the user experience;
- Permission and member management;
- When creating/modifying roles, support using virtual properties as conditions for filtering data permissions;
- Add permissions configuration for creating, managing, and authorizing assignable roles;
- Add the function to deactivate accounts, and prompt the account status after login;
- User search function supports searching user attribute display name.
- Support batch account creation and editing;
- Support inviting platform members to enter projects in batches by uploading Excel;
- Support creating temporary accounts;
Support hiding all features in SensEasy that can identify users' unique identities, including hiding user lists and downloading user lists, and hiding user unique identity properties in filtering and viewing by groups;
- Permission support settings overview, supporting viewing only the overview shared by oneself and Admin;
- Others
- Provide friendly compatibility tips for incompatible browser versions;
- Support custom path addition in forwarding configuration;
1.17: Released on March 10, 2020
Update list:
- New features
- Added "Schema Strict Validation" data storage mode, which solves the problem of incorrect data storage of reported events from the source. After updating the events that need to be reported to the project, strict validation of data storage is performed according to the settings.
- Support custom format rules for "Device ID" and "Login ID" user information;
- Support downloading configuration files of existing events, event properties, and user properties in the current project;
- Support batch updating of meta-event related information;
- Support batch renaming of event properties and user properties display names;
- Support online collaborative creation and management of meta-events, event properties, and user properties;
- Support "Stop Storage" operation for the entire unused event (Extractor does not import, Nginx receives normally);
- The following features are added to the overview:
- Support global filtering of overviews using user properties and event properties;
- Support full-screen mode with the option to set scheduled refresh;
- Support adding bookmarks saved from path analysis and interval analysis to the overview;
- Support funnel display by trend;
- Support retention display in tables;
- Extension of Permission and Member Management:
- Support multi-role authorization for members;
- Support specifying encrypted event properties and user properties within a role;
- Customize authorization to create virtual events and manage all virtual events;
- Support one-click download of member account information and role configuration for authorization review;
- >Upgrade of Event Analysis Table (released in the small version on March 27)::
- When drilling down in multiple dimensions, support aggregation display according to the hierarchy of dimensions, break down metrics in a more structured way, and meet most scenarios of multidimensional grouping; also support switching to the old version's flat display;
- In the table displayed by hierarchy, new metrics such as "Other", "Subtotal", and "Total" are added;
- Support exporting Excel tables with built-in pivot tables; optimize data format for easier secondary data processing;
- The table supports filtering function and also supports viewing slice data for each day (minute, hour, day, month);
- Optimize the display of multiple metrics and comparisons;
- New Features for User Segmentation:
- Added prompt for using historical versions of segments in the analysis model;
- Support automatic calculation of user segmentation based on stored data;
- Support custom division and configuration of user segmentation for specified resource pools and time periods;
- Support selecting historical segment users in event analysis [only available for customers who have purchased SensData's user profile];
- For each analysis model, users can choose whether to use asynchronous query (manually add to the query queue, wait in line for calculation results);
- In path analysis, selecting events to be included in the analysis can include virtual events, and the results will be based on virtual events and support one-click download of user path analysis result graph;
- Support creating and managing virtual properties in the interface, and the virtual properties of string and numeric types support adding dictionaries;
- Entity types (dimension tables) can be viewed in metadata management;
- In the channel management, when generating "WeChat Mini Program Universal Channel Links", it supports generating the corresponding "Mini Program Codes" at the same time;
- Add "Notification Assistant", which automatically notifies when the overview changes, when a query task is forced to pause, when a queued query task is completed, and when the exported data file is generated;
- Support viewing the operation logs and usage statistics of members in the current project in the system;
- Added "Schema Strict Validation" data storage mode, which solves the problem of incorrect data storage of reported events from the source. After updating the events that need to be reported to the project, strict validation of data storage is performed according to the settings.
- Optimize
- Optimize query performance and significantly improve query speed;
- Upgrade the interaction experience of user lists and event grouping;
- Sharing settings and copy operations in the overview have been moved to the more operations in the upper right corner of the overview; add a prompt for missing events and attribute errors in the overview;
- In event tracking management, improve the readability of error data reasons, support filtering sources and application versions in real-time import and Debug import data;
- Support asynchronous export of data files to ensure stable generation of large data files;
- Support custom enterprise logo and customizable bottom information after logging into the system;
- Support custom configuration related to security:
- Forcibly change the initial password when the user first logs in;
- Verify the old password when changing the password, and it should be different from the previous password;
- User passwords should be changed regularly, and the change period should not exceed 90 days;
- The timeout for automatically logging out of the web interface can be configured;
- Important changes
- OAuth login can be configured to use platform accounts (version 1.15 and above support);
- When the old version is upgraded to 1.17, if you need to use the "Schema strong check" data entry mode, please contact the Sensors Service students to enable it. After the function is enabled, data is reported according to predefined rules. Incorrect data is not allowed to be stored in the database. You can decide whether to retain it based on the history supertoken,Can be closed if not needed;
- Impala was upgraded from version 2.12 to 3.2 with a few incompatible syntax changes, alias replacement logic in GROUP BY, HAVING, and ORDER BY is more consistent with standard SQL behavior, and a new set of reserved fields is added.View details.
1.16: Released November 21, 2019
Update List:
New Features
In the overview, the function group Public Overview is added to establish a public space for enterprise data dashboards, supporting multiple authorized members to manage together.
- The Public Overview fully supports operations such as copying, sorting, grouping, and sharing settings.
- The original "Pre-set Overview" is renamed as "Basic Data Overview".
- Member's ability to view the Public Overview function group can be supported through role permissions.
- Supports flexible authorization of roles, positions, and individual members for overviews created independently in the Public Overview (to use position authorization, corresponding positions need to be created in "Member Management" - "Position Management").
In the "My Overviews" module, users can quickly copy existing overviews to the "Public Overview" or save them to "My Overviews" to facilitate the migration of existing overviews to the "Public Overview".
Add multiple sets of descriptions in the "Single Overview" module, and drag to sort; for overviews that are not used for a long time but need to retain the last analysis results, "Stop Updating" can be used to suspend the automatic calculation of this overview to ensure the effective release of computing resources.
Add the Scene Library function group, where Sensors combines the analysis methods based on business scenarios with the "Public Overview", allowing customers to quickly perform business analysis based on the required data and the data interpretation methods in the Scene Library.
- Support downloading the corresponding "Event Design" in the scene to provide customers with fast event design solutions.
- Supports online custom matching of corresponding events to quickly apply existing events.
Flexible permission configurations are fully implemented for members and roles, and all functional modules.
- Add "Position Management" in member management, where overviews can dynamically authorize members with specified positions to view.
- Support more granular authorization configurations:
- Overview: authorization for "Viewing Public Overview", "Managing Public Overview", "Managing My Overviews".
- Funnels: authorization for "Using Funnels", "Managing Funnels".
- Suuport authorization for "Analysis", "Metadata Management", "Alert Management", "Channel Management", "Members and Roles" respectively.
To ensure project security, stability, and data accuracy, we have added "Download Resource Usage Report", "Platform Security Settings", and "Data Validation" functions in "Basic Settings".
- Admin account can download the "Resource Usage Report", which fully displays the detailed functional modules, event reporting, and user usage in the current project.
- Admin account can configure "Platform Security Settings", including whether to enable captcha verification for login accounts, and login attempt limit.
- Members with permission to use "Data Validation" can upload existing "Event Design Schemes" and the system automatically compares them with the data in the library to verify data quality.
The "Session Management" in metadata adds event definitions for "Start" and "Exit" events.
Important change
- If an upgraded customer is already using the "Predefined Dashboards" and needs to use the English version, please delete the existing "Predefined Dashboards" and add the "Basic Analysis Dashboard" from the Scenes Library to use it normally.
1.15: Released on July 15, 2019.
Update List:
New Features
The "Predefined Dashboards" module in Dashboards
- Adds configuration entry for new events such as user activity in the predefined dashboards.
- The predefined dashboards are set to track all events by default, but can also be adjusted to track other existing events for better alignment with business needs.
- Adds a user lifecycle overview that visually shows user composition (new users, active users, returning users, inactive users, churned users, churn rate) and supports custom configuration adjustment.
The "My Dashboards" module in Dashboards
- Adds copy dashboard function
- In the "Manage My Dashboards" function, supports adding multiple accessible members to dashboards simultaneously; supports batch resetting of dashboard access members; supports batch stopping of shared dashboards.
- In the dashboard sorting function, supports moving multiple dashboards to specified dashboard groups in batches;
- Adds hidden dashboard groups, by default hidden dashboard groups are collapsed, and rarely viewed dashboards can be moved to hidden dashboards.
In the Members and Roles module
- Account management and role permissions are integrated into the "Members and Roles" module
- Adds "Platform Account" as a new account type
- When an enterprise has multiple projects, there is no need to create duplicate accounts anymore;
- Each project supports the creation of "platform accounts", and members of platform accounts can have different roles and permissions in different projects;
- Each project supports the "invitation of platform account members". After being invited, platform account members can log in to the project and perform data analysis.
- In member management, the "transfer work" function is added. When the work of a member changes, all bookmarks and overviews created by this member can be transferred with one click.
- Optimized role management authorization methods
- In the authorization of "available events," the event "authorize by tag dynamically" is added
- Optimized permissions for "available event attributes". In the analysis model, unauthorized attributes cannot be used for filtering and grouping; unauthorized information is not displayed in the user behavior sequence details page.
- Optimized permissions for "available user attributes" and "available user groups". In the analysis model, unauthorized attributes cannot be used for filtering and grouping; unauthorized information is not displayed in the user list and details page.
- Added "basic settings" module
- Support changing project name
- Support viewing project quotas, used quotas, memory, expiration date, and other basic information
- Support functions like updating authorization, online upgrade, recharging project, data access, push management, and viewing API secret.
- Added "personal center"
- Support viewing personal account name, phone number, login account, role, email, and other basic information;
- Can view the details of data permissions, data analysis permissions, etc. When unable to view specific data, can check personal center to see if there are permissions.
- Added function url_decode in the custom query
Optimized
- The system structure navigation bar
- Optimized the left navigation bar to top navigation, making the structure clearer.
- The navigation includes: Overview, Analysis, Bookmarks, User Segments, User Tags, Metadata, Event Management, Basic Settings, Channel Management, Alert Management, Members and Roles modules.
- Support displaying modules that can be viewed based on the roles' permissions.
- Bookmark management added
- Bookmarks are added as a separate module and added to the top navigation.
- Support viewing which dashboards the bookmark has been added to.
- Support viewing the analysis model type of the bookmark.
- Support bookmark management, including editing and deleting.
- The system structure navigation bar
Important change
- Customers who need to use the language switch are recommended to use version 1.14.
- Customers who use the LDAP special SSO service because of supporting "platform accounts", please confirm with your Customer Success Manager in advance if there are any abnormalities after the upgrade.
1.14: Released on April 29, 2019
Update list:
New features
- Introduce attribution analysis analysis model
- By reconstructing the behavior of users in the product over time, explore the relationship between "touchpoints" and "target events".
- Analyze the contribution of multiple "touchpoints" to "target events" and display the contribution brought by each "touchpoint" through visual graphics.
- Support multiple attribution models, including: first touch attribution, last touch attribution, linear attribution, position attribution, and time decay attribution.
- View details
- Introduce the brand new permission system
- Support custom user roles and assign corresponding login accounts to the roles.
- User roles support custom configuration of "data resource permissions" and "function module usage permissions".
- View details
- Launch the visualized full tracking feature
- Synchronize the app interface with the Sensors Analytics web page and identify elements in the app
- Click on each element and "rename" it on the interface. In the analysis model, use this event for analysis
- iOS requires SDK version v1.11.0+ and Android requires SDK version v3.1.0+
- View details
- Further upgraded and optimized the Data Model, which is upgraded from the original Event-User model to the Event-Item-User model. You can now use the Item table as a supplement to the variable properties of the Event event. For more information, please refer to the Item Entity;
- Now it is easy to archive cold data to save storage space while preserving data assets;
- Introduce attribution analysis analysis model
Optimization
- The single-instance data cleaning tool (sa_clean) now supports deleting data in the Event and Profile tables based on the user ID (user_id / distinct_id);
- Now it supports adding multiple preprocessing modules (ExtProcesser) with different logics at the same time;
- The cluster version of the data cleaning tool (sa_clean) optimizes the delete logic based on conditions such as Event, Lib, and supports deleting data in the cache;
- Improved the availability and efficiency of the data migration tool.
Important Changes
- Changes to the segment API interface, not backward compatible
Segment API Changes to segment calculation rules
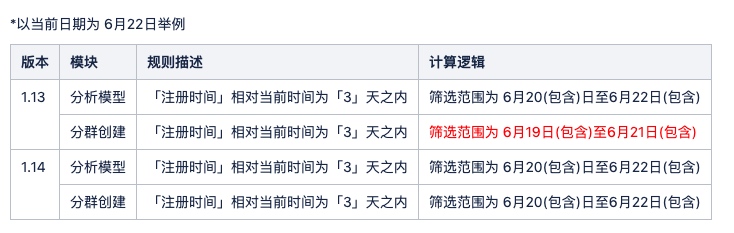
- Group table structure adjustment
- The base_time field has been added to the user segmentation table
Adjusted the naming rules for segmentation/tags
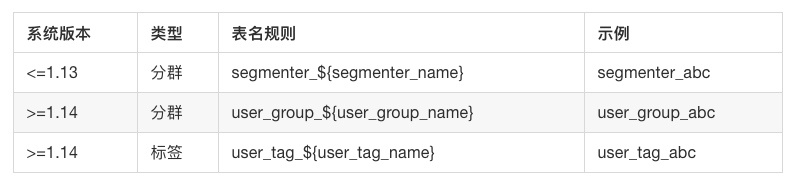
- Changes to the segment API interface, not backward compatible
New feature
Introduced the User Tag System, for more details please consult with the Sensory Data staff
1.13: Released on November 19, 2018
Update list:
- New Features
- Supports associating multiple devices with one user, greatly enhancing user association capabilities;
- Released Sensory Analysis mobile Sensory Essential Analysis 1.0 version
- Aimed at management, providing better data interpretation;
- Provides daily "strategy reports" by subscribing to overviews, automatically mining abnormal data, and sending them to mobile devices in the form of daily reports;
- View data overviews anytime and anywhere;
- Redesigned and implemented the user segmentation module;
- Over 20 times improvement in computing performance;
- Redesigned the UI for user segmentation, making it easier to manage segments;
- Can better help track the lifecycle changes of different segments. Each calculation of routine segmentation has a history record and supports recalculation of historical results;
- Supports creating segments by uploading user IDs;
- Supports copying segments;
- Enhanced the description capability of segmentation rules;
- Provided a more convenient channel management that allows for unified management, tracking, and analysis of promotional effects in the Sensen Analytics platform;
- Supported the creation and management of channel tracking links in the product;
- Supported more channels, with continuous additions;
- Supported the creation and analysis of promotional campaigns;
- Provided automatically generated preset overviews
- Administrators can create a series of scenario-based preset overviews, which generate data metrics that are important for the user lifecycle process, including: overall summary, user acquisition, activity and retention, event conversion, user attributes, and other modules;
- Launched the Customer Service Center, which provides a platform for submitting service feedback and issues. It supports users to submit tickets to track issues conveniently;
- Fully supported GDPR;
- Important changes
- The preset property
event_durationhas been renamed to$event_durationand is not compatible with previous versions. If the field is used in the Query API, SQL, or data subscription from Kafka, the field name needs to be changed; - There are incompatible changes to the Segment API.
- The preset property
1.12: Released on August 4, 2018
Update list:
- New features:
- Added the ability to compare channels in overviews, supporting the comparison of metrics such as traffic, new customer ratio, retention, and event conversion for multiple channels to quickly identify high-quality channels;
- Performance settings can be applied to each overview, including calculation precision, data update time, and sampling coefficient, improving the query experience for overviews;
- Quick project switching after login;
- Download the complete data for event analysis in the user interface;
- The dimension dictionary supports many-to-one mapping. Custom many-to-one mapping of attribute values can be uploaded for existing event and user attributes;
- Supports new attribute type - List, used to save an ordered string sequence. The original LIST type is renamed SET type; if you need to create SET type, you need to create it with attribute creation tool and then pass it in;
- Provides data validation tool to optimize the efficiency of data format checking;
- WeChat Mini Program SDK has been updated to support sharing monitoring, which can analyze the number of shares, levels, and pages;
- Added Alipay Mini Program SDK;
- Optimization:
- Optimized the experience of navigation;
- The event analysis component in the overview supports displaying the top three values of single metric groups, and the retention analysis component adds a retention trend chart with dates as the horizontal axis;
- Adds Day 0 to retention analysis to analyze the "coexisting users" who performed the initial and subsequent actions on Day 0;
- The refresh operation is adjusted to click the button to refresh the overview or the analysis page's invalid data, press and hold Shift⇧ and click to refresh all data;
- Optimized the format of exporting retention to CSV;
- When the query exceeds a certain time, the progress of the query, current query load, and other information are displayed. You can also enable sampling or approximate queries;
1.11: Released on March 25, 2018
Update list:
New features:
- Enhanced analysis model: added Interval Analysis model, which can analyze the distribution and trend of time intervals between any two events to optimize the conversion efficiency between key events. For example, analyze the distribution of time intervals from the first investment to re-investment and the distribution of time intervals from registration to payment conversion;
- Restructured Data Overview: Upgraded the information architecture, process, and visualization capabilities of Data Overview. It supports multiple-sized charts, multi-metric tables, custom time filters, and many other features, greatly enhancing the extensibility and flexibility of the overview;
- Restructured Event Tracking Management: Significantly optimized the performance of event tracking management; unified the time interval as data receiving time to reduce misunderstandings;
- Data Access: Supports the ability to use dimension tables and attribute extensions to extend already accessed events and attributes using third-party dimension tables, greatly enhancing the ability to handle complex business requirements;
- Easier Data Viewing: Can search for users, search user IDs, attribute values, and directly view specific user lists and user behavior sequences;
- Enhanced Analysis Ability: In event analysis, you can add attribute filtering conditions to each sub-item in custom metrics;
- 【Channel Management】You can upload CSV or XLS files to batch generate UTM links and short links;
- 【Enhanced Analytics】Properties of LIST type can be counted by "items within the list";
- 【Dynamic Data Type】With the assistance of Sensors Data Technical Support, you can modify the attribute types;
- 【Simplified Data Types】DATE type is canceled and treated as one of the formats of DATETIME;
- Provided the ability of online upgrade;
- Indicator alerts can set monitoring time periods and ranges;
- New addition of monitoring history query. In the diagnostic tool, "Monitoring History Query" can be accessed. The cluster version is enabled by default, and the standalone version needs to determine whether it can be enabled based on the configuration;
Optimization
- 【Web Clicks Analysis】The results of web heat map analysis can generate QR codes and links for easy sharing;
- 【Funnels Analysis】Optimized the calculation capability of the funnel's time window, the default time window is within the same day;
- 【App Clicks Analysis】Continuously optimize the system compatibility of the App Clicks Analysis function;
- The trigger count in the table can directly view the user list or quickly save it as a user segment to reduce operating costs;
- 【Virtual Event Management】Virtual events support batch addition and event exclusion;
- 【Data Download】Optimized the data download method, you can download the displayed data in the table or the source table data separately.
- The charts (components) in the overview and the left navigation support opening in a new window. Right-click to open in a new tab, or hold down Command ⌘ or Ctrl and click the link;
- Optimized the downloaded file name;
- In event analysis, the event dropdown menu supports searching by pinyin and original event names (supports original and virtual events);
- Optimized the dragging of components in the overview;
1.10: Released on November 15, 2017
Update list:
New Features
- Add APP Click analysismodule, you can analyze the user behavior of the APP in a visual way;
- Upgrade Clicks Analysis to Web Clicks Analysis, add Reach Rate Analysis graph, and analyze the depth of user engagement on web pages; optimize the toolbar;
- Refactor the drop-down menu for event selection, support personalized event subcategories, reordering, and hiding, organize events and metrics based on business lines, product structures, etc., making it easier to manage the structure of events and metrics;
- In Metadata Management, batch add tags to (virtual) events, change display status, conveniently name and display events, and optimize sorting, pagination, and other experiences to better manage events;
- In Metadata Management, events can now be annotated;
- Data Overview Navigation supports subcategories, making it easier to organize the structure of the overviews;
Optimization;
- Can contact Sensors Analytics Technical Support to enable the "Create Virtual Event", "Create User Segment", and "Create Session" permissions for the Analyst role group;
- Greatly optimized query performance when using user attributes in multiple analysis functions;
- Funnel, Virtual Event, Session and User Segment now display creation information (creator, creation time, and modification time);
- Optimized the time format for downloading CSV;
- Strong optimization of multiple functions of the click map (such as multi-layer nesting in a link, custom collection of input elements, custom collection of automatically collected elements, map/area collection support, optimization selector, and other functions);
- Optimization for Channel Source, manual $pageview sending on single page, and other minor feature improvements;
Compatibility Changes;
- HdfsImporter import tool is no longer compatible with direct use of the hadoop jar command;
1.9: Released on August 19, 2017;
Update List:
- New Features:
- Ability to set alerts for key metrics. When a metric reaches a certain absolute or relative value, triggers a notification to the responsible person. Supports real-time monitoring at the hour and day level;
- Enhanced the comparison capability of event analysis, allowing any metric to be added with any filter condition, and comparing different dimension metrics of the same event;
- Enhanced the analysis capability of retention analysis, in addition to counting the number of retained users, it can also calculate more metrics such as total consumption amount, average consumption per user, total duration of stay, etc., and export the corresponding CSV format;
- When editing a funnel, it can be saved as a new funnel, supporting quick duplication of funnels;
- Now you can integrate with AppsFlyer, making channel tracking support for thousands of domestic and international channels;
- Optimization:
- When there are too many grouping values in event analysis, there will be friendly reminders to accurately describe the data situation;
- When there is a delay in data import, there will be friendly reminders to facilitate timely understanding of data delay;
- When there is an exception on the page, there will be more detailed error information, making it easier for users to provide problem location information to Sensing Technology Support, improving the efficiency of problem location;
- There will be friendly reminders after the version is successfully updated;
- Added a "Go back" button in click analysis to go back to the previous page without using the browser back button;
- The data refresh button in click analysis is draggable to solve the problem of data coverage;
- Added the number of steps before the funnel steps;
- Optimized the design of table pagination navigation;
- Added description for "User ID" in real-time data import;
- Optimized the experience of test sending overview emails;
- Optimized some interfaces of user behavior sequences.
1.8: Released on July 21, 2017
Update list:
- New features:
- The architecture of the private deployment standalone version has been completely restructured, laying the foundation for seamless expansion to a cluster version in the future;
- The compatibility of the full-link tracking function for iOS and Android has been greatly improved, providing better support for custom controls, Fragments, RN frameworks, etc.
- The product now has an English interface.
- Now you can configure overview settings through email.
- When bucketing time-type properties, you have more options. You can not only choose minutes, quarters, etc., but also choose to bucket based on time periods.
- When viewing the funnel analysis by group, you can expand the group in the table to view it by date and step.
- The local cache of the iOS and Android SDKs now uses ContentProvider, effectively handling the issue of multi-process access.
- The SDK in the client has greatly enhanced the capability of integrating H5 with the app in hybrid development mode.
- Now you can enable the server to determine whether a user ID is a new user.
- When creating a funnel, you can now select the associated properties between the previous and next steps.
- Now you can track the effects of distribution through Guangdiantong.
- Now you can provide short link support when creating channel tracking links.
- Now you can display cumulative charts for some cumulative metrics.
- When the JS SDK collects traffic, there are fields to distinguish the traffic source types: paid advertising traffic, organic search traffic, social website traffic, referral traffic, and direct traffic. For paid advertising traffic and some analyzable search traffic, the search keywords will also be recorded.
- For metrics like triggered users and average frequency per user, now there is a faster non-precise estimation algorithm available.
- Now various client SDKs have added CRC checksums to effectively identify data errors during network transmission.
- Optimization:
- Optimized the import speed of HDFSImporter for importing daily data.
- Optimized the login experience for multiple projects.
- Optimized query efficiency for multiple metrics and subtotals.
- Now you can download and view dimension dictionaries.
- The editing experience for situations with many virtual events has been optimized;
- The experience of enlarging and reducing the browser window has been optimized;
- The JS SDK can now customize the tracking information and manage it in the event tracking;
- A better distinction can be made between events, users, and sessions in grouping and filtering;
- The content of the downloaded query result table has been optimized;
- The funnel analysis has been optimized for trend viewing and table readability during comparison;
- On the interface for viewing real-time imported data, global formatting is now available;
- Many optimizations have been made in visualization, including changing pie charts to donut charts, adjusting the ratio of line graphs and bar graphs, etc;
- The click map experience has been greatly optimized;
- Accounts with analysis permissions can now view metadata.
1.7: Released on March 30, 2017
Update List:
- New Features:
- iOS, Android, and JS SDK have further strengthened the Autotrack feature, which can now automatically collect the interactive behaviors of various elements on the page;
- Added click analysis function for web pages;
- The funnel analysis function has been redesigned. For example, you can now query the conversion rate change curve by date, compare the funnel conversion under two different grouping values, filter and group event properties based on actual conversions, set a conversion ID as a condition for conversions in multiple steps before and after the funnel conversion, etc;
- Now you can send the content of the data overview to a designated email address. Currently, it needs to be configured through a tool in the background;
- The permission system has been reorganized, for example, analysts can share their overviews and view event and property metadata;
- When filtering time and date type properties, you can now set relative relationships with the event occurrence time;
- When analyzing data, there is now a prompt for data timeliness. Hovering the mouse over the force refresh button will provide the corresponding prompt to help users better interpret the analysis results;
- Channel Link Generation Tool can now generate links in bulk;
- Optimizations:
- Optimized the caching strategy of Data Overview to improve the experience of viewing Data Overview;
- Optimized the strategy for identifying new users to avoid recognition errors caused by users uninstalling and reinstalling the app;
- Significantly optimized the timeliness of Profile import in Cluster version;
- Lifted the restriction on the initial date for Retention Analysis;
- Redefinition of lost users in Retention Analysis. Now, users are considered lost only if they have not performed any subsequent events for multiple "days";
- Optimized the User Segmentation function, allowing the addition of conditions for users who "have not done" certain actions, and also supported User Segmentation based only on user attributes;
- When there is a bookmark, the title displayed in the analysis feature is based on the bookmark name;
- The order of Overviews can now be globally adjusted;
- Optimized the copy and paste experience of the filter box;
- Now, the Android, iOS, and JS SDKs will use pop-ups to prompt errors in Debug mode;
- The Android and iOS SDKs now collect the device ID as a property by default;
- Optimized the inconsistency issue between total and non-total groups when grouping is applied;
- In the Events Analysis feature, when there are multiple metrics, further settings can be made for the correlation between the two axes and the line graph;
- Improved the performance of the event selection drop-down boxes in each module to avoid lag when there are too many events;
- Session creation now supports granularity down to seconds;
- Support for using the system in browser privacy mode;
- The dimension columns on the left side of the table are now fixed;
- Push function has added support for third-party push services;
- A widget with multiple metrics in the data overview can now be clicked on to view details;
- The end date can now be extended in the funnel analysis and retention analysis;
- The copy and line chart of the retention analysis have been optimized;
- Bookmarks can now be added to the user path analysis to save query conditions;
- The parsing strategy for UserAgent has been optimized to be compatible with more mobile models;
- The naming process of user segments has been optimized;
- API compatibility changes:
- Due to the overall reconstruction of the funnel analysis function, the API has also been modified and is not compatible with previous versions. Please refer to the new protocol in the API documentation.
1.6.5: Released on December 20, 2016
Update list:
- New features:
- In the event management, a new import-real-time-view interface is added to the event management to view the data being accessed in real-time;
- The event management now provides tag management function, making it more convenient to manage and query events;
- In the user path analysis, the initial and ending events are analyzed according to the grouping conditions of the events;
- In the user path analysis, detailed information of specific user groups can now be viewed;
- Integration with JPush can now be done completely on the visualization interface, making it easier for non-technical personnel to send messages;
- Further improvement of channel tracking solutions for iOS and Android for various application scenarios, such as adding tracking for the "Today's Headlines" delivery channel;
- The JS SDK can now collect clicks for all elements by default;
- Implemented the OAuth2.0 protocol to support users using third-party account systems to login to the system and control permissions;
- The iOS and Android SDKs now support the APICloud development framework;
- Open the Data Preprocessing module, customers can write their own code to further process data in the ETL stage;
- A tool called schema_tools has been specifically provided to add event and property definitions in the background;
- Cluster version customers can now query data directly from the system using JDBC;
- In retention analysis, not only can retained users be viewed, but also churned users;
- A C# SDK is provided, supporting LoggingConsumer, which can log data to files on the server side and then send them to the system using LogAgent;
- Optimizations:
- The table display of behavioral event analysis results has been redesigned. However, for the convenience of old customers, the option to switch back to the old style is also retained;
- The presentation style of the User Behavior Sequence page has been redesigned, speeding up query speed and making it easier to select by day;
- The scenario data overview function has been optimized. For new customers, when using our client SDK's default collection function, the corresponding data overview will be automatically added for the customer;
- In event analysis, when selecting the time granularity of minutes and hours, the time control can also select hours;
- To reduce the difficulty for customers using track_signup, a dedicated login interface is provided to simplify the usage scenario;
- HDFSImporter now supports data compressed with gzip;
- When querying, if the query fails due to hidden events, there will be a more friendly error prompt;
- Further optimization of the prediction module, improving the stability of task execution;
- The funnel dropdown list has added a search box, making it convenient to quickly select the corresponding funnel when there are many funnels;
- Now the "About" section will display more detailed version information;
- The opening speed of "Event Tracking" has been optimized, and "Event Tracking" also provides APIs for integration with customer systems;
- When using properties from dimension dictionaries, "is empty" and "is not empty" are now supported during filtering, and empty values can also be defined in the dimension dictionaries;
- When directly accessing the data access URL from a browser, there will be a more friendly prompt.
1.6: released on September 25, 2016
Celebrating the one-year anniversary of the release of Sensors Analytics 1.0.
Update List:
- New Features:
- Added the User List function, which allows users to view the distribution of user profiles through grouping and filtering;
- Added the User Path Analysis function, which analyzes the characteristics of the overall or specific user group's access path;
- Added the Session Analysis function, which provides a series of session-level metrics and dimensions to meet the needs of users in session analysis;
- Added the Scenario Data Overview function, which allows easy importation of a series of pre-customized data overview templates;
- Upgraded Return Visit Analysis to Distribution Analysis, which not only analyzes the distribution of user groups based on the "number of occurrences," "number of hours," and "number of days" of events, but also allows analysis based on any metric;
- In user segmentation, added predictive functionality to predict the probability of user churn or completion of a specific event;
- Data Overview can now adjust the overall time range, while retaining the ability to adjust the time for individual widgets;
- The Android and iOS SDKs now collect default events such as "App Launch," "App Background Entry," and "App Page Entry";
- Provided a dedicated visual interface for automatically generating JS SDK initialization code;
- The import token permissions have been divided, with Normal Token allowing data import but not the creation of events, properties, and other metadata, while Super Token allows both data import and the creation of related metadata.
- Optimizations:
- The SDK has added a series of new interfaces for exchanging distinct_id and other information between iOS or Android Apps and embedded H5 pages in hybrid development mode;
- Improved the parsing of UserAgent and now detects spiders based on UserAgent;
- For string type filters, support for "is null" and "is not null" has been added;
- When collecting the default "Page View" event with the JS SDK, the collection of the "Most Recent Off-site Referrer" is included to analyze user sources from this perspective;
- LogAgent is now compatible with Windows servers;
- LogAgent supports passing parameters through configuration files;
- Adjusted the interface layout of metadata management;
- Now you can upload dimension dictionaries through the visual interface;
- Optimized the design of the time control;
- Optimized the query speed of funnels;
- Optimized the query speed of user behavior sequences;
- Optimized the cache policy of data overview.
1.5: Released on June 30, 2016
Update list:
- New functions:
- Sensors Analytics supports multiple projects now, with complete isolation between permissions and data, and no interference with each other;
- Added a unified event tracking management function, which allows you to view the data import status and corresponding error logs of each event point under each platform, event, and version, and disable event points;
- Provided a complete channel tracking solution. In this solution, the iOS channel analysis function is further enhanced. In addition to precise channel tracking, it also provides a fuzzy matching solution based on device fingerprints, which can be used together;
- Provided a recommendation sharing function, allowing users to recommend Sensors Analytics to their friends and enjoy corresponding exclusive benefits;
- Supports custom indicators in event analysis, allowing you to generate a new indicator by performing arithmetic operations on multiple indicators;
- In event analysis, supports graphical display of multiple indicators;
- In event analysis, the time granularity can be refined to minutes;
- In event analysis, it is now possible to calculate the unique de-duplicated count of a property;
- The JS SDK now provides the ability to collect the "page visit" event by default, and automatically collects preset attributes including URL, title, UTM-related tags, and whether it is the first day of visit;
- The JS SDK now supports callbacks;
- The visual tracking of the JS SDK now supports iFrames;
- JS SDK now supports server-side time to avoid client-side time anomalies;
- In metadata management, you can now hide certain events or user attributes;
- Now you can grant different access permissions for analysts to different events on the interface;
- Now each account can change its own password;
- Optimizations:
- Greatly improve the timeliness of data import in the cluster version;
- In the filtering function of time-type properties, support minute-level selection;
- In grouping time-type properties, support custom bucketing;
- Optimized the data sending strategy of iOS and Android SDKs;
- Optimized the exception throwing strategy of iOS and Android SDKs in Debug mode;
- Unified the values of JS, iOS, and Android SDKs for operating systems and terminals;
- Optimized the display style of user behavior sequence;
- Optimized the suggestion style of the filtering box in various analysis functions, added prompts to avoid misunderstandings;
- In the filtering of list-type properties, "match" can now support multiple selections and added "not match";
- In user segmentation, the events that "users have done" can now have an "or" relationship;
- In user segmentation, the "relative time" can now support custom time intervals;
- Optimized the operation of the time axis on the line chart of event analysis when there are many time points;
- Enhancements to FormatImporter.
1.4: Released on April 18, 2016
Update list:
- New features:
- Added user segmentation feature;
- Added user behavior sequence, which allows browsing the user list and individual user behavior sequences in the analysis result;
- In the Android and iOS SDK, added channel tracking related interfaces, and provided a solution for accurate channel tracking of apps in the iOS environment for iOS 9 and above;
- The backend can set the permissions of analysts to allow them to access only part of the event data;
- Improvements:
- Now both revisit and retention analysis can add multiple filtering conditions for events and user properties;
- Both the Android and iOS SDK can be set to automatically trigger sending when a certain number of data entries have accumulated;
- The window period for funnels can be customized;
- The steps in a funnel can now have custom aliases;
- When adding steps to a funnel, the filtering conditions for events can be selected as "or" relationships;
- When the event selection is "any event", all fields that appear in all events will be included as properties of "any event" in the drop-down menus for filtering and grouping;
- Can use "User ID" as a filtering condition for events;
- Added data access guide page;
- Optimized the user experience of visualized event tracking on the web;
- Enhanced the compatibility of visualized event tracking for various types of apps on Android;
- Now you can choose to manually trigger the query after setting all query conditions.
1.3: Released on January 31, 2016
Update list:
- New features:
- Added "Visual Event Tracking" feature to enable event tracking on iOS, Android, and Web platforms in a visual way; for the overall considerations of data access by Sensors Analytics, refer to here;
- SDKs (versions 1.3.1 and later) and import tools have added debugging mode for users to debug code and data;
- Added dimension dictionary feature to allow users to add corresponding dictionary mapping for a specific property;
- Custom queries now support user details for funnel and retention analysis;
- Optimizations:
- Significantly optimized the performance of sampling queries in the cluster version;
- Now, if the property used for grouping is a numerical type, you can choose to bucket it according to "discrete values";
1.2: Released on December 23, 2015
Update List:
- New Features:
- For first-time users, added "Feature Guide" to help users better use the product;
- Added the ability to hide events. Hidden events will not be included in "Any Events" selection;
- Supports analyzing visit frequency based on "number of visits";
- String type field filtering now supports regular expression matching;
- When creating a funnel, each step now supports multiple filtering conditions;
- In event analysis, the "average value per person" of numerical fields can also be used as an analysis metric;
- Added a forced refresh function. Clicking the refresh button in the upper right corner of the page will ignore the query cache and force a recalculation;
- Added query sampling functionality. When dealing with a large amount of data, sampling a small portion of users can quickly verify assumptions;
- Added data deletion tool;
- Added profile_set_once interface, which ignores the value when setting a profile if it already has a value. This is very effective in setting registration channels and other scenarios;
- Optimization:
- Removed the limitation that string-type properties with a value exceeding 2000 cannot be grouped;
- The SDK and import tool have added restrictions on property names, and some reserved fields cannot be used as property names: id, first_id, second_id, users, events, event, user_id, date, datetime, distinct_id, original_id, time, properties. If these fields were used as property names before, they will be automatically renamed during the upgrade. For example, users will be automatically renamed to _users;
- Reorganized the relationship between properties and events. Now properties are globally unique, and properties with the same name in different events are of the same type. Only one display name is set and it applies to all;
- Greatly improved the query performance of retention analysis;
- Significantly improved the processing performance of the batch import tool;
- Significantly optimized the operability of the cluster version;
- Greatly optimized memory usage to avoid exceeding memory limits due to excessive data.
1.1: Released on October 31, 2015
Update list:
- Added "Account Management" and "Overview Authorization" features;
- There are three types of accounts, each with the following functions:
- Administrator:
- Permission management: has the "Account Management" function and can also perform "Report Authorization";
- Data analysis: all data analysis functions can be used;
- Overview: can view overviews shared by themselves and others, create overviews, and edit overviews created by themselves; and can share overviews with other users through the "Overview Authorization" function;
- Funnels: administrators can create and delete their own funnels, and the funnels created are visible globally;
- Data Analyst:
- Data analysis: all data analysis functions can be used;
- Overview: can view overviews shared by themselves and others, create overviews, and edit overviews created by themselves; because it does not have the "Overview Authorization" function in "Permission Management", overviews can only be used personally;
- Funnels: Analysts can create funnels and delete their own funnels. The funnels they create are only visible to themselves.
- Regular users:
- Overview: Can view shared overviews from others. After clicking on an overview, they can only adjust the time range and cannot make other filter and grouping adjustments.
- Administrator:
- Added three import tools for specific data sources (CSV, MySQL, Nginx logs). FormatImporter;
- Significantly improved the processing speed of all profile-related operations;
- Improved user experience:
- Improved occasional lag and less responsive scrolling issues when using Safari on mobile to browse data overviews;
- Improved sliding experience when switching bar chart time on mobile;
- Improved input experience during the filtering process when querying data;
- Fixed bugs related to user experience and functional modules.
1.0: Released on September 25, 2015.
Update list:
- Added "Custom Query" function, allowing users to query all data of Sensors Analytics using standard SQL;
- Added "Multi-Metric Analysis" function in Event Analysis, which allows for the comparison analysis of multiple metrics from the same event or multiple metrics from multiple events, and the ability to save to "Bookmarks" and "Data Overviews";
- In behavior event analysis, funnel analysis, retention analysis, and return frequency, when using the grouping feature, users can customize the grouping interval when the grouping field is a numeric type;
- In "Data Management", added management of "Virtual Events", allowing users to freely combine multiple predefined events and filters to configure virtual event types;
- Added "User Detail Download" function:
- In "Behavior Event Analysis", "Funnel Analysis", "Retention Analysis", and "Return Frequency" or any other analysis where the query result is a number of unique users, users can download the detail data of these users in CSV format;
- The detail data includes User IDs, User Profiles, etc.;
- Optimized the presentation format of "Data Overviews"
- Added the "Data Validation" function, allowing users to check if the data meets the requirements, and create corresponding events and properties based on the validation.
- For numerical property grouping in the four types of analysis, users can edit the grouping intervals.
- Added the "Import Status Check" function, allowing users to view the errors and progress of the imported data.
- Fixed some bugs that affected the import process.
- Fixed some frontend bugs that affected the usability.
0.2 : Released on August 15, 2015
Updates:
- Added the "Bookmarks" function, allowing users to save frequently used queries.
- Added the "Data Overview" function, visualizing the saved bookmarks.
- Added the "Data Management" function, allowing users to customize the display names of events and properties.
- Fixed some frontend bugs that affected the usability.
0.1 : Released on July 1, 2015
Updates:
- Launched the "Behavior Events Analysis" function.
- Launched the "Funnels Analysis" function.
- Launched the "Retention Analysis" and "Return Frequency" functions.
Note: The content of this document is a technical document that provides details on how to use the Sensors product and does not include sales terms; the specific content of enterprise procurement products and technical services shall be subject to the commercial procurement contract.
 Popular Searches